
Welcome to the new Traders Laboratory! Please bear with us as we finish the migration over the next few days. If you find any issues, want to leave feedback, get in touch with us, or offer suggestions please post to the Support forum here.


traderlu
-
Content Count
12 -
Joined
-
Last visited
Posts posted by traderlu
-
-
Does anyone know of a way around this to plot the data gathered from the 1Tick to plot on a minute chart? There has to be a way around this. Maybe creating a function and access...I don't know just thinking out loud...like I said I am new to the functionality of TS and need help.
dbntina,
you may want to look into the All Data Everywhere (ADE) DLL/function set on the tradestation forums. Apparently, it allows you to send receive data from chart to chart, without the time/tick restrictions you mentioned. I haven't had time to delve into it myself, but I think it's exactly what you're looking for. Here is a link to the ADE FAQ on the tradestation wiki:
https://www.tradestation.com/wiki/pages/viewpage.action?pageId=8975
Hope it helps.
-Luis
-
Could you please post the source code so I could port it to Amibroker?Thanks!
sure thing, here goes:
{Scalper Buys and Sells		7/18/2007
Written by Luis Gomez
inspired by John Carters "Mastering the Trade"
}

inputs:
buyColor(white),
sellColor(white),
width(3);
variables:
highBarsAgo(1),
possibleHighBarsAgo(1),
possibleHigh(-2),
hightoBeat(-1),
barsSincePaint(1),
lowBarsAgo(1),
possibleLowBarsAgo(1),
possibleLow(10000001),
lowtoBeat(10000000),
triggerPriceSell(-1),
triggerPriceBuy(1000000),
trend(1),
_UP(1),
_DOWN(-1),
_ON(1),
_OFF(-1);


//***************************************************
//****** Find and plot the highest swing high *******
//***************************************************

if trend = _UP then begin
if swingHighBar(1,H,2,barsSincePaint+2) > -1 then begin
	possibleHighBarsAgo = swingHighBar(1,H,2,barsSincePaint+2);
	possibleHigh = H[possibleHighBarsAgo];
end;

if possibleHigh >= hightoBeat then begin
	highBarsAgo = possibleHighBarsAgo;
	hightoBeat = possibleHigh;
	triggerPriceSell = L[HighBarsAgo - 1];
end;

if C < triggerPriceSell and
	highest(high,highBarsAgo) < hightoBeat then begin
	plotpb[highBarsAgo](H[highBarsAgo],L[highBarsAgo],"",sellColor);
	alert("Scalper Sell");
	trend = _DOWN;
	barsSincePaint = highBarsAgo-1;
	hightoBeat = -1;
	lowtoBeat = 10000000;
	triggerPriceBuy = 10000000;
	triggerPriceSell = -1;
	highBarsAgo = 1;
	possibleHigh = -2;
end;

end;

//***************************************************
//****** Find and plot the lowest swing low *********
//***************************************************

if trend = _DOWN then begin
if swingLowBar(1,L,2,barsSincePaint+2) > -1 then begin
	possibleLowBarsAgo = swingLowBar(1,L,2,barsSincePaint+2);
	possibleLow = L[possibleLowBarsAgo];
end;

if possibleLow <= lowtoBeat then begin
	lowBarsAgo = possibleLowBarsAgo;
	lowtoBeat = possibleLow;
	triggerPriceBuy = H[LowBarsAgo - 1];
end;

if C > triggerPriceBuy and
lowest(L,lowBarsAgo) > lowtoBeat then begin
	plotpb[lowBarsAgo](H[lowBarsAgo],L[lowBarsAgo],"",buyColor);
	alert("Scalper Buy");
	trend = _UP;
	barsSincePaint = lowBarsAgo-1;
	possibleLow = 10000001;
	lowtoBeat = 10000000;
	hightoBeat = -1;
	triggerPriceBuy = 10000000;
	triggerPriceSell = -1;
	lowBarsAgo = 1;
end;

end;

barsSincePaint = barsSincePaint+1;
if trend = _UP then highBarsAgo = highBarsAgo + 1;
if trend = _DOWN then lowBarsAgo = lowBarsAgo + 1;
setPlotWidth(1,width);
All I ask is that my name stay in the code, please. Thanks, and enjoy!
-
Thanks, Tin, for the clarification. Very straightforward approach, I like it!
-
Nice, Tin. Question for ya: What role did volume play in your analysis of this particular bar? That is, would it have carried the same weight in your decision to short, had it been a low(er)-volume bar?
I've been following your candlestick/volume analysis threads and trades, and it is great stuff! Very interesting. Keep up the good work,
-Luis
-
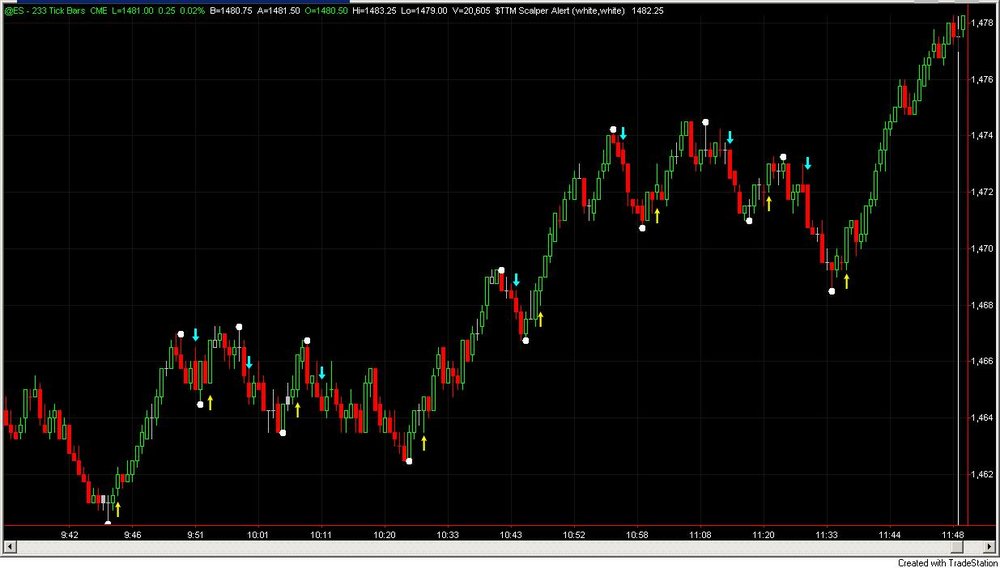
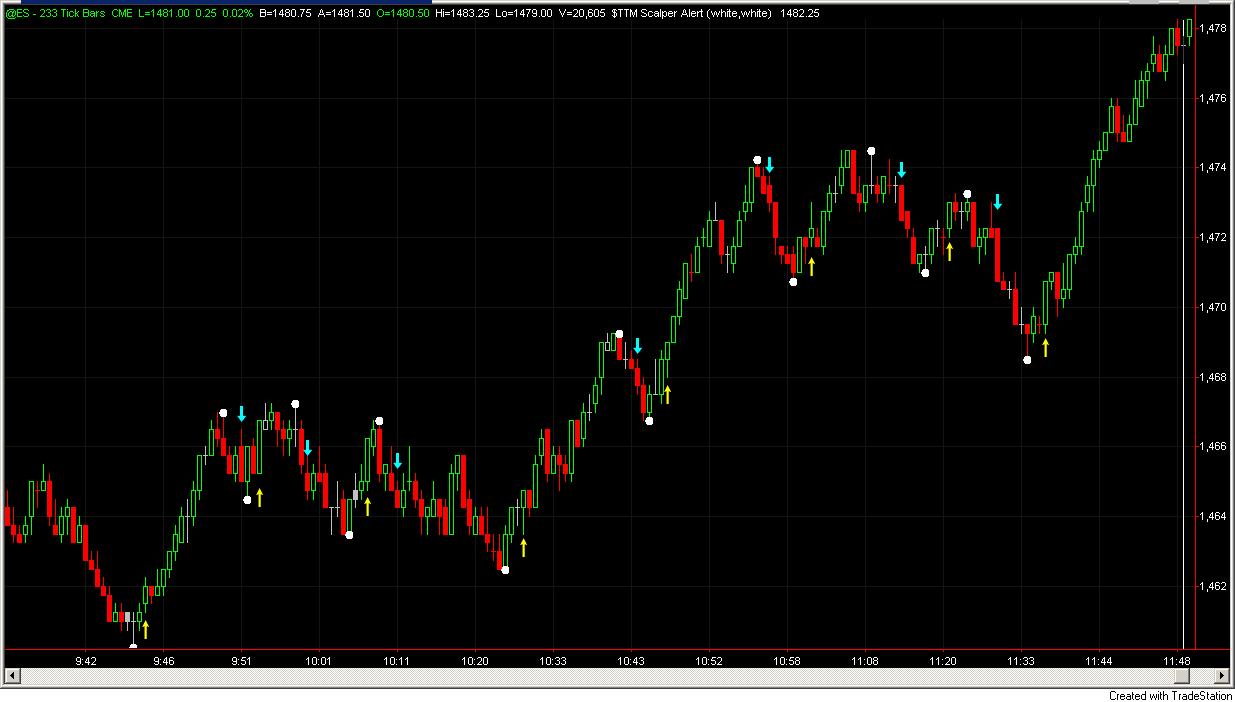
The indicator needs a minimum of THREE bars to paint a bar. However, it can (and usually does) take more bars than that during sideways consolidation.
Please see the attached screenshot. The cyan/yellow arrows indicate when the signal actually fired off. So, yes this indicator is very dangerous in chop situations, assuming one is taking all buy/sell signals. Please listen to cooter and be very careful in your usage of this tool.
As far as I know John Carter uses it as follows:
a) Signal confirms a move against a support/resistance level
b) Uses it to time entries/exits. For instance, I've heard him say that if long, and a Scalper Sell + 2 red TTM's fire off, he will exit his remaining position. I have also seen him initiate trades based on Scalper Buy + 2 Blue TTM's
The point is, one needs to filter this to be used appropriately (just like every other indicator).
-
Walter, thanks for your input. Unfortunately, if the lag is excessive, then I wouldn't have as much interest in this method as I first thought. Maybe in time I will try out Sierra, and I'll just use Raul's posted workspace. Thanks for the prompt replies.
-Luis
-
Hi traderlu... I had a little dissapointment on real time as they eventually lag quite a bit... so for timing purposes I think it doesnt get better to what I am used to use... now for an overall trend determination it is a very nice tool.. it shows the price action structure very clean... cheers Walter.I see. So you would lean more towards using it as a trend indicator, such as noting if its making higher peaks and valleys, instead of trying to catch the color changing swings. Also, would I be correct in suspecting that in a fairly choppy market, you be buying near the highs and selling near the lows if you were to take the Heiken-Ashi signals (change of color)?
-
Hey guys, nice charts!
I would be very interested to know how these charts are computed/calculated. How exactly does the HMA factor into bar creation? Is the range overlayed on top of the HMA? The bars don't really look like range bars, since each bar seems to overlap.
I guess I would just like a bit of insight into how the bars are plotted. Anything you could provide would be greatly appreciated. Thanks!
-Luis
-
Hi All,
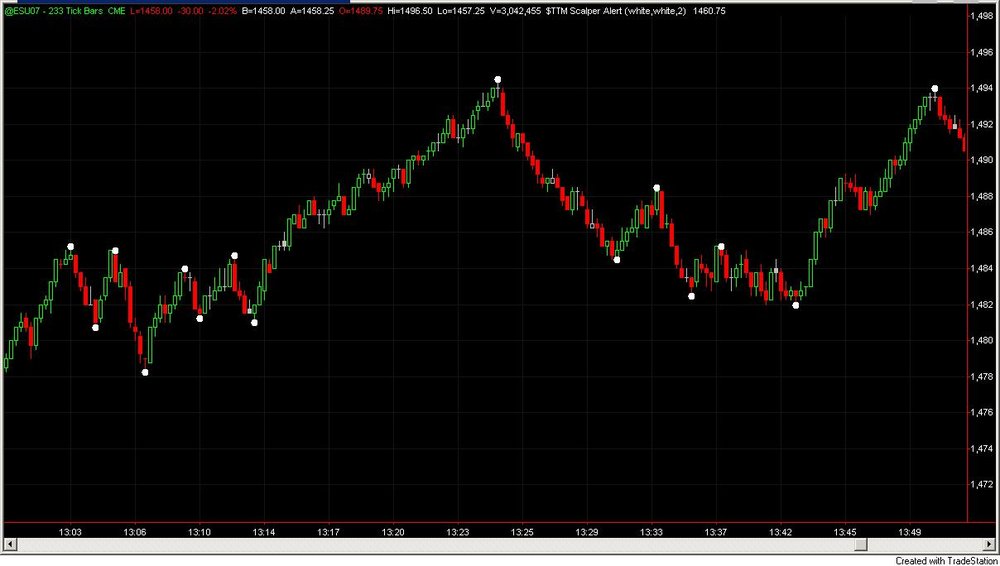
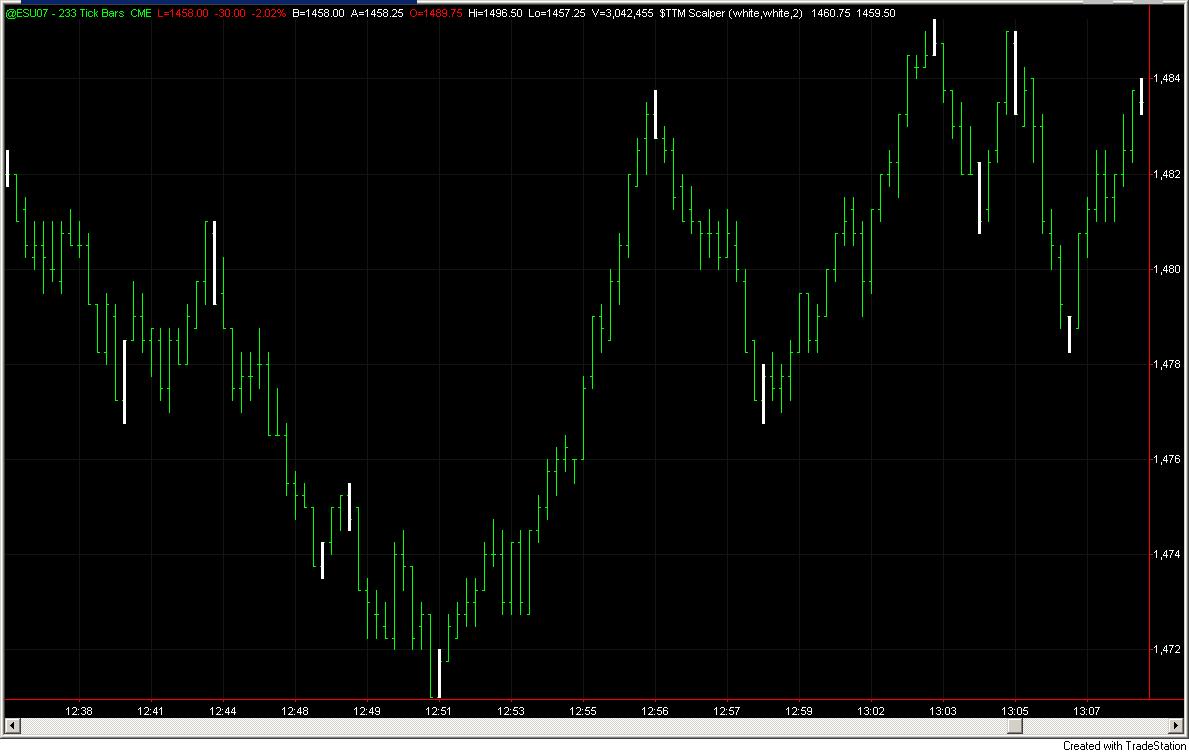
Here is a ShowMe version of the Custom Scalper Alert. It is useful for those that prefer candlesticks to OHLC bars when using other paintbar studies (such as Heiken-Ashi).
Good Luck!
-Luis
-
You are all very welcome
 Glad I could help.
Glenbee, I will be posting the ShowMe in a separate thread shortly.
As far as how the indicator actually works, John's description of "three higher closes" is a bit misleading. I disregarded this criteria in the code. It is merely based on swing highs/lows. I'll give an example for a Scalper Sell:
1. You get a high that's at least as high or higher than the previous two bars. This bar is a potential paintbar.
2. The next bar makes a lower high; The low of this bar is the trigger.
3. From here, if we do not make a higher high and we get a close below the trigger, we paint the swing high bar. Concept is simple but was a bit tricky to program (for me, at least).
By the way, I got this description from the following video:
http://www.tradethemarkets.com/products/item7.cfm
Hope it helps!
-
Hi All,
I have been an avid reader of this forum for a while. I just thought I would contribute to an internet that I have taken so much from...
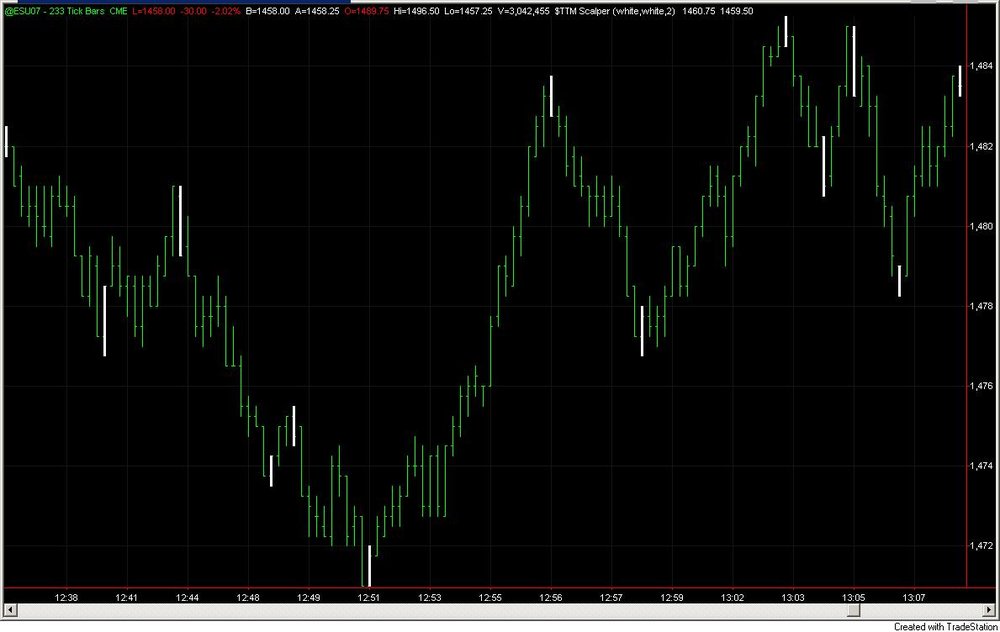
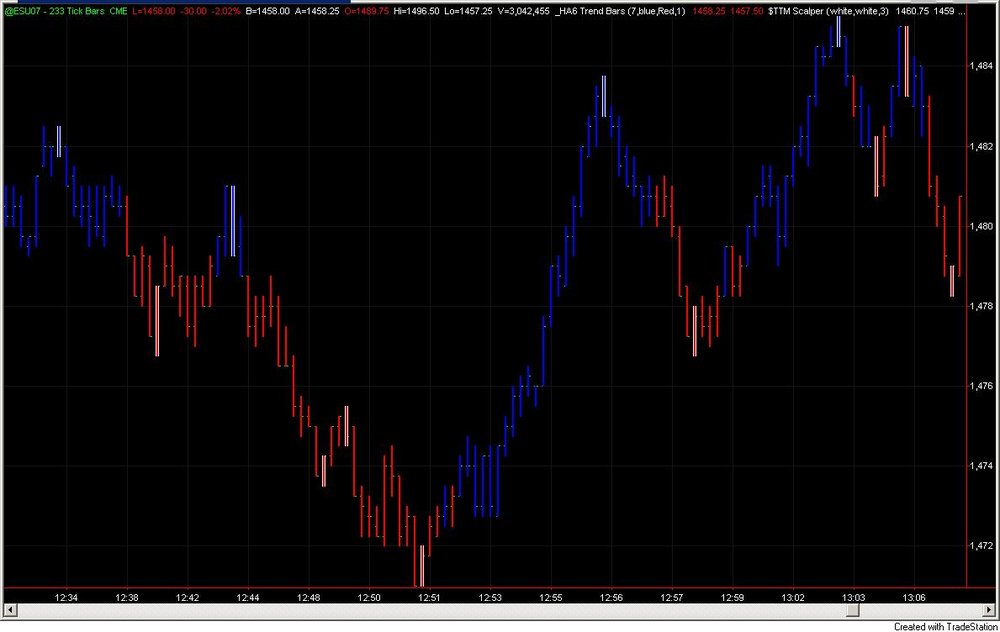
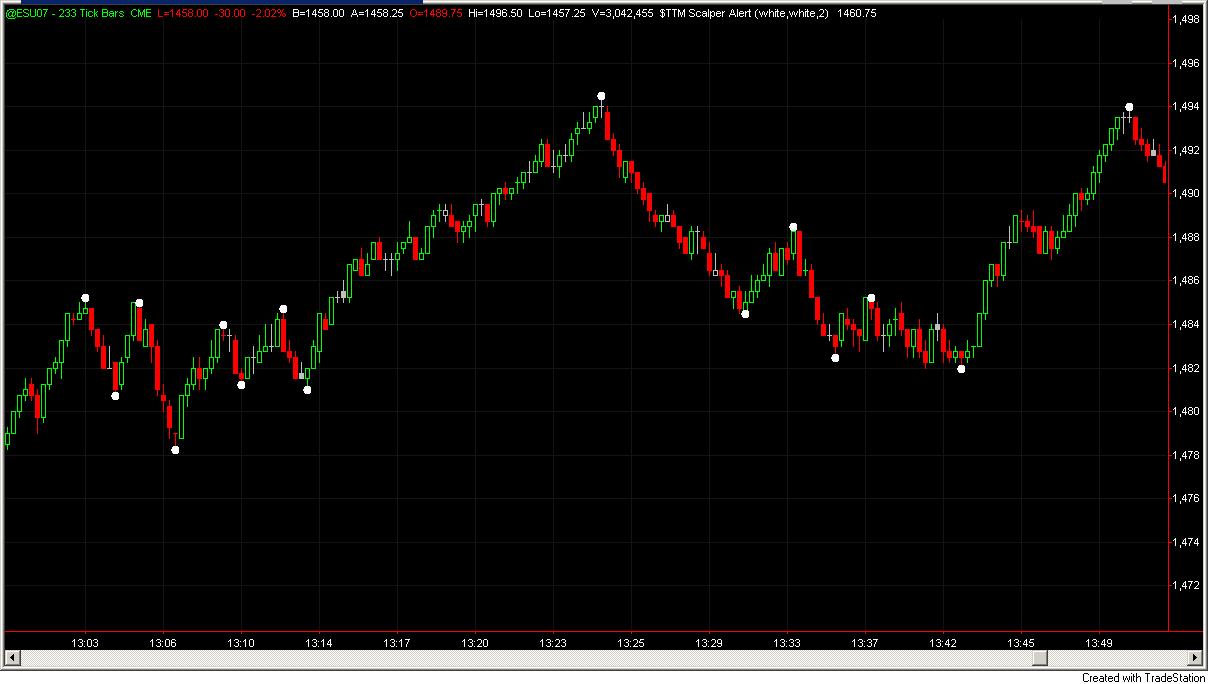
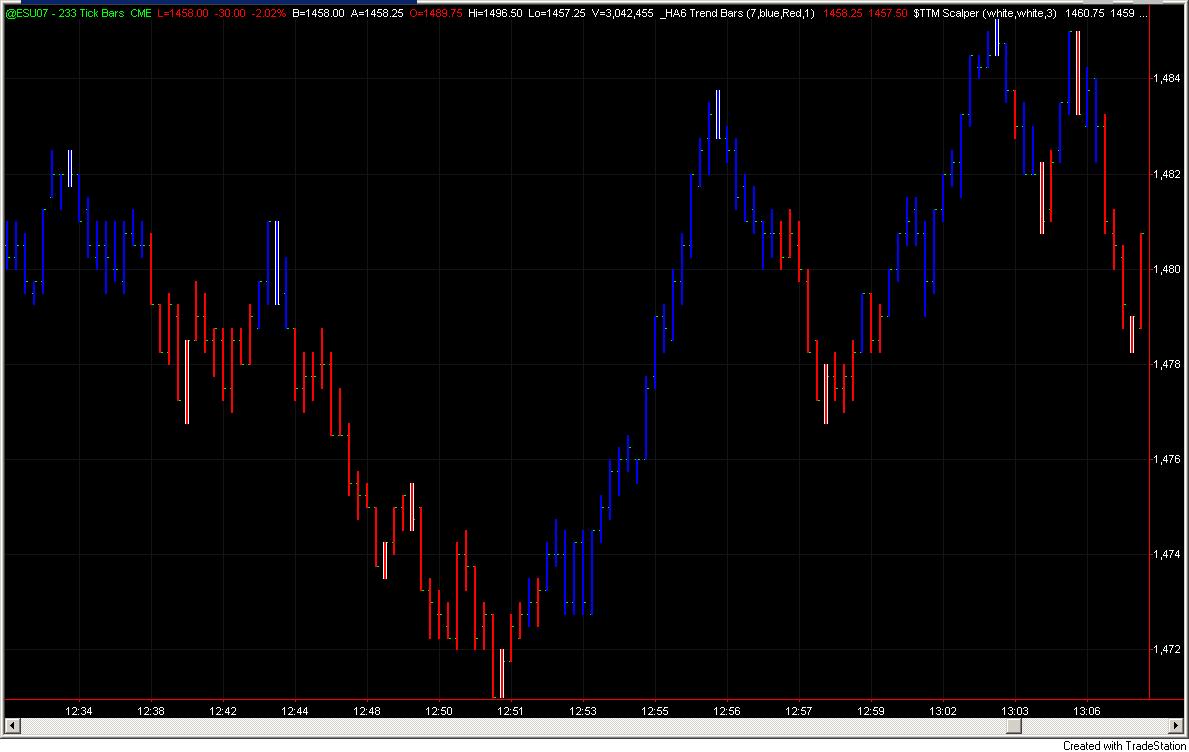
Here is a replica of Scalper Buys and Sells. As far as I can tell, it matches up perfectly. If you would like to use it along with the Heiken-Ashi paintbars, I recommend you set the plot thickness to at least two more than the thickness of the Heiken-Ashi (In the attached picture, the Scalper Indicator is set to 3 and the Heiken-Ashi is set to 1). Also, please note that candlesticks are not supported.
Bugs/feedback are appreciated. I hope you all enjoy. Happy Trading,
Luis
p.s. For those of you who like to use candlesticks, I also have a ShowMe version, which places a dot on the highs/lows...Let me know if there is interest.
Scalper Buys/Sell Replica
in Trading Indicators
Posted
Dovetree,
I have had that same problem. I think it has to do with the order in which you add the analysis techniques to your chart. Try adding the Heiken-Ashi first, then the Scalper, or vice-versa. I can't remember which was the right order. Just don't add them at the same time. This should do the trick. And don't forget the thickness! Hope this helps
-Luis