
Welcome to the new Traders Laboratory! Please bear with us as we finish the migration over the next few days. If you find any issues, want to leave feedback, get in touch with us, or offer suggestions please post to the Support forum here.


gaelgss
-
Content Count
31 -
Joined
-
Last visited
Posts posted by gaelgss
-
-
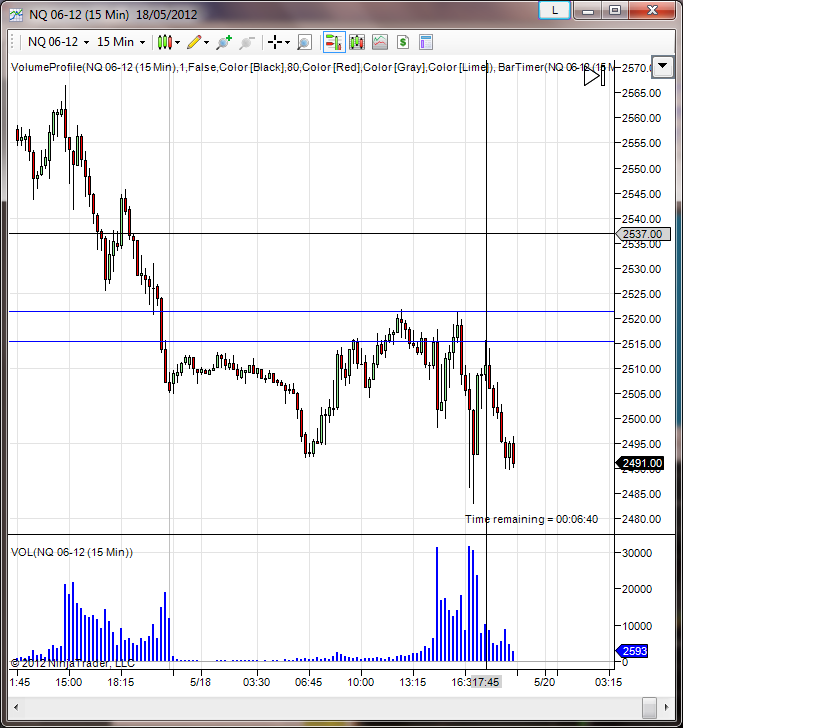
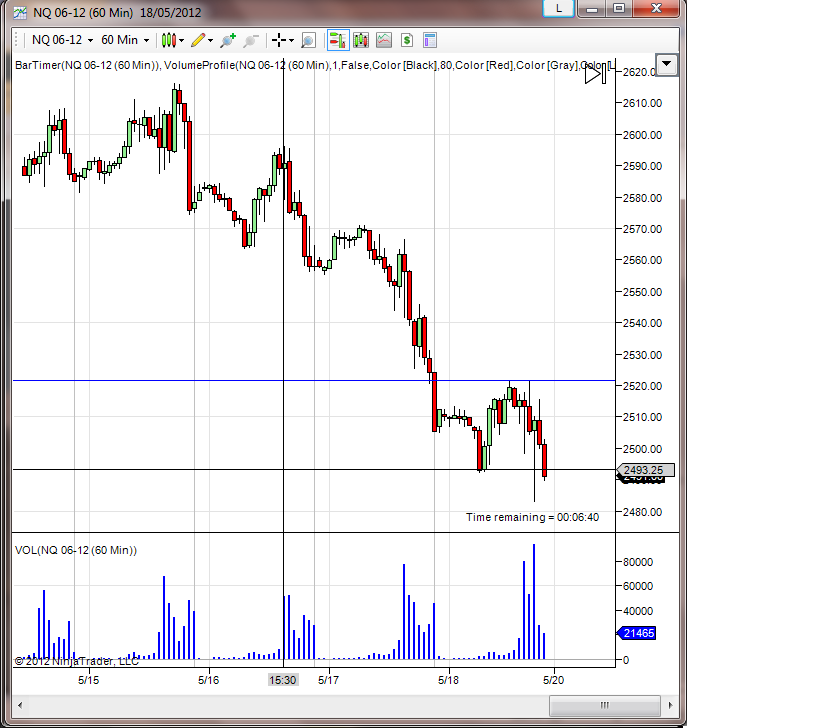
So we are looking for shorts until we reach the potential Support level, around 2400 right?
Which levels should the nasdaq daytrader anticipate for tomorrow?
The following 15 and 60 minute charts show the most recent action in the NQ. I have identified a Resistance area between 2515-2521, are there any other areas that shoul be taken into consideration for NQ daytraders?
-
Again, in an uptrend, your "support" is the trendline as well as previous swing points (preferably both). Remember what Raschke says in the "article" I wrote on support & resistance and trading trend, that, transitioning from a trading range to a trend, you must be prepared to switch from trading reversals to trading retracements. And remember that by defining "current" as only the last few days, your target becomes the upper trend channel, or supply line. If you find yourself in profit, you cannot then change your perspective midstream and decide to hold on for a test of the last swing high, or the one before that, or the one before that.
Db
I thought that the support provided by a trendline is coincidental, since TL are drawn by traders and don't represent a large number of trades?
If this is the case, would you look for long trades at the TL or only if it coincides with a previous swing low?
-
You could argue that you're in an uptrend if you limit your timeframe to the 10th and forward. And if you drop your interval to 1m or less, you can find “trends” all over the place. So I suggest you not become entangled in the trend question and think about probabilities. Your market broke its uptrend a week ago and is in the process of testing the last swing low from the downside. So what are the probabilities for upside here? What is more probable of success, a long trade or a short one? What would be your strategies and tactics for either? Or both? What do you need to do to avoid being surprised?Db
So even though the 60 min chart shows a series of higher highs and higher lows, starting from the 9th of May, you don't consider this an uptrend?
Answering your questions:
1- The probabilities for the upside remain as long as there is a succesfull test of the last swing at 5480, can you quantify the exact probabilities for the upside?
2- I would say a long trade has a higher probability of success because the market is making higher highs and higher lows, although another thought I have is;
There hasent been a considerable number of trades in this area to provide sufficient support, so we could anticipate a further test of the last swing low. If there was stronger support, provided by a larger number of trades in this area, I would be more biased towards the long-side.
3- When looking for long trades, I look for climatic action, and signs of selling exhaustion at a pre defined level of support. My problem here? I have no predifined level of support.
4- In order to avoid being surprised, I should anticipate the different scenarios that I foresee at this, still unidentified, Support level and have a plain for each one.
My main issue here is following the wyckoff methods first step
The first step for a trader is to determine the current trend of the market.
-
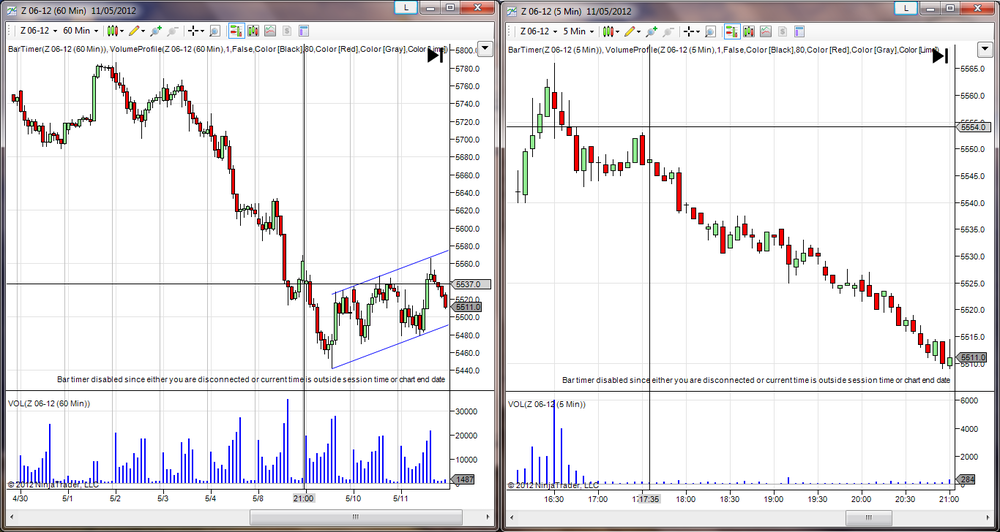
One question for the experts...
When trading the wyckoff way, the first step is to identify the current trade and then establish ones place in the trend.
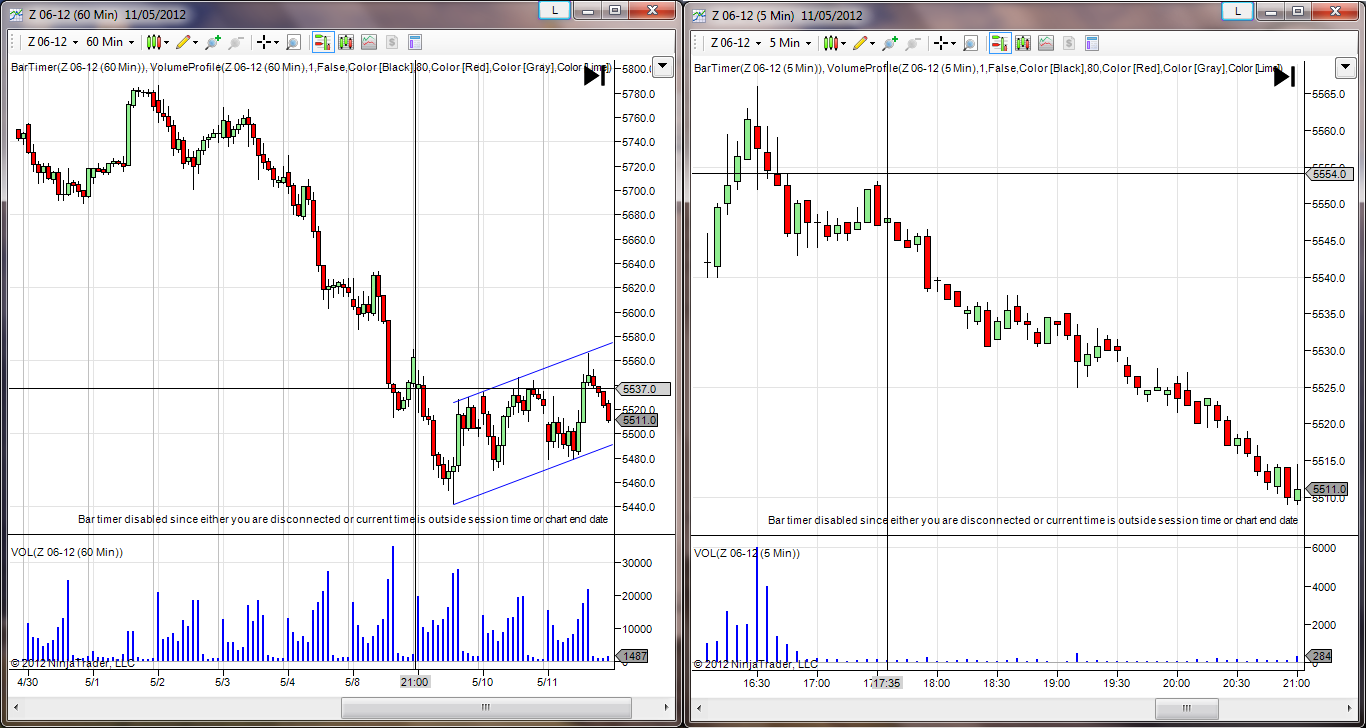
The following image shows a 60 minute and 5 minute chart of the ftsee futures, before the opening.
By looking at the charts, is it correct to say that we are in an uptrend, although the 5 minute chart shows an obvious downtrend?
In this situation, would Wyckoff look for long setups?
Cheers.
-
If this is the case, is it fair to say that traders need 2 completely different strategies?
1 for imbalanced markets, based on retracements.
1 fo balanced markets based on reversals.
-
Depends on how many trades per day/week your strategy generates. And if you change any controlled variable in the process, you have to start over.Db
Ok so assuming my strategy generates 10 trades a week on average and all variables are mantained, how many trades would be necessary?
I think I remember Mark Douglas suggesting a minimum of 20 trades but I'd like to know your opinion on this.
Cheers.
-
S&R and S&R levels are hypotheses. In order to profit from them, you'll have to test them, preferably through sim. The testing will also tell you whether or not the entry -- which you have not yet defined (see my previous questions) -- is worth working on.In other words, I have no idea whether it's valid or worth working on or not. That can be determined only through hindsight – and trades can't be taken in hindsight – or through testing, though even that is not a sure thing, being only a suggestion of probabilities.
Db
How many trades are necessary to backtest a setup and get an idea of its probabilities of success?
Many thanks again.
-
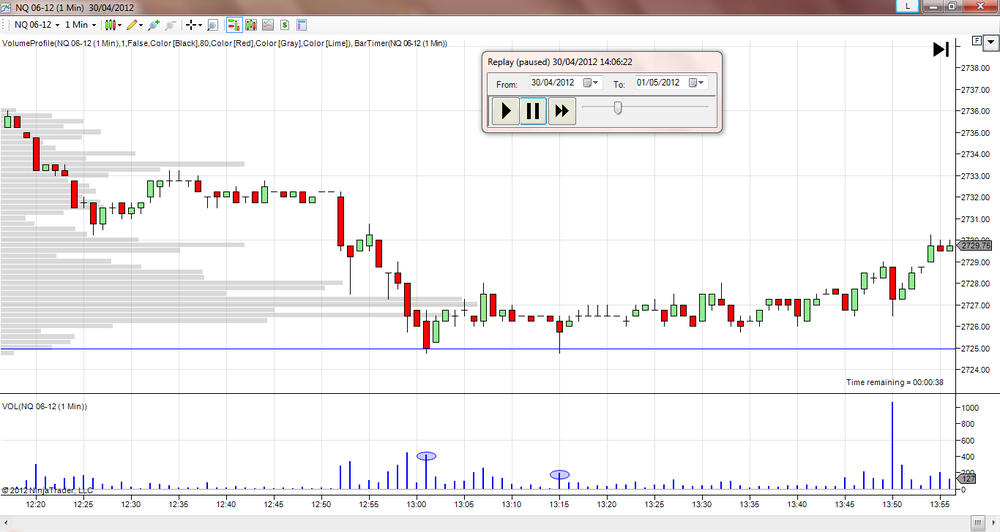
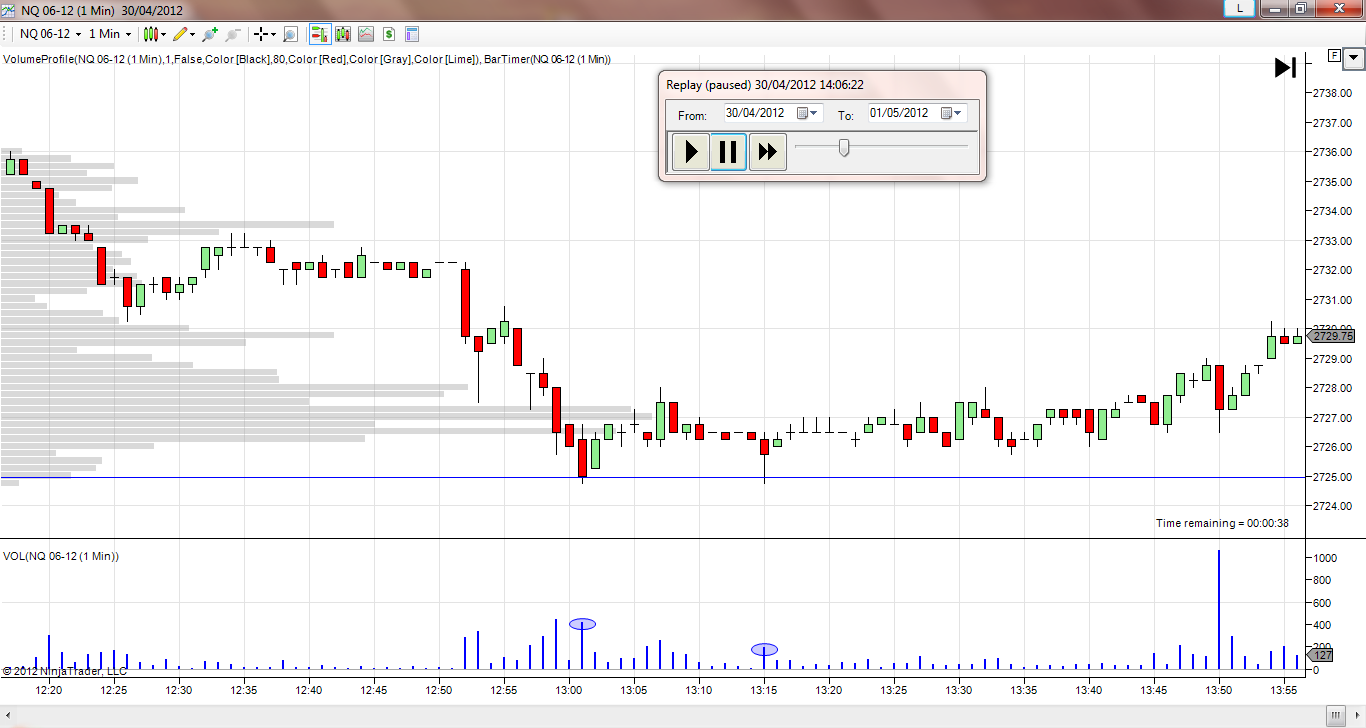
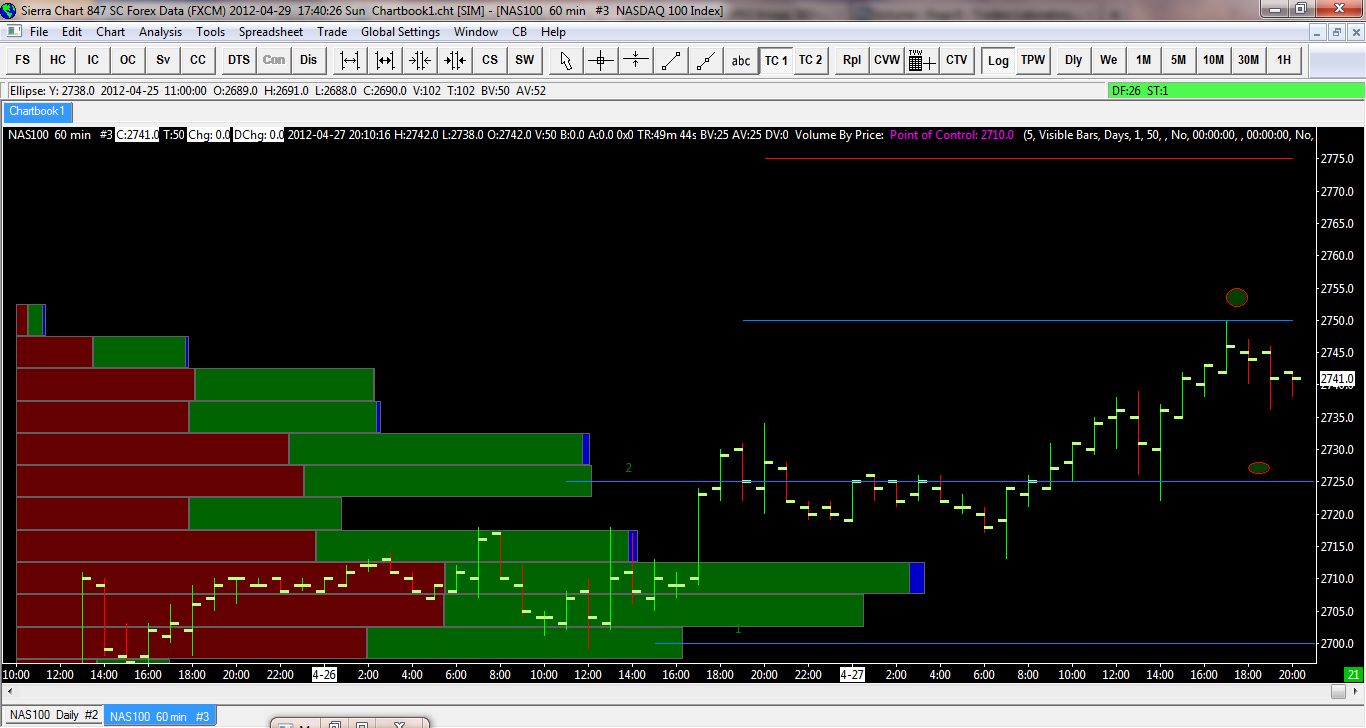
Today I mantained the same levels as yesterday, but I included the midpoint of the trading range from the 18th to the 20th, which coincided with the midpoint of the 11th-13th trading range.
The level also coincided with a recent swing low, at 2710. The attached 60 min chart shows this.
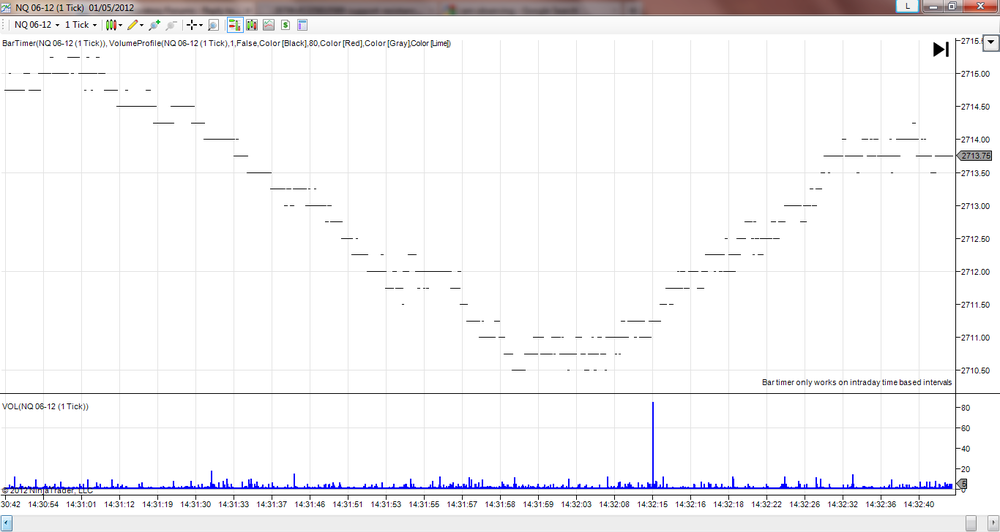
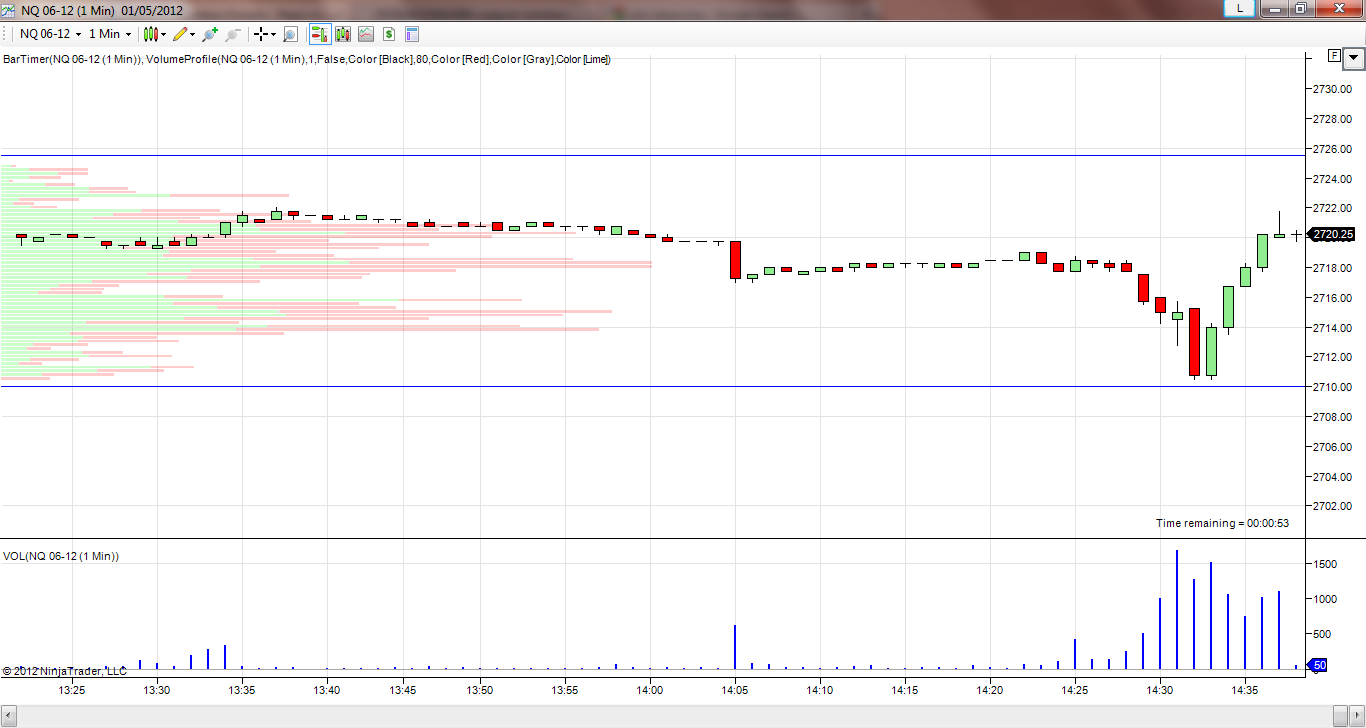
Just now I was replaying the market and noticed how price bounced of 2710 violently, giving me no chance to enter the trade on the 1 min chart.
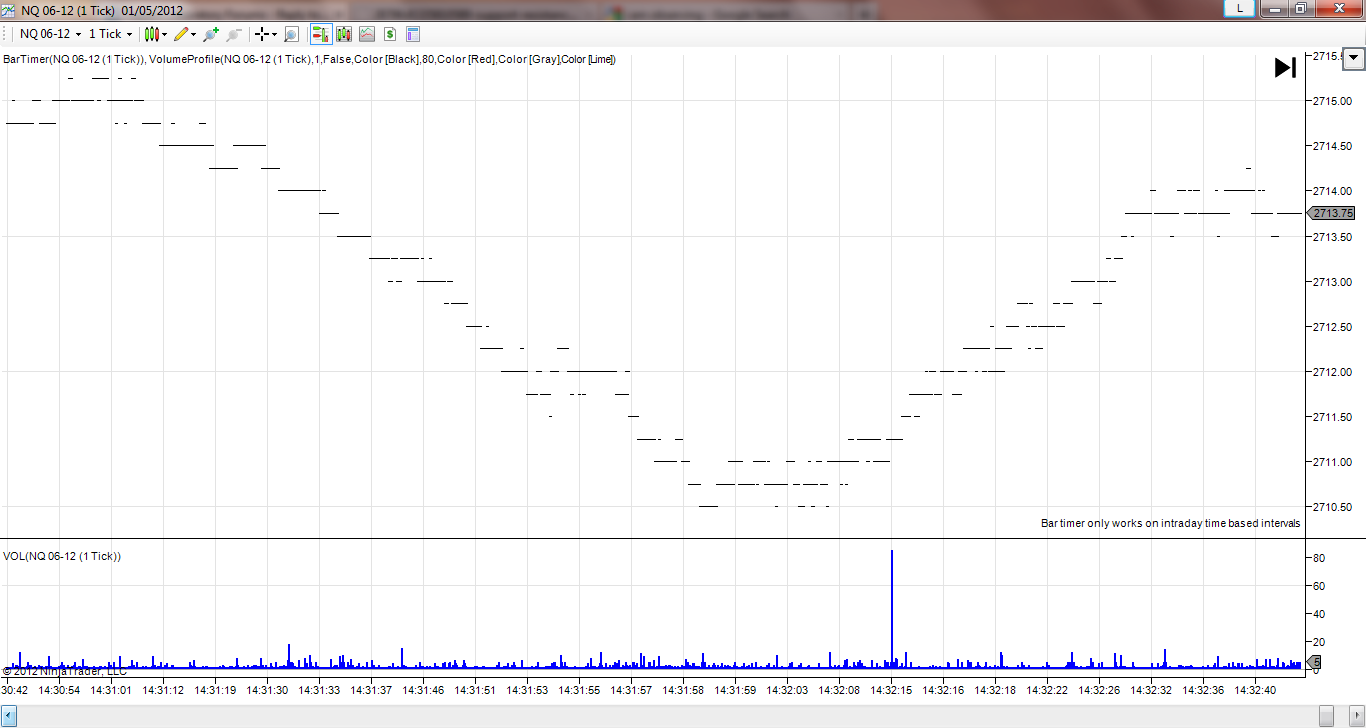
I looked at the "anatomy" of this reversal on the tick chart and noticed a double bottom that could've given me a nice entry.
Attached you can find the 60 min chart (macro), the 1 min chart where I was looking for the entry and the 1 tick chart, that shows the reversal in detail.
What do you think of this Db, I am on the right track toward developing an edge? At the moment I am contemplating two entry setups;
1- Test of support on lower volume, as explained in my previous chart using a 1 min chart.
2- A double bottom on a 1 tick chart at a support line.
I know that there is a lot to this such as stop loss distance, proffit target, and I will need to spend a lot of time testing the setup on historical charts but is this a good foundation?
Once I have defined the setup I can go into improving it and doing the possibility mapping right?
Thanks a lot for your advice.
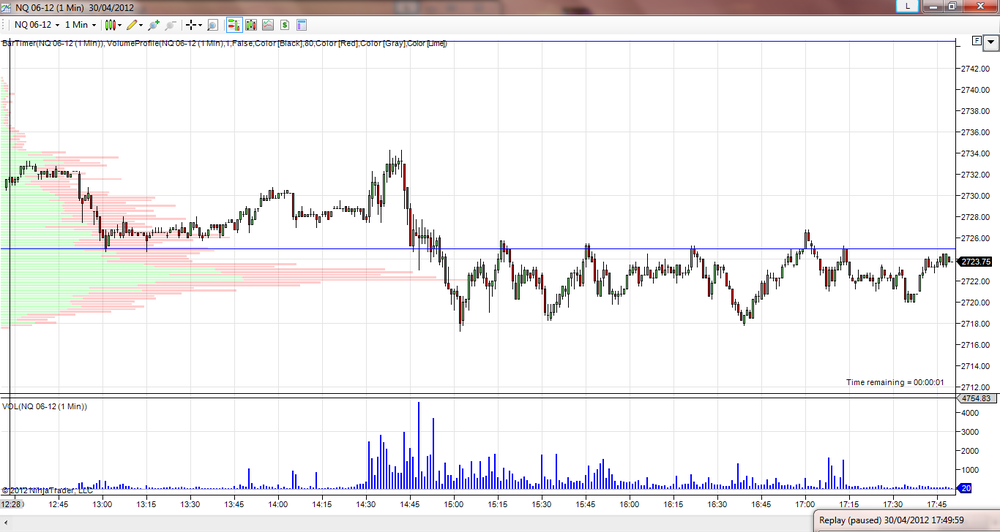
Edit= THis was a very nice long, I just replayed the rest of the market and it went up to resistance at 2045, a 35 point move


-
Did you enter the trade? If so, how? Were you watching as the price hit your target? If so, how did you enter? If not, did you place a buystop? What kind? Market? Limit? Stop limit?Db
No I didn't enter the trade because I haven't yet defined my entry setup.. I am simply observing how price behaves as it approaches the pre-defined S/R levels in order to identify a pattern.
Yesterday, the market tested the 2725 level succesfully twice, the second time on lower volume, indicating lower selling interest at this level.
What this be a valid setup to enter the trade? Is this an entry thats worth working on?
Attached Is a 1 min chart with the setup identified.
-
The 2725 level posted yesterday turned out to be important. It acted as support at the beginning of the session and then as resistance for the channel developed during the trading day.
Any thoughts on this?
-
Thanks DB, I dont feel confident enough to do this but lets give it a go...
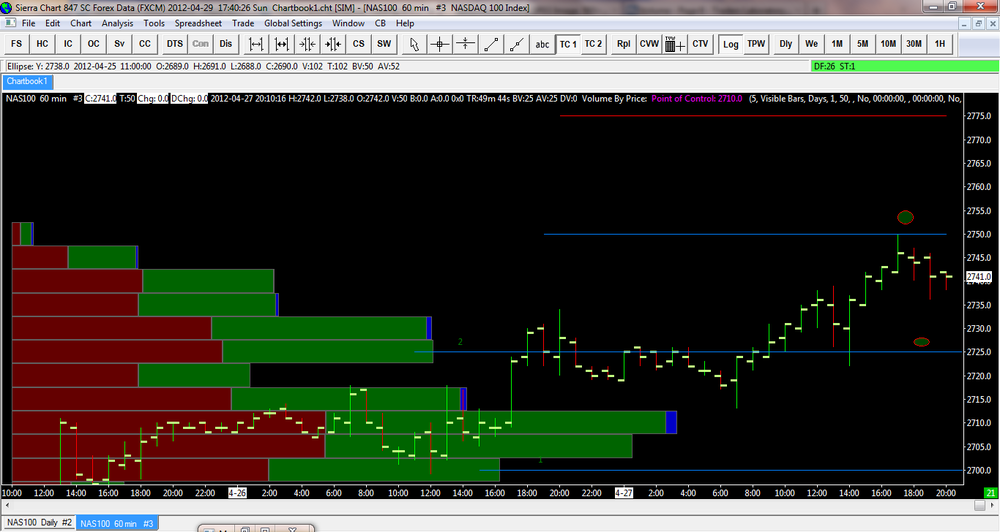
From the macro, I ha plotted the S/R lines on a 60 minute chart. Since the trend is obviously upwards, I would be looking at going long at a test of support or a a breakout of Resistance that turns into support.
In the following 60 min chart, I would be looking at:
1- Going long at support around the 2725 area
2- Going long on a breakout and test of the 2750 area
I would consider the Resistance line at 2775 a potential target, in the charts the green eplipses represent Long entries.
I look forward to reading other peoples views on this as I am pretty sure mine are very poor...
-
I moved your post here since my post should have been here in the first place, as I explained above.As for your question, the point of this thread is to trade "in foresight", i.e., use this display to create a trading plan for the following session. Since your question has been answered many times in this thread with many examples, I'm afraid you're just going to have to read it.
Sorry

Once you have your plan together, however, if you have a question that hasn't been asked already, feel free to post it.
Db
I have read this thread entirely and I believe your answer to this has been. " You should only plot the S/R lines that are more likely to affect current price action, these are the lines that are closer to the current price"
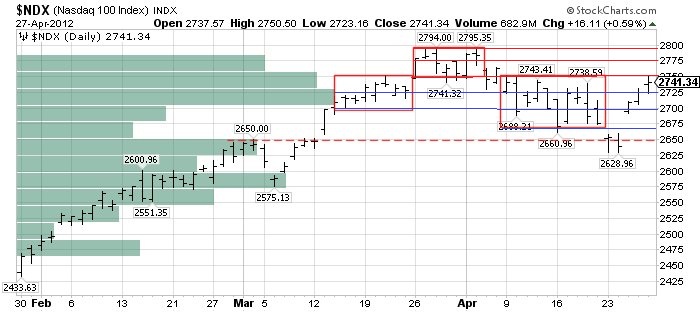
I have added S/R lines to your chart, assuming the market opens close to the 2741. I would appreciate some feedback regarding my lines, are they enough or to many? Are they drawn in the correct area? (I am aware that this is not a pin pointing exercise)
Blue lines are support and red lines are resistance.
Cheers.
Edit= Do you consider 2650 as support simply because it acted as resistance on the 29th feb and on the 9th of March and resistance becomes support or other other reasons?
-
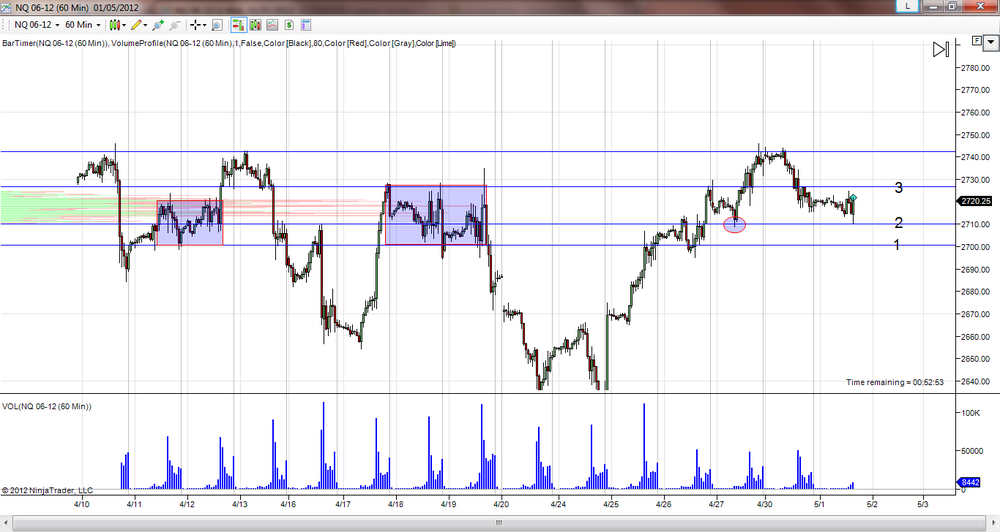
I
Hello Db,
In this chart you have identified 3 "cajas famosas".
Which of these levels would you identify as S/R for the next trading day?
Presumably you don't take the top/bottom and midpoint of each range as S/R as there would be way to many lines on the chart right?
-
The reality of daytrading is very different from everybody's expectations. However, few people prepare for it. If you understand that the preparation can take a great deal of time, you may find success before you become discouraged. But even if you don't find success, at least you won't be broke. Understand also that you must have or acquire certain personal attributes, such as patience, tolerance, calm. These may come with a thoroughly-tested strategy, but it helps if you possess these qualities to start with.
Db
One question about your method of trading. without getting into specifics;
Do you still trade the first 90 minutes from the opening of the NQ futures?
How many trade setups do you normally find in a day?
Is it feassible for a newbie to try and trade in this period?
thanks a lot again.
-
Why?Because by day-trading I eliminate overnight risk exposure and I will find more trading opportunities. (I will also sleep much better)
Also the leverage will allow me to grow my account once I become consistent.
Again, why?I am considering tradingthe NQ futures because it has good liquidity, volume and volatility but I could always trade other index futures.
The TickQ indicator seems like a logical approach that appeals to me.
Also your boxes seem to work well in this market in 2008
Not the best choice for a bread-and-butter setup. The Hinge is the cookie in the lunch box. You won't see it that often. Go for the sandwich.Ok thanks for the advice, I will read on more setups, would you care to point me in the right direction? One setup that Ive been thinking about is the re-test of S/R on lower volume with a TickQ divergence, what do you think of this?
Maybe. Whether the trade works or not will depend in large part on how it's managedI understand, but until I have an entry point theres nothing to manage...
Watching price move is always a good way to start. As for developing your edge, don't be concerned about that at the beginning. By determining so early what you're going to trade, when you're going to trade, what you're going to look for, etc., you've already cut yourself off from a number of options, which is why I asked my first two questions. Unless you have really good reasons for wanting to be a daytrader and trade the NQs, I suggest you rethink all of that. Trading futures intraday may seem like where all the action is, but it's also where a lot of people get chewed up.Db
I am totally open to any form of trading and would be very interested in hearing your suggestions on wich market would be the most appropriate for my objectives, which are:
1- To make a decent living out of this, and save money for future projects.
2- To be in control of my time and spent most of my day doing the things I enjoy, instead of working.
I have seen you mentioned you trade for 90 minutes a day, this is obviously very appealing but I imagine getting to the 90 min trading-day has been hard work.
Is this a reasonable aspiration? (the 90 minute trading day) or is the reality of succesful day-trading very different from my expectations?
Thanks once again for your interest.
-
I've read your trading journal a few times and would like to ask you if this is how an edge is developed.
1- I am a day trader that aspires to make a good living out of this.
2- I want to trade Nasdaq Futures for 4 hours from the opening, 5 days a week. I use a 60 minute chart to plot support and resistance using your "famous boxes" and I use a 1 minute chart to identify the setup for a trade.
3- I am focusing on 1 setup, the wyckoff Hinge. I will trade it only if it occurs at a predefined S/R level on the 60 min chart.
I will adress trade management, stop loss etc.. but at the moment I need a clearly defined entry that I can work on.
Am I on the right track here? Is this how I should start developing my edge?
My main concern is going through 2,3 or 4 days without finding a hinge, which would mean sitting down, in front of the screen 4 hours a day looking at price, but I guess this is normal for a beginner?
Thanks once again for the feedback.
-
Hello Db,
I am interested in learning to trade the original, unadulterated way. At the moment I am interested only in day trading futures so I am planning on thoroughly studying the following material:
- The original W course, except:
Part 11M, 12M, 13M since these deal with figure charting that is of no interest to me.
Part 18M and 19M since these deal with stocks specifically.
- The day traders bible.
-All threads in this forum.
Is therea anything I am missing that you consider important or should this material be enough for me to understand the principles and develop a trading plan?
Are there any other chapters from the original course that I can omit/ are not applicable to futures trading?
Is there a chat room/trading room were wyckoff traders share their thoughts?? I have seen this mentioned in the CSW thread but that was back in 2008/2009.
Cheers.
-
Hi GaryWhat exactly is the "hinge"? Could you post a chart depicting it please?
Thanks
slick60
http://img39.imageshack.us/img39/1752/dailysrlevelsnq2.jpg
You can find example of hinges in this thread and other posts in the wyckoff forum.
It is a setup that is a characterized by a compression in price (Lower highs and higher lows) giving it a triangular shape and a drie-up in volume.
-
Cheers db, I am well aware that developing an edge isnt easy and at the moment I am simply learning abou the nature of s/r as I intend to use these levels as the foundation of my edge.
In your trading journal u mention "finding a pattern that works, that Is yours and only you are expecting and focus on that specific setup" (this is not a direct quote)
Its funny that you should say this since I was under the complete oppisite impression. Wouldnt it be logical to trade patterns that most traders are aware of to increase the probabilies of success?
Thanks again for ur time.
-
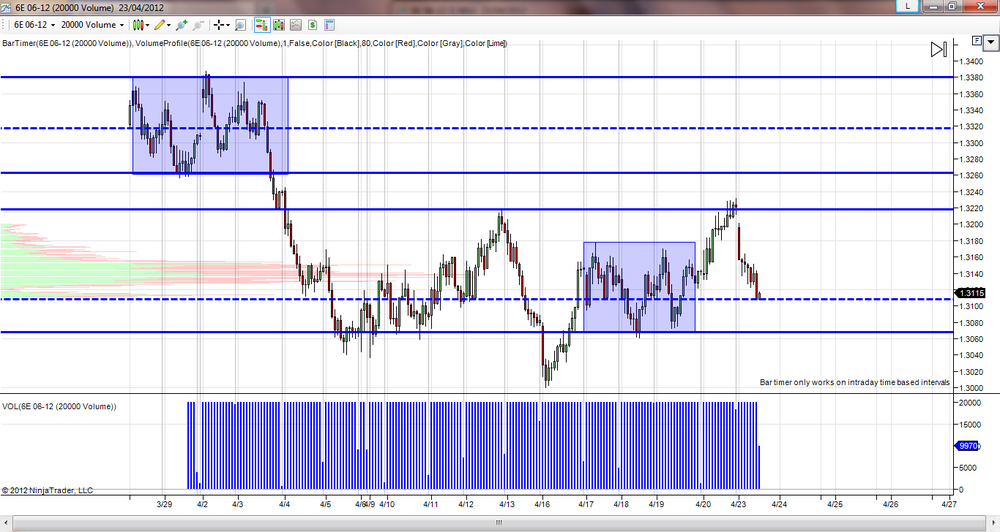
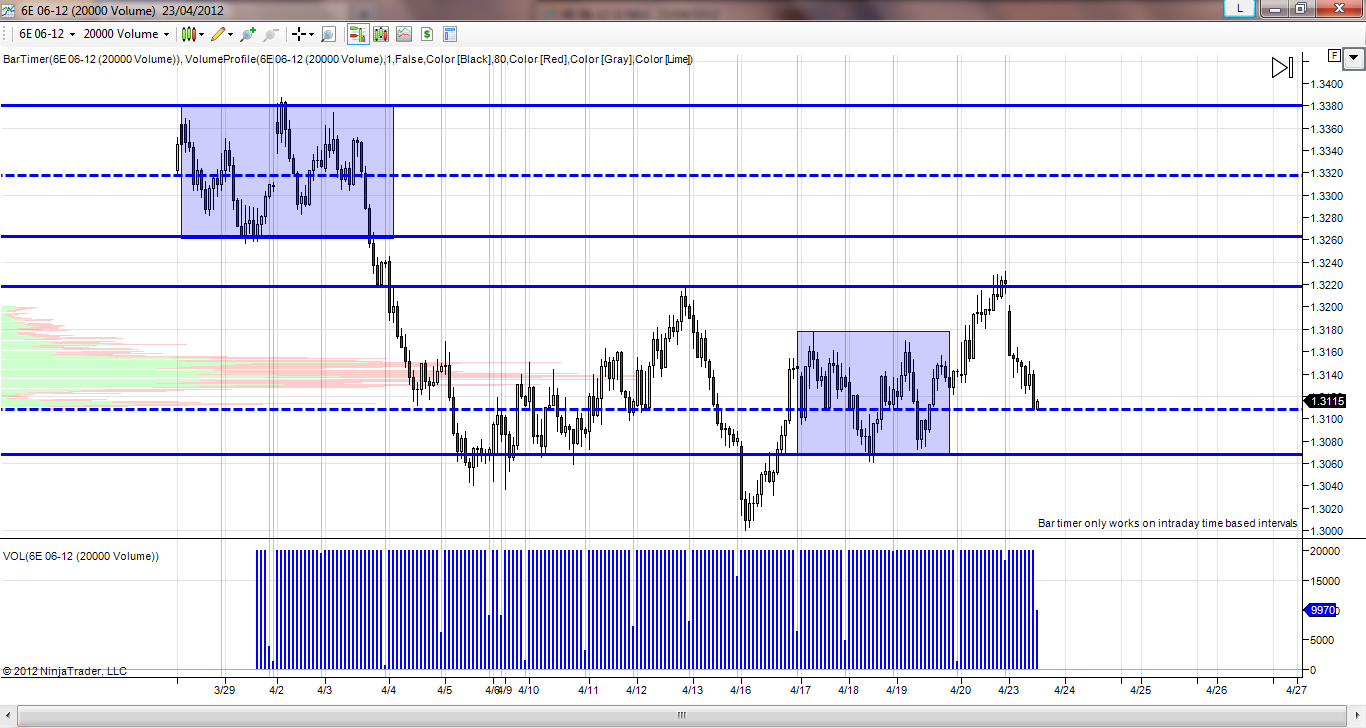
Thanks DB, I think it makes sense to me now but Id like to recapitulate to ensure I have understood this. I am posting this chart as an example of where one should plot S/R (following the method described in the Wyckoff Forum and why we can anticipate price might bounce at these levels)
So, Support and resistance can be found:
1- At a level that has been rejected more than once in the past. In the chart attached, buying pressure exceeded selling presure at aprox. 1.307 and the opposite happened at 1.3220.
2- At the midpoint of a trading range, more accurately, the price level where most trades took place which can be shown using market profile or VAP. When price reaches the midpoint of the trading range, we can expect a reaction from the buyers/sellers that entered a trade at that level, they are traped and will either push prices up or give up/close their possition. These midpoints are represented by a dotted line on the chart, at the present time, we are at a midpoint that may act as support.
When studying Support/TResistance Is this all there is? Swing High/Lows and midpoints (point of highest volume) of a trading range?
I would appreciate some reassurance as I inted to build a trading methodology based on trading of support/resistance.
-
What I've found from seraching "half" and "halfway" is that wyckoff considers a 50% reaction to be normal, if the market trends from support at 10 to 20, a normal correction would be a retracement to 15.
It seems to me that Wyckoff talks about "half way reactions" but not necessarily "reactions down/up to the midpoint of a previous trading range"
If a trading range represents value and a great number of trades, wouldnt it be sensible to assume that once price goes back to the range, it will stay there, rather than bounce?
This is what im talking about in case Im not making myself clear, from a chart you posted some time ago:
I am new to wyckoff so maybe I need to re-read the course and the day traders bible...
Thanks for your answer and Im glad to see you're still around
-
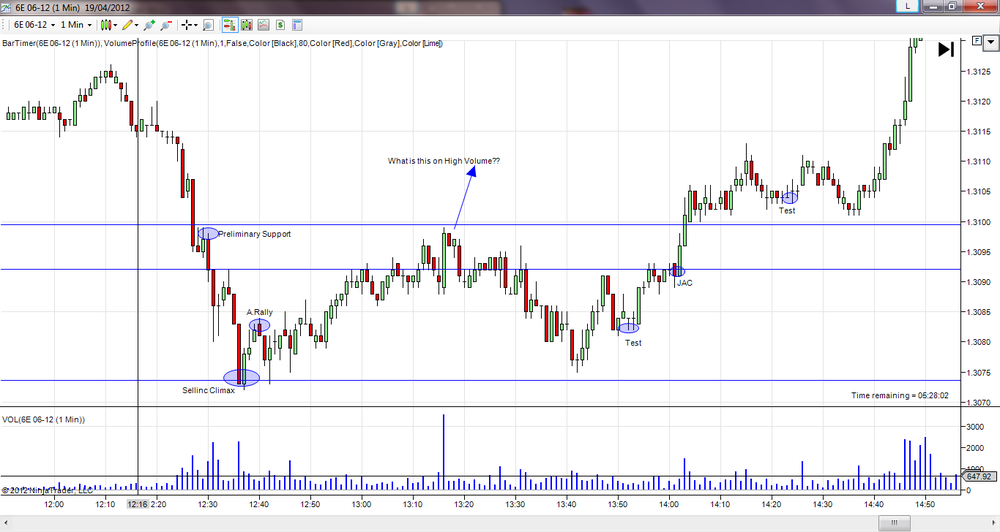
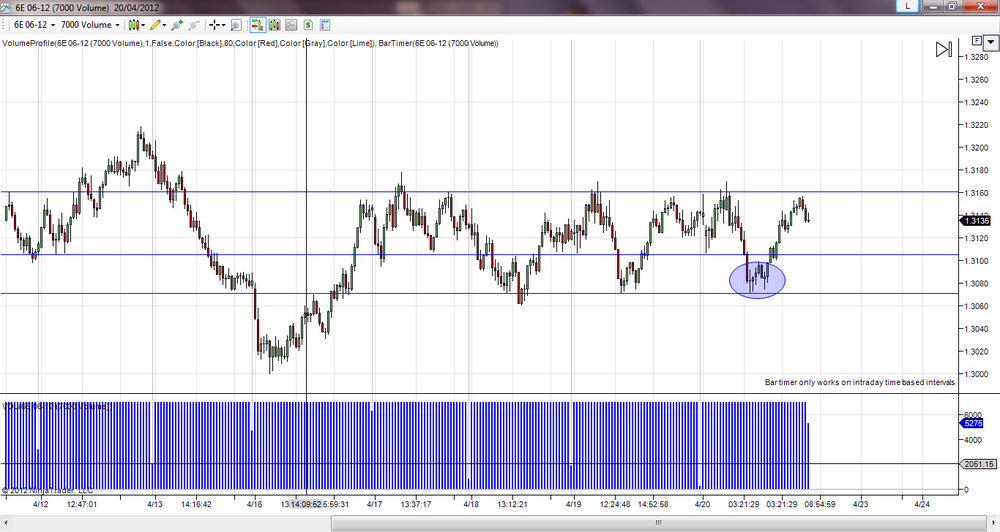
Ok so this if what I found yesterday on a 1 minute EUro/Dolar futures chart.
Price found support where anticipated on the 7000 Constant Volume chart and it went through an acummulation phase that lead to a move up to the top of the channel.
Attached are the charts as I have labeled them. My understanding of wyckoff is basic so I would very much appreciate it some feedback.
When waiting to enter a trading at support, should I expect the whole wyckoff phase as described in the 1 min chart??
What is the best point to enter the trade???
All the best.
-
This is a great thread but I have one question about the nature of support/resistance.
Support/R can be found in those points at which price has reversed in the pased such as a swing high/low that has been rejected more than once. In the past traders failed to find a trade above/below this price level, hence these price levels could potentially act as support/resistance in the future.
In this thread, traders consider the midpoint of a trading range as potential support/resistance but I fail to understand this. A trading range is non-directional and represents consensus between buyers and sellers, it represents value during a certain period so here comes my question:
Why do we anticipate the midpoint of a trading range to act as support/resistance?
I hope someone can answer this as it has been bugging me for a few days now.
-
I cant reply long now but in nutshell wyckoffMEthod is not easy to get used too.... U need hours of study and chart reading to master it
If u r looking for shortcut this is not for u
But i guarentee u once u become good at it u can almost trade in any market and in any timeframe. U wont need any indicator to take trade. U will be using most fundamental thing in the market, price and. VOlume to trade
Thanks for your answer my friend, would you feel comfortable posting some of your trades on this forum? It would be very usefull for us, non experienced traders to learn from how a wyckoff trader currently operates.
I am currently reading all the 4-star threads on this forum, which I am finding very useful and I am also going to read, several times, the original wyckoff course and the day traders bible.
Thanks again.


Trading The Wyckoff Way
in The Wyckoff Forum
Posted
This is my reading of the behaviour of price around the 2516 R area, I am simply trying to put into practice the little kwnoledge I have aquired from this message board and Wyckoffs word. Hopefully one of those things I will look back in the future and think: Shit, what the F**k was I thinking...
At point 0 the market is in an uptrend and retraces on descending volume, a bullish sign.
At point 1 there is another retracement, also on descending volume. At this point there is nothing in the chart that makes me expect a reversal.
Between points 1 and 2,on the wave chart, we can notice the upward waves are becoming shorter, showing a clear increase in selling pressure, but still no climatic action.
At point 2 there is another retracement, this time lasting longer in time and of greater magnitude, however, there are still no clues from volume.
At point 3, buyers step in again (or sellers give up) and price starts ascending. As prices moves higher, volume decreases for the first time, showing less efort from the part of the buyers and a bearish sign.
At point 4, buyers are exhausted and price makes a Lower High and reverses on realtively low volume, however, price finds support again at around 2510.
Is it worth going short on that lower High? I don't care as it depends entirely on the individual traders strategy, I am interested in the analysis of the relationship between price and volume at this potential resistance level, as it is independent of strategy.
After this, price drifts for a while and eventually breakouts but It would be good to read other traders views on this.