
Welcome to the new Traders Laboratory! Please bear with us as we finish the migration over the next few days. If you find any issues, want to leave feedback, get in touch with us, or offer suggestions please post to the Support forum here.

Gary Fullett
-
Content Count
37 -
Joined
-
Last visited
Posts posted by Gary Fullett
-
-
There is a substantial risk of loss in trading commodity futures, options and off exchange foreign currency products. Past performance is not indicative of future results.
-
There is a substantial risk of loss in trading commodity futures, options and off exchange foreign currency products. Past performance is not indicative of future results.
-
Hi GaryWhat exactly is the "hinge"? Could you post a chart depicting it please?
Thanks
slick60
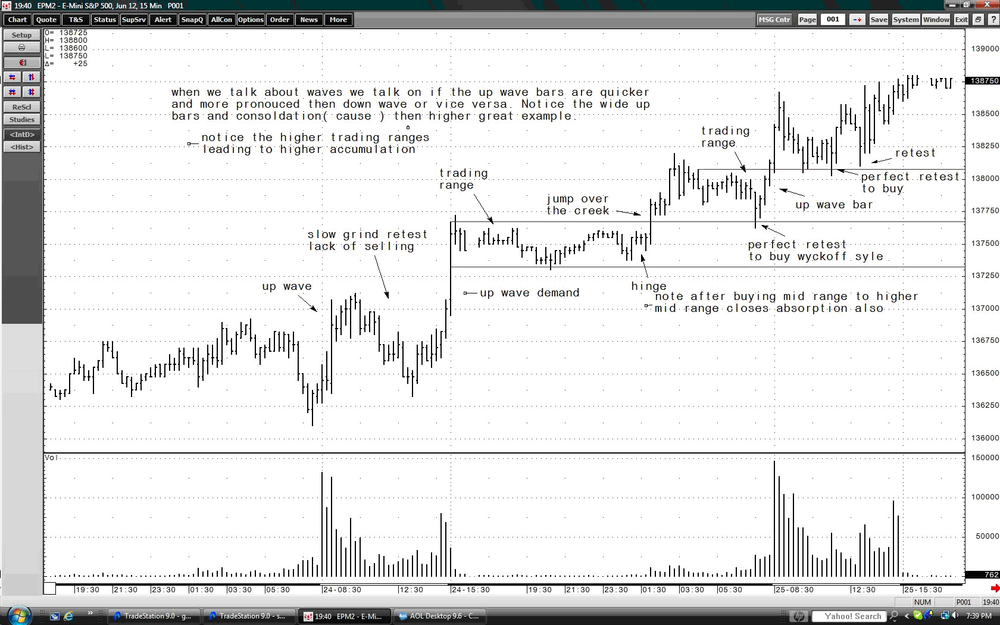
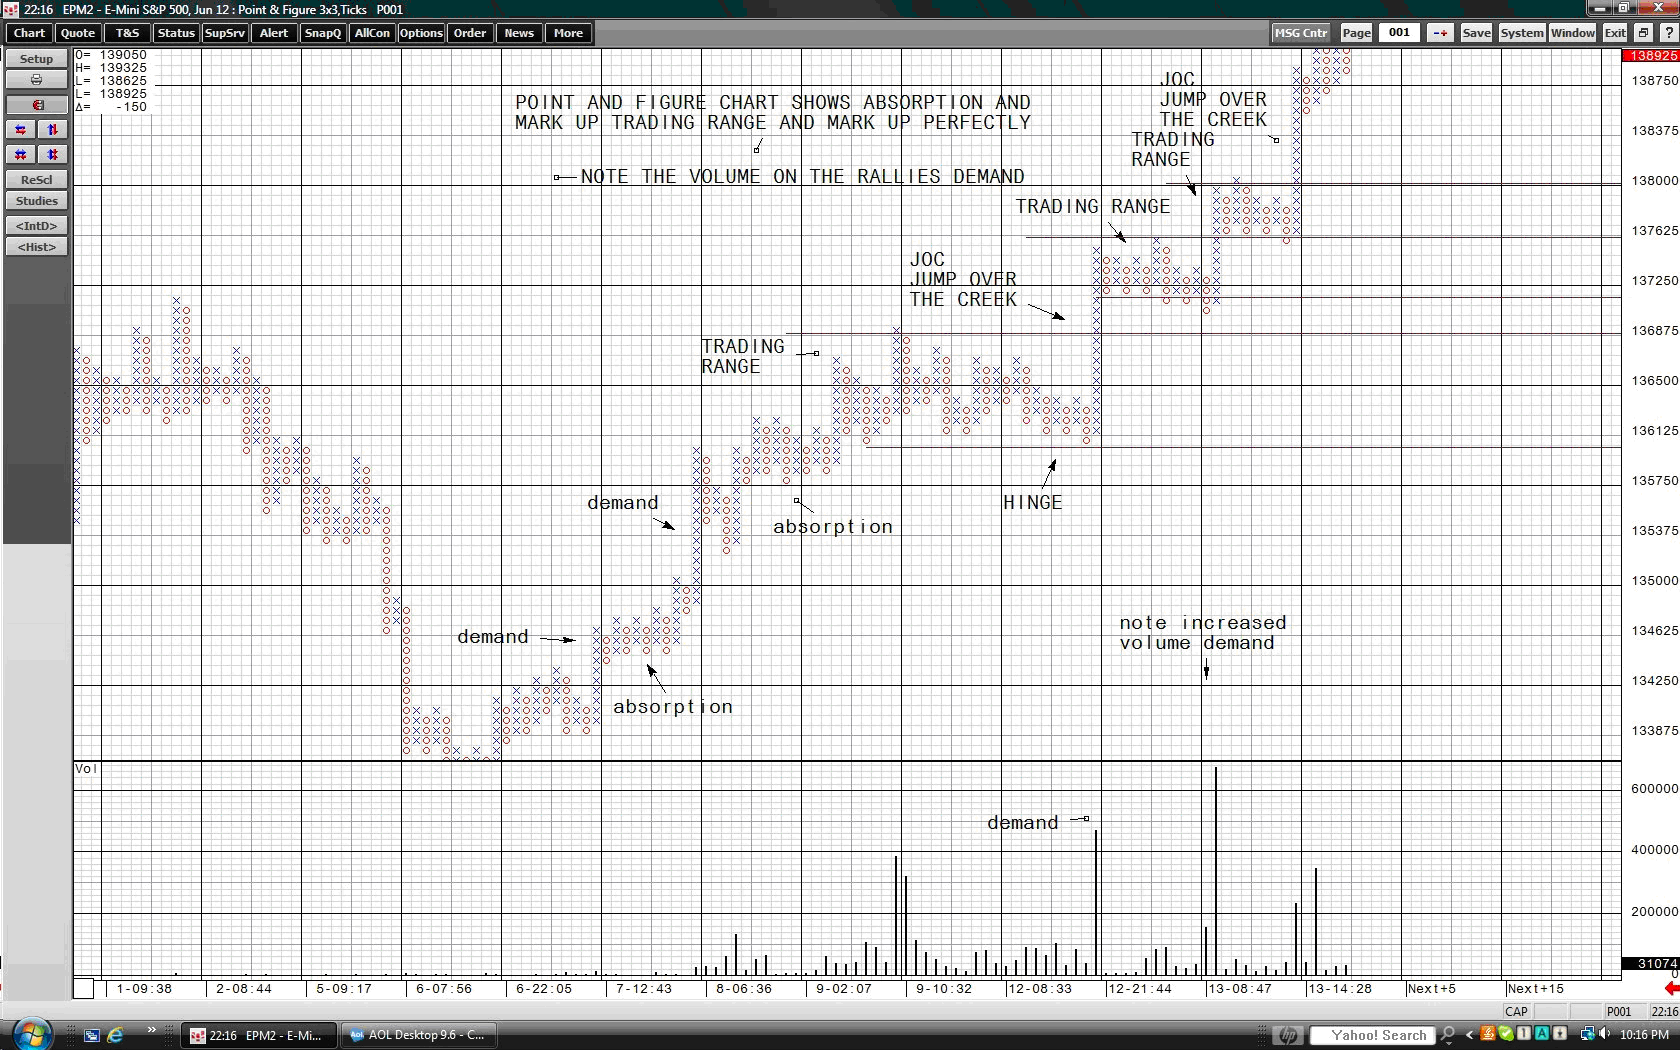
Here's the chart I promised.
Gary
There is a substantial risk of loss in trading commodity futures, options and off exchange foreign currency products. Past performance is not indicative of future results.
-
Hi GaryWhat exactly is the "hinge"? Could you post a chart depicting it please?
Thanks
slick60
I'll be happy to post a chart with a hinge later on today. Hinges can occur for the upside and the downside as well.
Gary
There is a substantial risk of loss in trading commodity futures, options and off exchange foreign currency products. Past performance is not indicative of future results.
-
Yes. I know about them. A number of Wyckoff discussions omit the use of PnF charts and I'm interested in why that is so. I've talked with Gary Fullett and Gary Dayton and they don't use PnF either.I thought that PnF charts help to predict where, when and how much the market will move. I don't understand why Wyckoff traders don't use them.
Also, some Wyckoff traders speak of the SMI training as the Wyckoff Bible, but there is so much of the method taught by SMI is left out of forum discussions. For example, the 5 steps and the 9 buying and the 9 selling tests. Do you have any idea why these things are not discussed by professional Wyckoff traders in forum discussions?
As part of our daily newsletter, we include P&F charts. As far as the other things that are omitted from forums, I think it's mainly because traders are looking for buy and sell setups versus the text of the Wyckoff course. Certainly if there are any questions about the 5 steps and the 9 buying and selling tests, I would be more than happy to discuss them.
Gary
There is a substantial risk of loss in trading commodity futures, options and off exchange foreign currency products. Past performance is not indicative of future results.
-
This is a great thread but I have one question about the nature of support/resistance.Support/R can be found in those points at which price has reversed in the pased such as a swing high/low that has been rejected more than once. In the past traders failed to find a trade above/below this price level, hence these price levels could potentially act as support/resistance in the future.
In this thread, traders consider the midpoint of a trading range as potential support/resistance but I fail to understand this. A trading range is non-directional and represents consensus between buyers and sellers, it represents value during a certain period so here comes my question:
Why do we anticipate the midpoint of a trading range to act as support/resistance?
I hope someone can answer this as it has been bugging me for a few days now.
The midway retracement of a market is something that Wyckoff observed in his work. It is not an edge of a market, that should generally allow for a trade. If a market is trending, there is greater probability that the trading range will make a move in the direction of the trend, unless there is action that negates it. For example, if you have a sequence where you can identify the selling climax, the subsequent trading range is more likely accumulation for higher prices versus distribution for lower prices.
Gary
There is a substantial risk of loss in trading commodity futures, options and off exchange foreign currency products. Past performance is not indicative of future results.
-
Ok so this if what I found yesterday on a 1 minute EUro/Dolar futures chart.Price found support where anticipated on the 7000 Constant Volume chart and it went through an acummulation phase that lead to a move up to the top of the channel.
Attached are the charts as I have labeled them. My understanding of wyckoff is basic so I would very much appreciate it some feedback.
When waiting to enter a trading at support, should I expect the whole wyckoff phase as described in the 1 min chart??
What is the best point to enter the trade???
All the best.
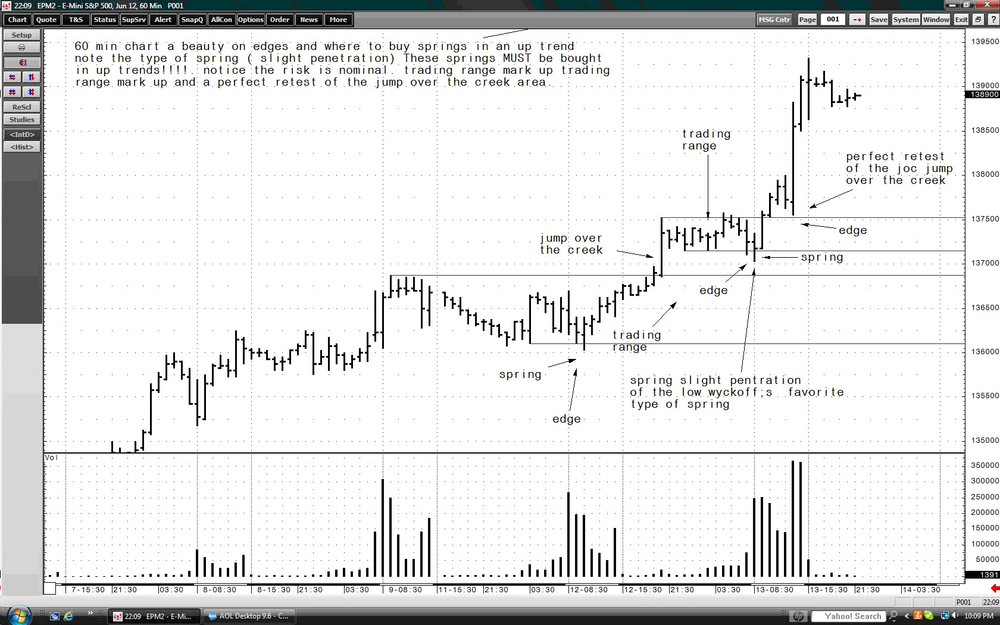
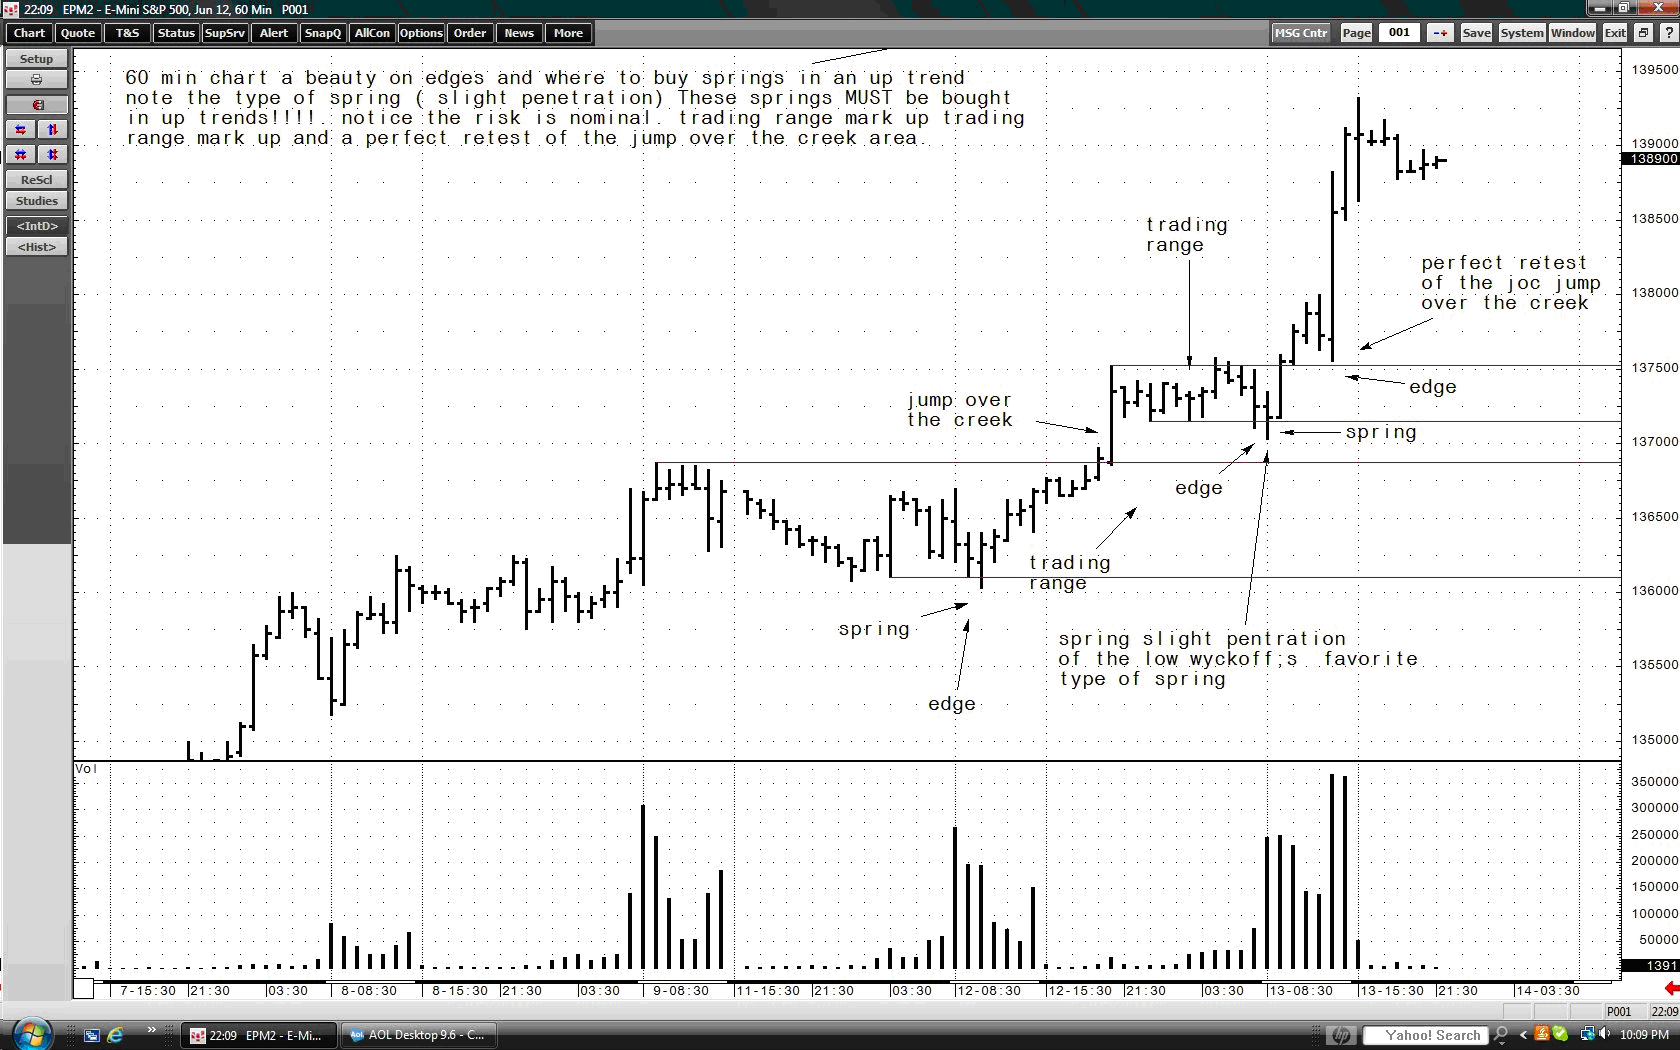
What you labeled as preliminary support is not preliminary support. There are two areas to enter the trade. One, which is more aggressive, would be to identify the absorption or hinge before the jump over the creek, and the best way to buy the market would be the area you labeled as a retest of the jump over the creek.
Gary
There is a substantial risk of loss in trading commodity futures, options and off exchange foreign currency products. Past performance is not indicative of future results.
-
First of all, let me say there really are NO silly questions. I appreciate you having the courage to ask.
I have not been able to accurately predict price movements from the P&F, I always overshoot. Is there any standard for defining the base of the formation, I think I am using a way to wide base.P&F charting is only used for count, which indicated the potential for how far a move can go. It is not used like a bar chart vehicle. Also, keep in mind that it's only a guesstimate, which Wyckoff used.
In intraday trading, the volumes depend of the hour of the day you are trading, how do you manage the volume comparison, in an absolute base or in a relative base.Volume is relative to the area that it's trading. So the volume today wouldn't be comparable to the volume 6 months ago, for example. Keep time frames separate from one another. A 5 minute chart may show excessive volume due to a report or news event, but it may not be comparable to a 60 minute chart.
In range formations, I have not been able to confidently predict the exit direction; I check intrarange volumes, in order to determine if the strength is with the buyers or with the sellers, but when prices are in the springboard, I usually miss when choosing the direction.The key to understanding that is to understand the trend and the background of the market. In uptrends, we want to by springs and the springboard.
Have you found a way to determine how to differentiate a climax from a shootout.A buying climax, unfortunately, is really only seen in hindsight. So it's difficult to determine when it's actually occurring.
Gary
There is a substantial risk of loss in trading commodity futures, options and off exchange foreign currency products. Past performance is not indicative of future results.
-
I have a confuse with this candleis this a stopping volume and as you see next bar is up ( confirmation for stopping volume)
if i have stopping volume and also i have confirmation ( next bar is up ) ,but the trend continue down as in chart
can i take this candle ( stopping volume ) as sign of strength or forget it because the trend continue down?
That bar that you see is a supply bar and is bearish. The subsequent behavior after that bar is also weak demand. If the trend is up, this could be a shakeout bar. If the trend is down, this indicates the likelihood of lower prices.
Gary
There is a substantial risk of loss in trading commodity futures, options and off exchange foreign currency products. Past performance is not indicative of future results.
-
Hi Gary,May I ask what charting software are you using?
Sure. I use CQG.
There is a substantial risk of loss in trading commodity futures, options and off exchange foreign currency products. Past performance is not indicative of future results.
-
Cheers Gary really appreciate the feedback!Do you agree with the support and resistance that I ploted on the 60 min chart?
Yes! Great job!!
Gary
There is a substantial risk of loss in trading commodity futures, options and off exchange foreign currency products. Past performance is not indicative of future results.
-
Attached are two charts for a wyckoff oportunity I identified last tuesday.Firstly I plottes support and Resistance on the 60 min chart and price found support at the midpoint of a previous range at around 12:30 UK time.
I would greatly appreciate it some feedback on my interpretation of the charts. This is my first analysis so please forgive my ignorance

cheers
You obviously identified a market that was going through some bottoming action. Though I would label things a tad differently, the main part of what you did was excellent work because you identified the proper Wyckoff sequence.
Gary
There is a substantial risk of loss in trading commodity futures, options and off exchange foreign currency products. Past performance is not indicative of future results.
-
Hello everyone,I have noticed that most of the work published in this blog (by DB et al) on wyckoff trading was published back in 2008-2009 and there has not been much activity over the last 2 years.
I am interested in the method but have a basic question; Is this methodlogy aplicable today, in 2012 and if so in which markets?
I have often read that the principles of supply/demand will always prevail but is this true, with all the automatic and algorythmic trading out there?
I am very interested in hearing from those of you who are currently trading using wyckoff methods.
I've been trading using Wyckoff methods since 1982. If Wyckoff trading is what you prefer your method to be, I would seek out the PURE Wyckoff course and teachings, versus any derivative of Wyckoff. Wyckoff is the "bible" for price, action and volume, so I would refer to that directly.
It is true that Wyckoff works in all time frames, and with all markets. Of course, I would stay away from very low priced stocks. With forex, from what I understand, it is somewhat difficult to get accurate volume.
Gary
-
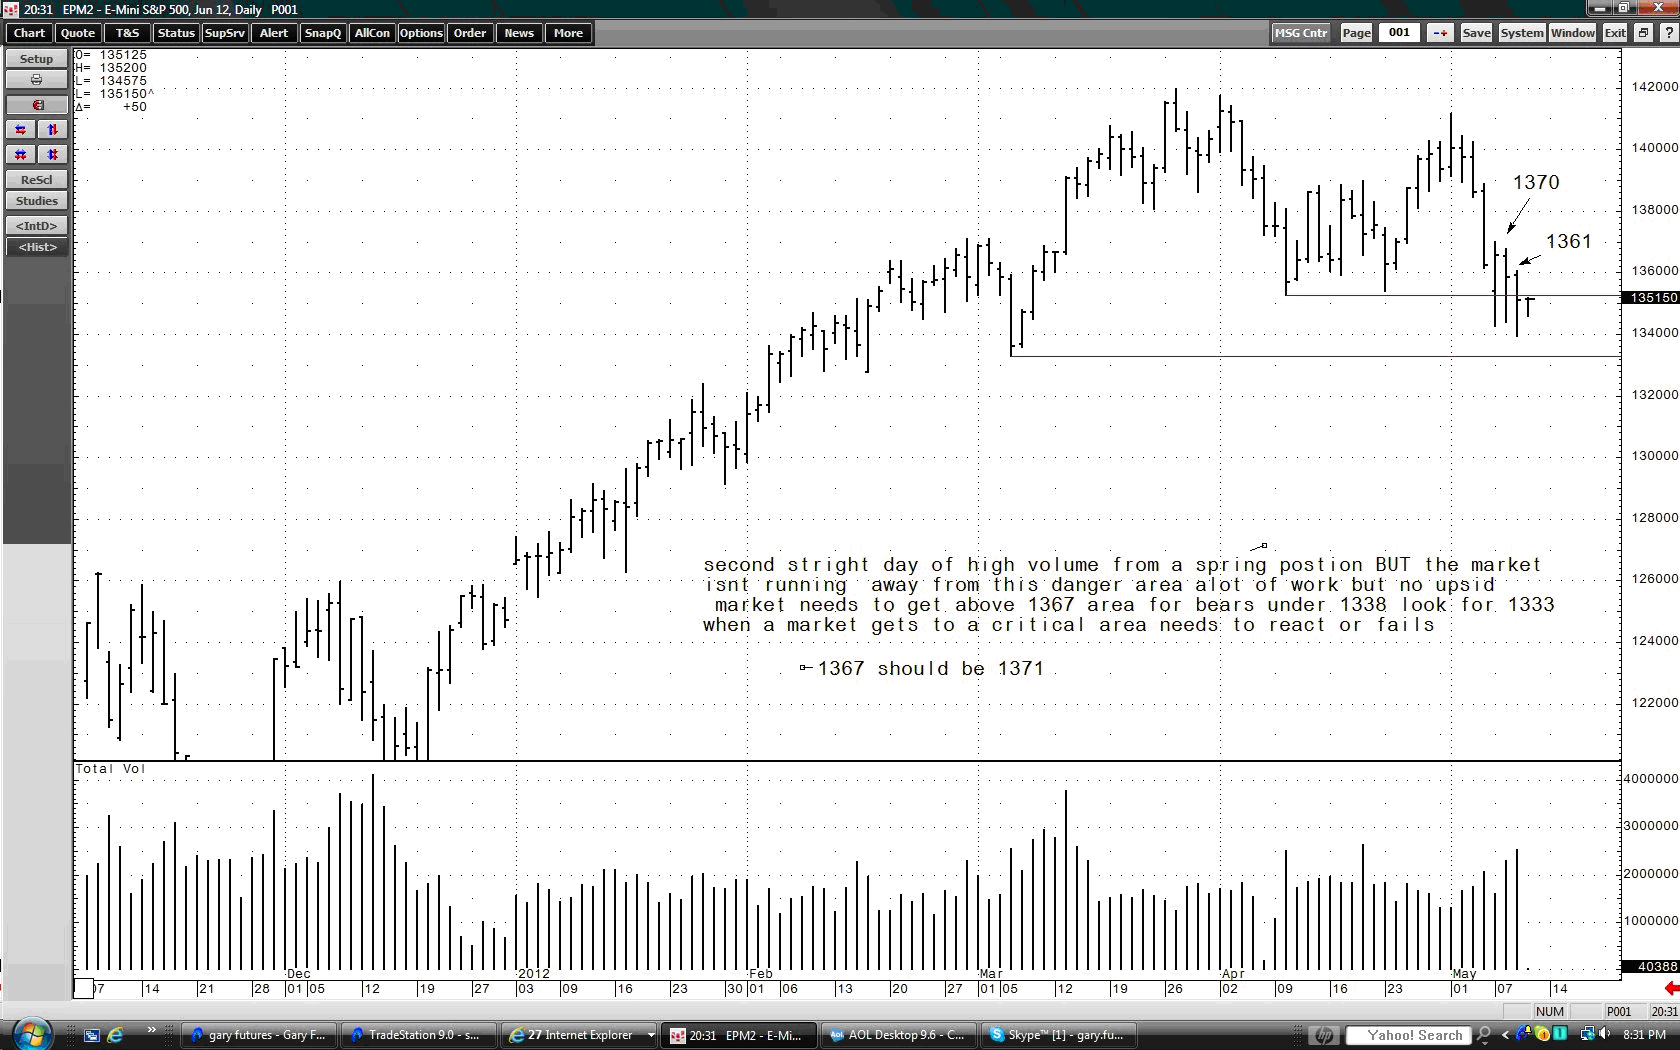
No one, not even the ghost of Wyckoff, can look at an area and say that it is accumulation of distribution before the fact.Wyckoff never used the terms accumulation and distribution in his work [This is incorrect. Simply open up the original course -- http://www.traderslaboratory.com/forums/wyckoff-forum/6192-wyckoff-original-course.html -- and use Ctrl+F to find dozens of references to Accumulation and Distribution, the concepts of which are fundamental to Wyckoff's approach]. When a market goes through a sequence of a buying climax, it is quite true that it is seen in hindsight. However, if supply is present and forms a lower trading range, we can deduce that this lower trading range is more likely preparing itself for the markdown phase. Wyckoff looked at markets in a wave structure. When there are stronger waves to the downside than to the upside, we can get an idea that the market is weak.
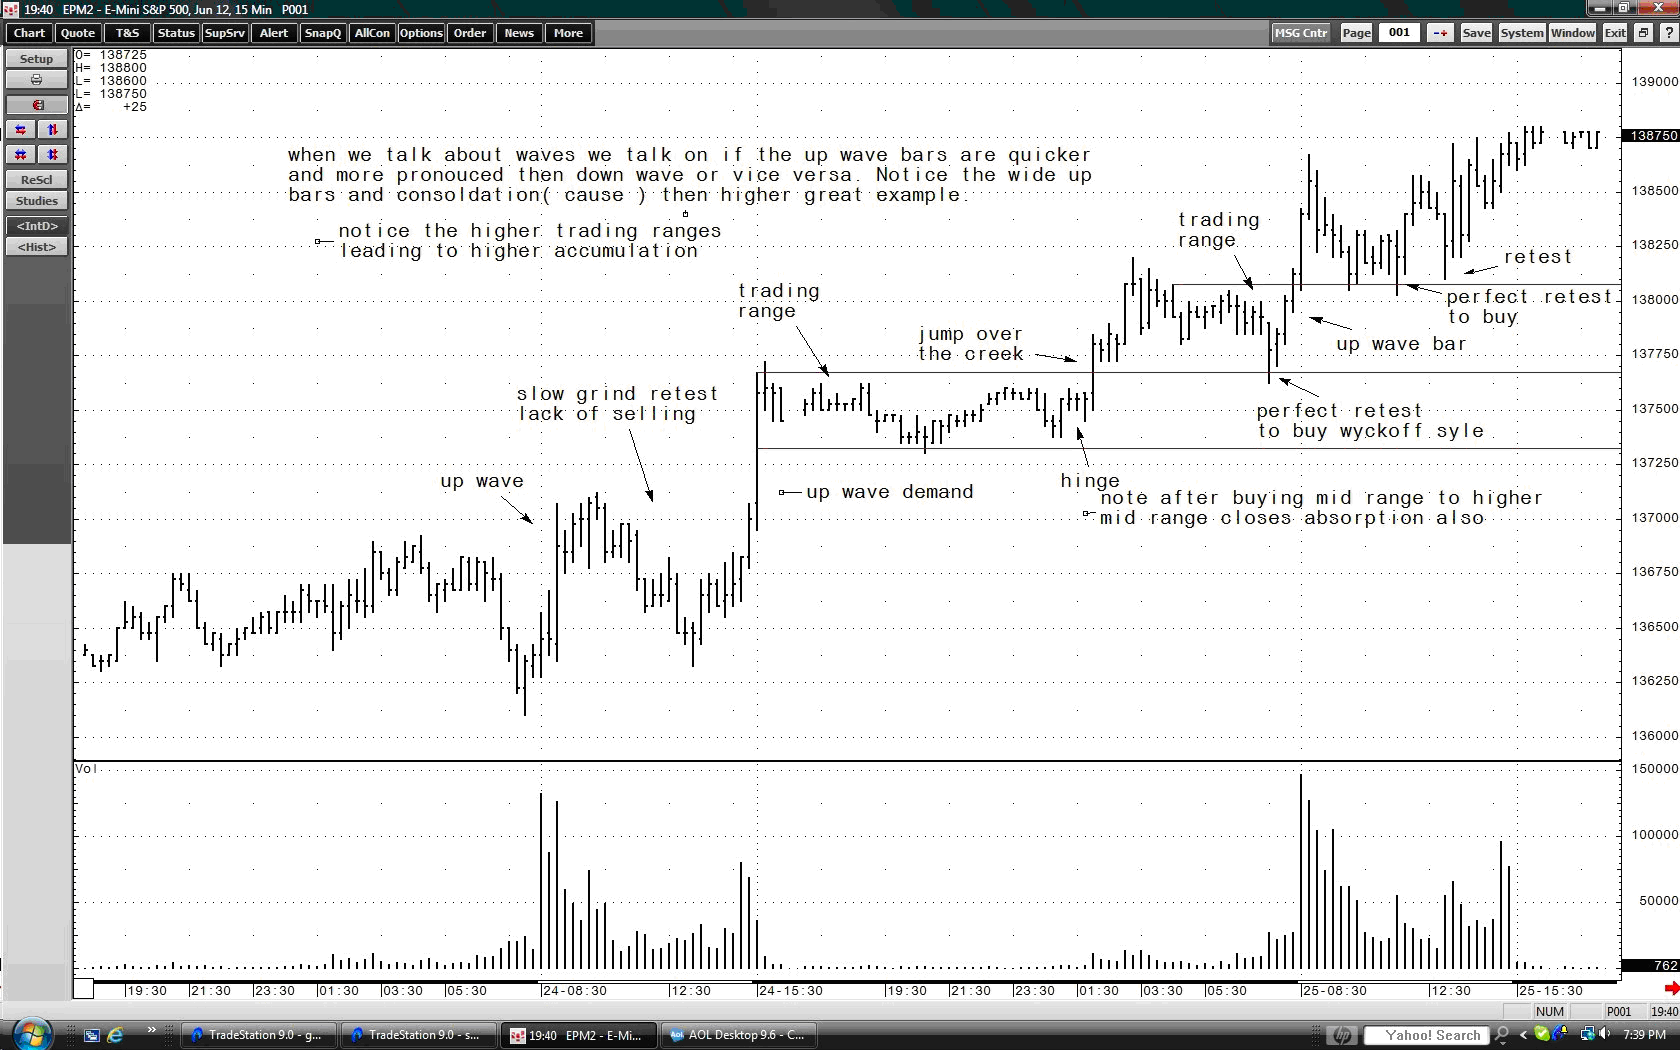
The most important piece of information that one can have in trading is knowing the trend for the time frame they are trading. When we have a series of higher highs and higher lows, the higher trading ranges that form are more likely to lead to markup versus markdown. All we can do is read the price, action, and volume to determine strengths and weaknesses and go with the reading of the tape. In the chart presented, it appeared to me that there were supply bars evident, which lead me to deduce that the market may go lower.
Gary
There is a substantial risk of loss in trading commodity futures, options and off exchange foreign currency products. Past performance is not indicative of future results.
-
Gary,I wonder if you could comment on my chart of the EUR/USD daily. Its similar to yours but I drew the bottom of my trading range across the double-bottoms. This would have allowed us to trade the spring on 2/16 and perhaps 3/15. Do you not consider this line as the actual bottom of trading range as the reaction to the high on 1/30 wasn't significant enough?
Thanks in advance.
I drew my horizontal support line from two important areas. One, it was the reaction high before we moved lower in early 2012. Also, in mid January, it corresponds to a markup bar and then the low in mid February made a reaction high in late February so that's why I drew the line where I did. Those two areas show me greater reactions to where you drew it. Your lines aren't bad, but I think mine tell a better story.
Gary
-
ES daily, 60 minute, and P&F. I'd love to hear any thoughts or comments.

There is a substantial risk of loss in trading commodity futures, options and off exchange foreign currency products. Past performance is not indicative of future results.
-
Gary,A little off topic but what application do you use for your PnF charting?
I use CQG for my charts.
Gary
There is a substantial risk of loss in trading commodity futures, options and off exchange foreign currency products. Past performance is not indicative of future results.
-
Gary I knew it was a Typo. You have great knowledge and experience !Often look in at the LTG Wyckoff Archives .
Always worthwhile.
Great Free Resource for anybody !
Motorway
Thank you so much for the compliments. I have read the material for years on your Aussie website, and personally gleaned much knowledge from your postings.
Cheers!
Gary
-
Motorway,
Very well said. I apologize for mis-typing in my earlier post. Price movement is the result, not the effect. You are correct.
Thanks for pointing out my error.
Gary
-
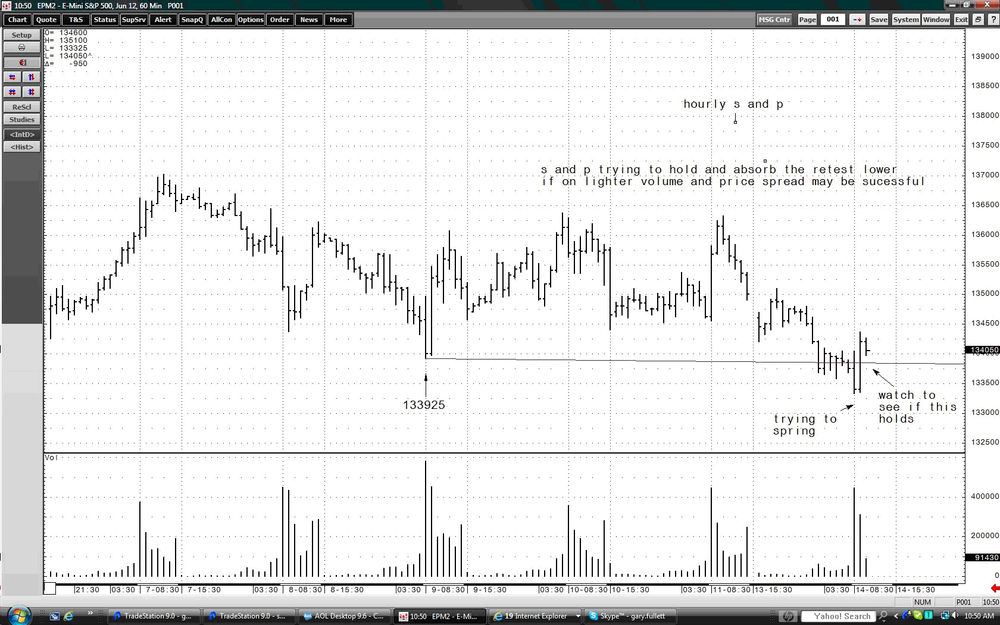
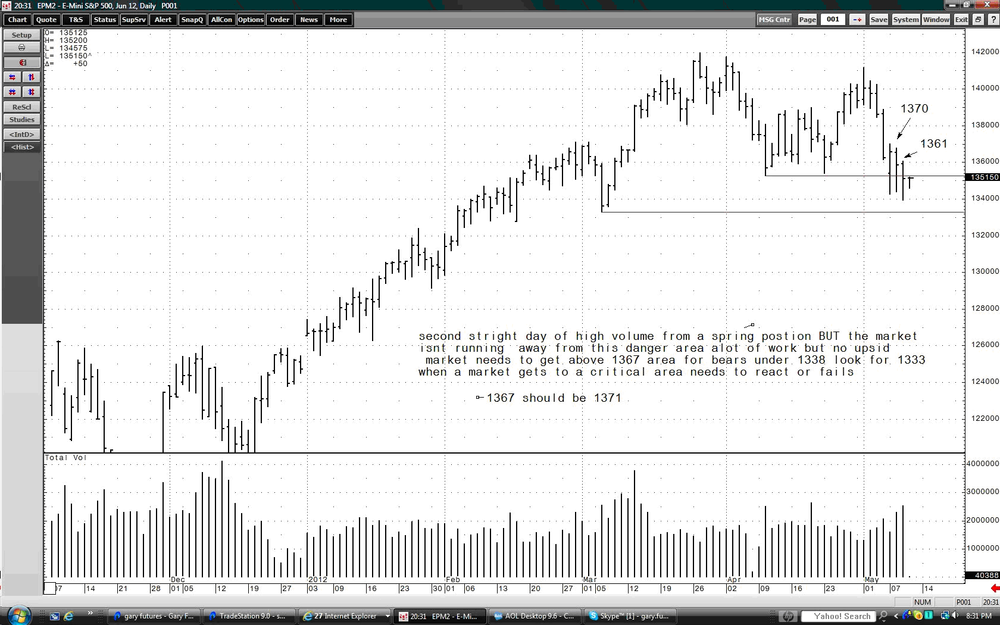
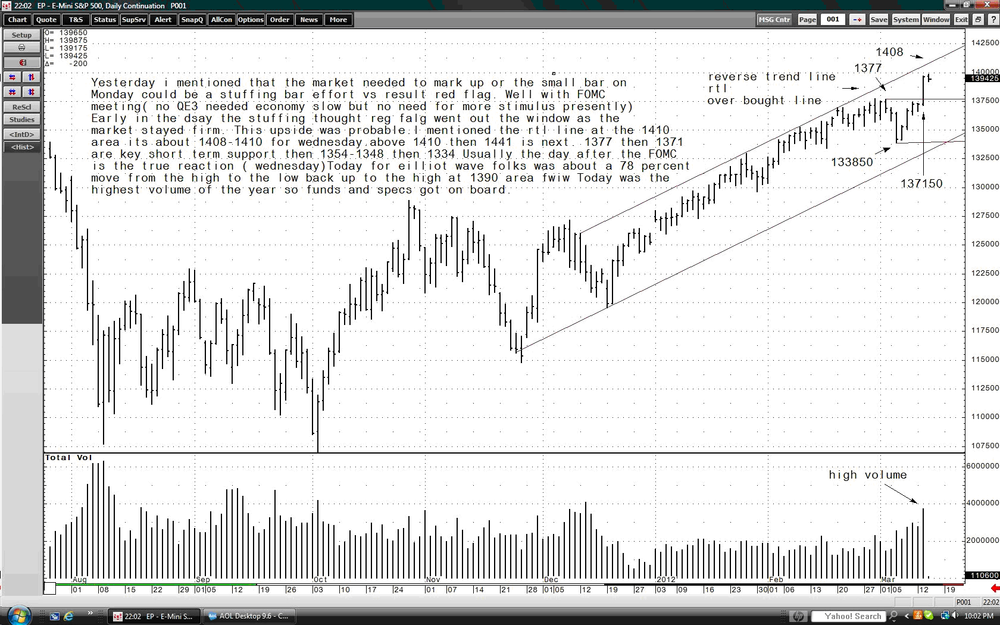
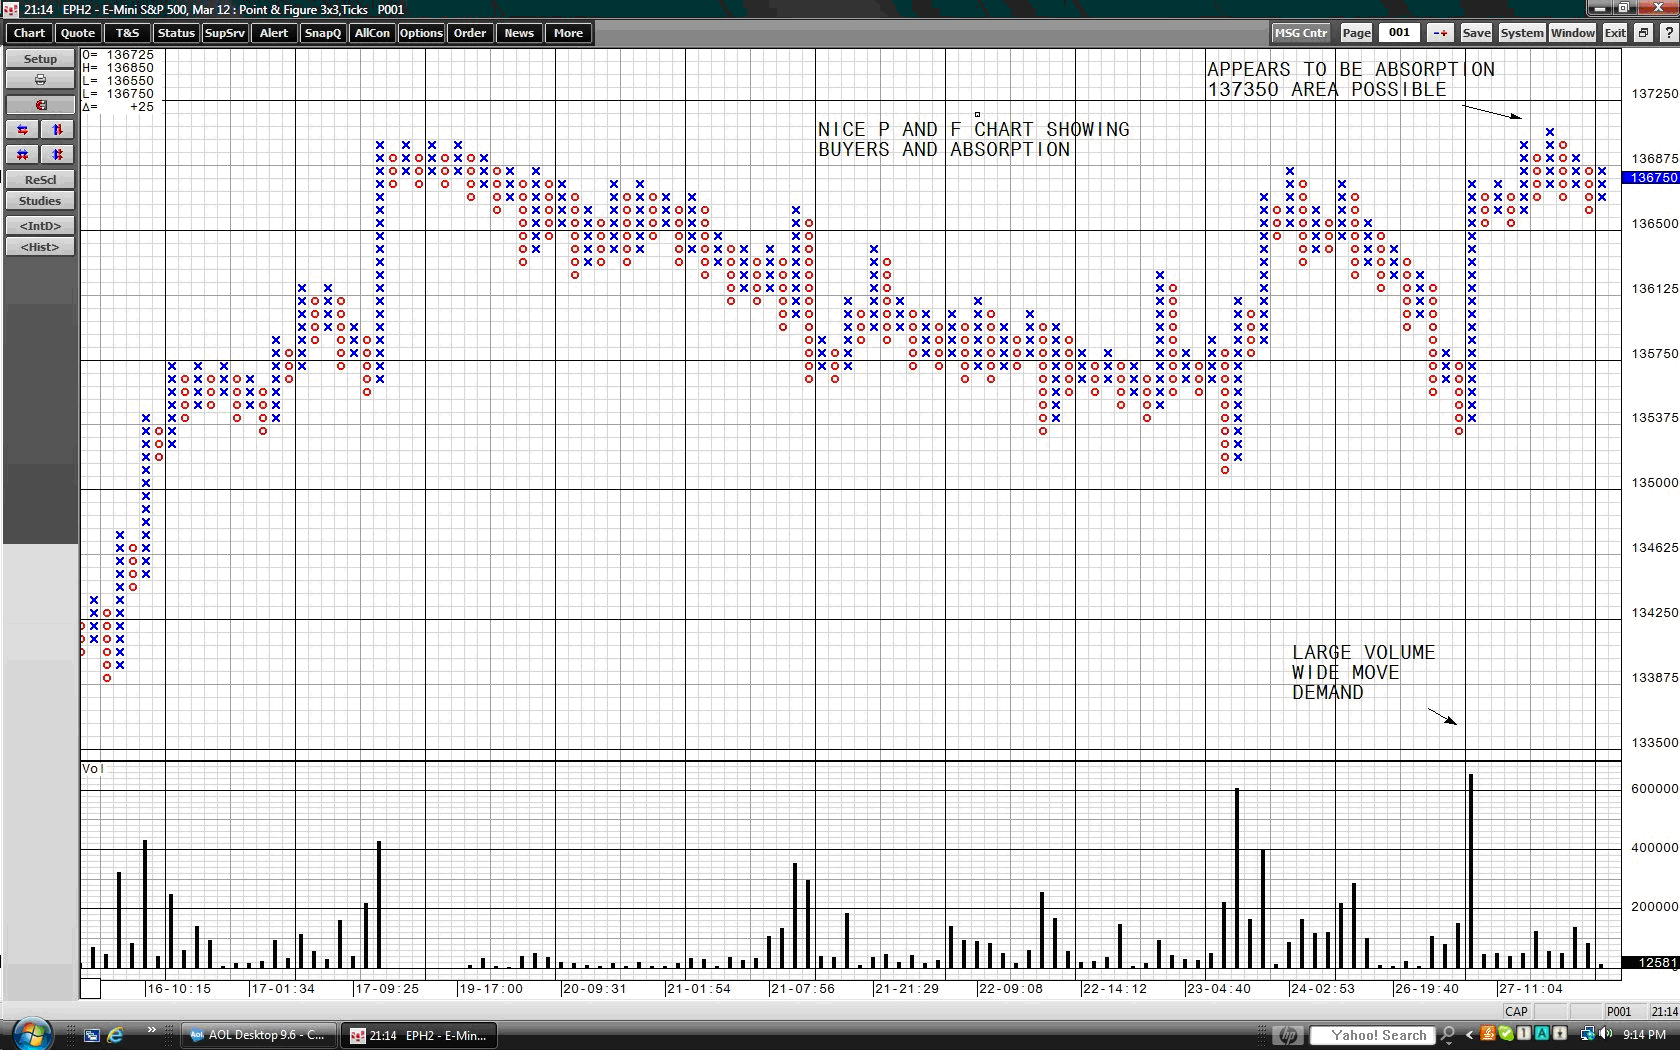
Emini S&P chart

-
Yes. I do see some similarities for volume for both charts. Isn't volume the "cause" and the price movement the "effect"? This seems to like it would be the same for a column of "X's" or "O's" in a PnF chart too.Volume is the effort, price movement is the effect.
Gary
-
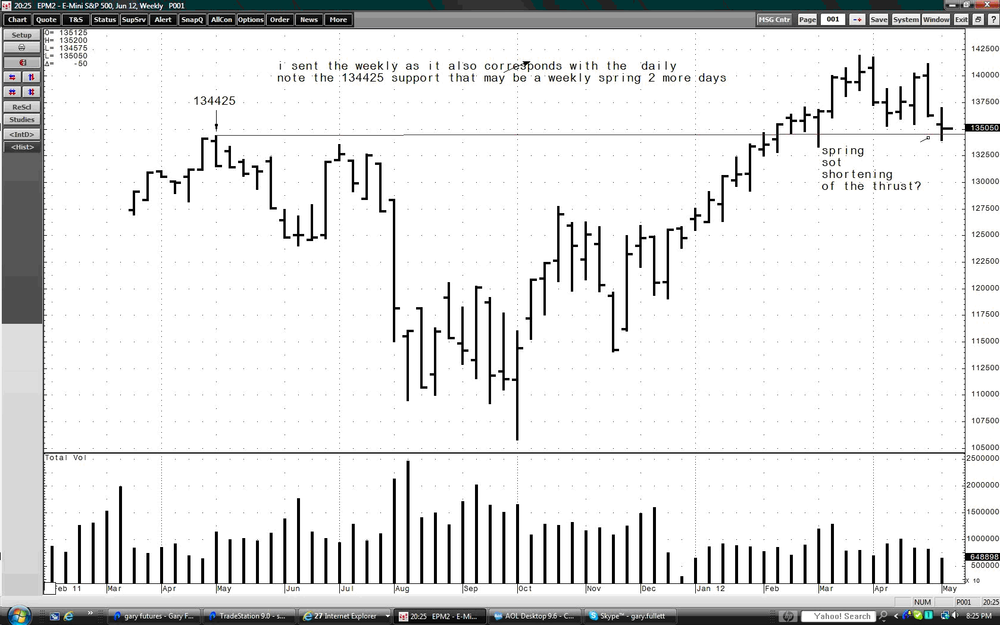
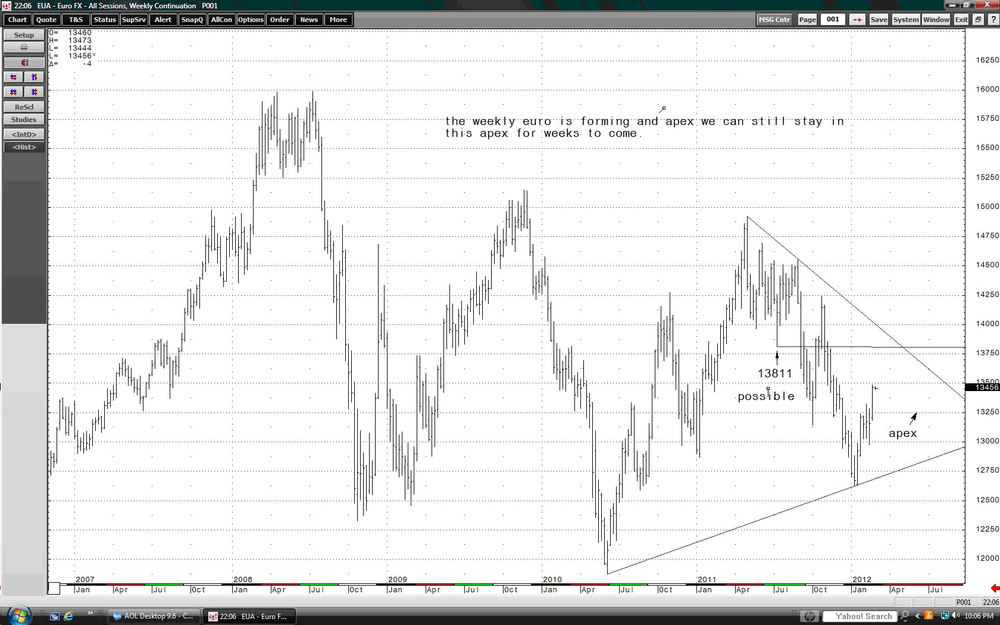
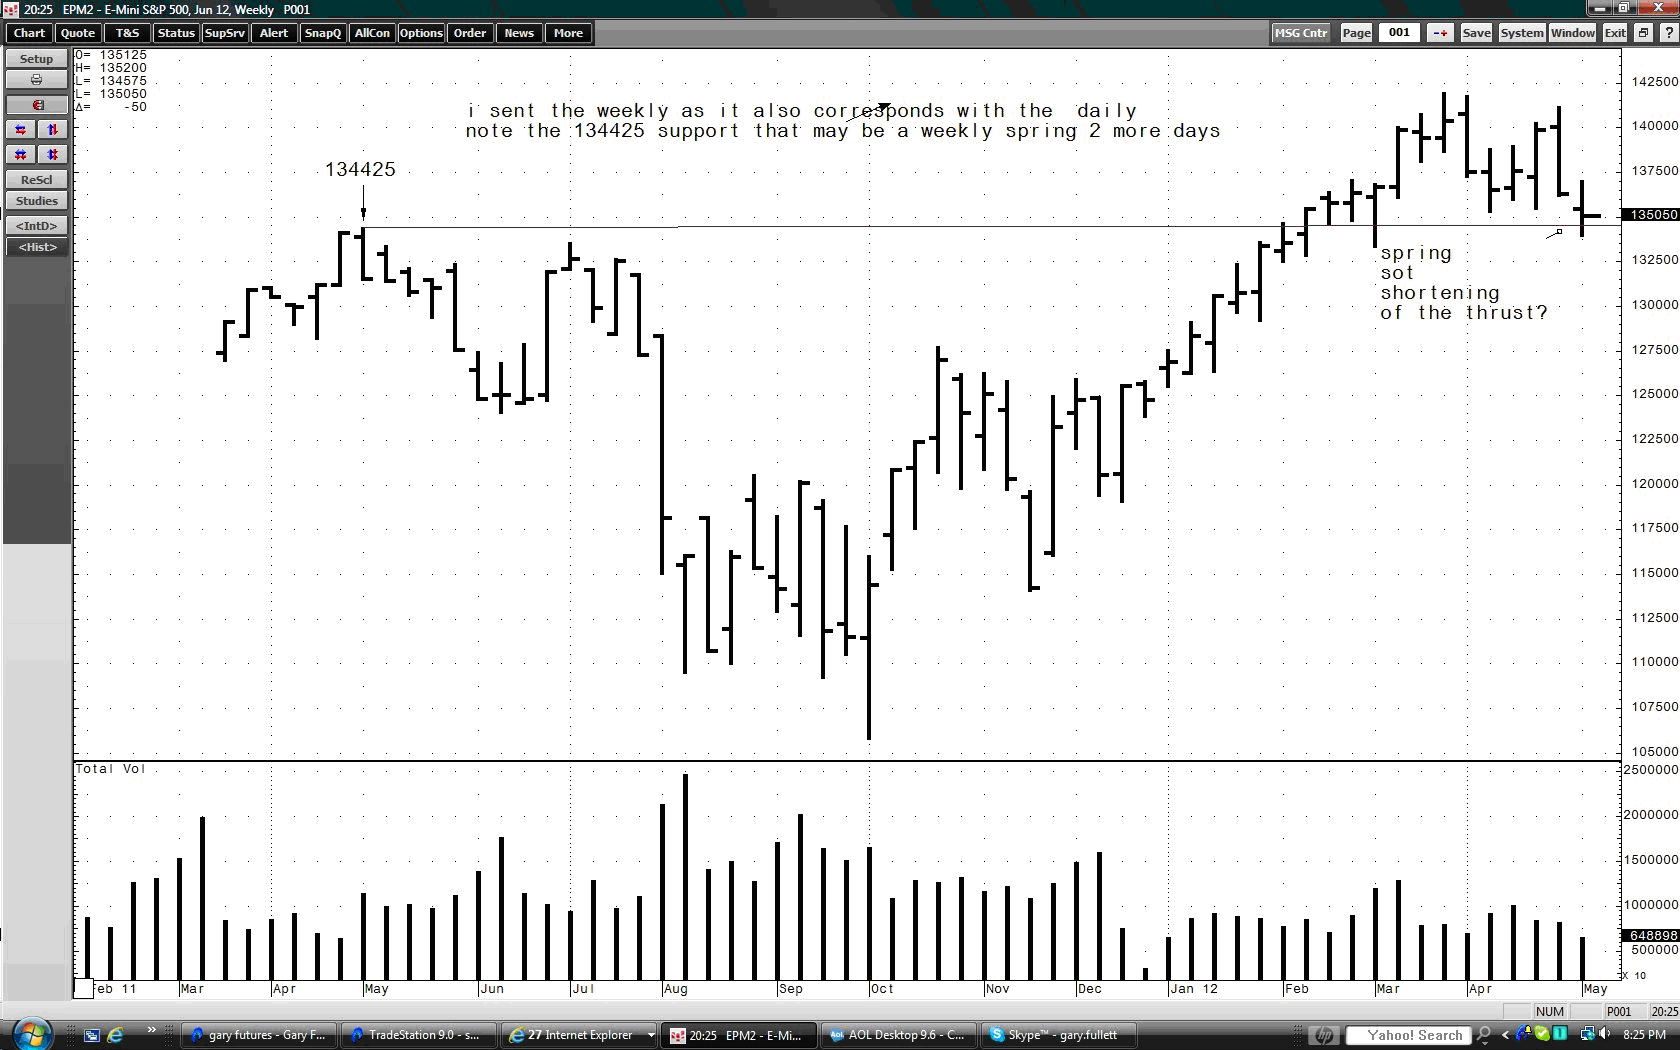
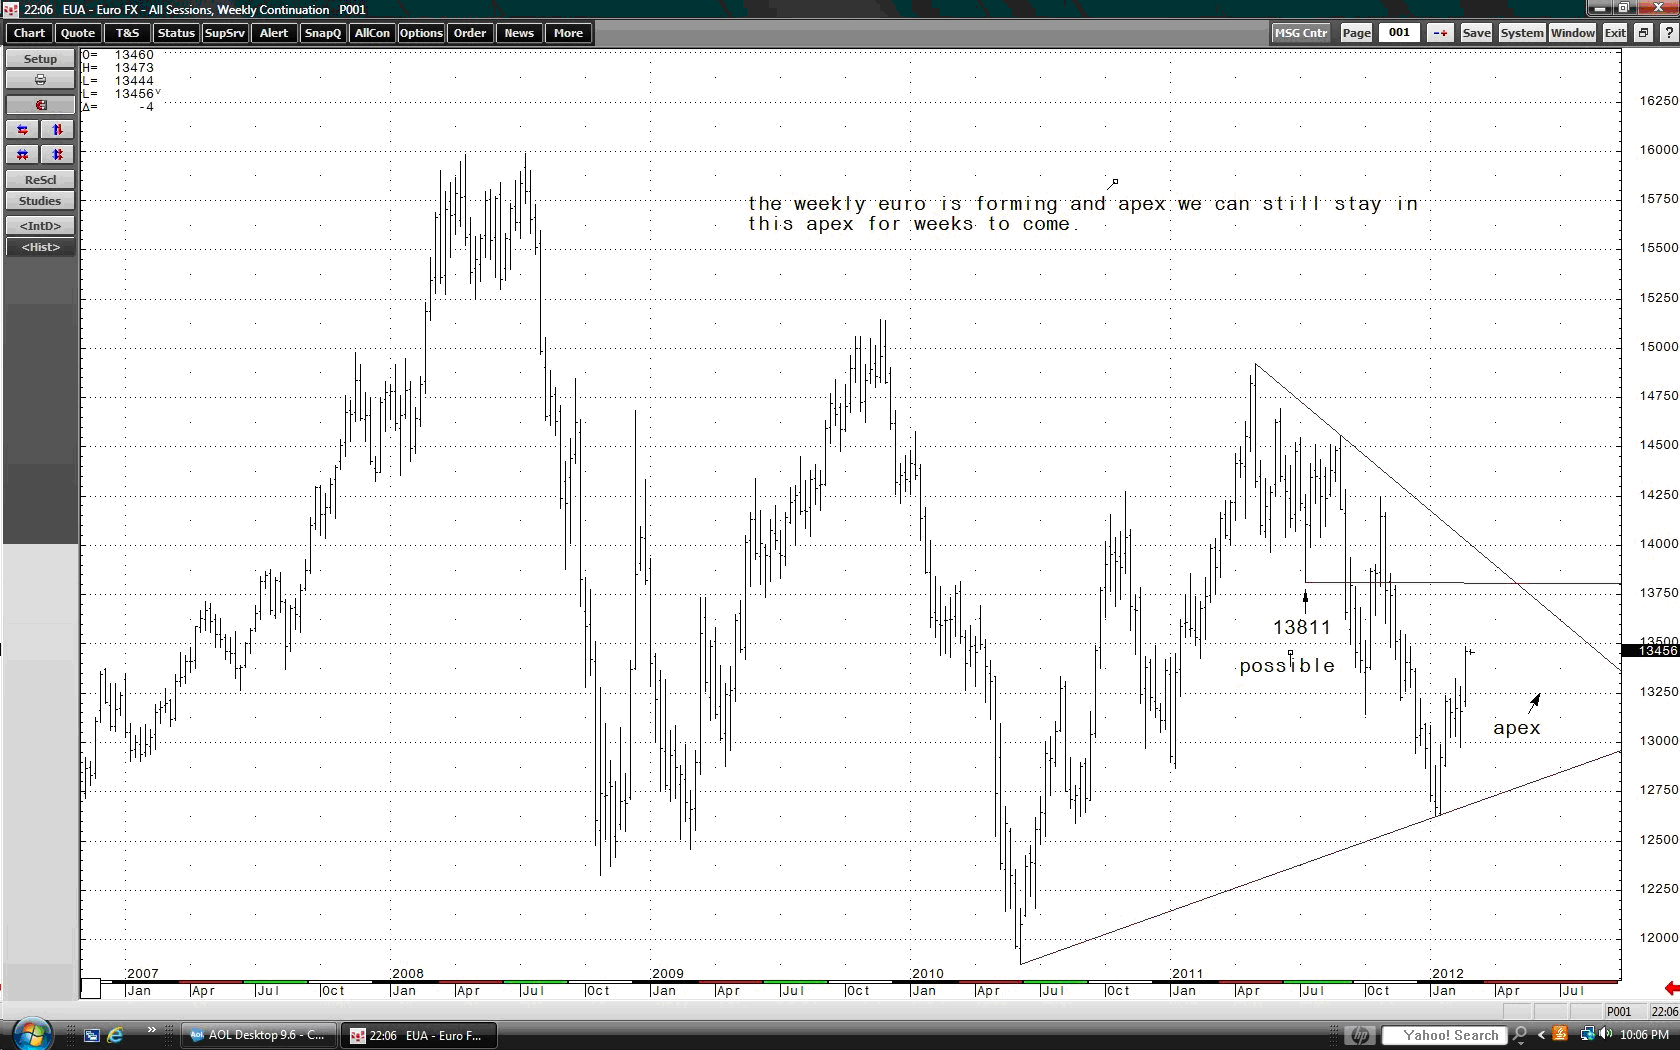
Euro weekly chart
-
Gary,Do you use volume on PnF charts the same way as on Vertical (bar) charts? For instance on a bar chart when there is a wide spead bar with a high volume, would it be analyzed the same as a tall column of "X's" or "O's" with a high volume.
I don't mean to imply isolating the bar or column, but I want to keep my explaination simple. I know that I should consider the background and future confirmation.
I would compare the P&F chart to the bar chart, but only as a comparison, not an absolute. Keep in mind, Wyckoff did not use volume or time in his charting. This is something I do to try and capture a possible edge. I don't look at them exactly the same, but I do compare them.
Gary
-
What is smart money doing when the bar has a wide spread and very high volume? Then what is smart money doing when the bar has a wide spread and very low volume?
The theory of the composite operator is that they run campaigns. Be careful not to use one bar or a series of bars to make a statement about a market overall. It is too difficult to explain here the nuances of wide bar / high volume or wide bar / low volume bars. It varies on where these bars occur, trend, trading range, etc. You need to look at the whole picture, and not just one or two bars.
Gary
There is a substantial risk of loss in trading commodity futures, options and off exchange foreign currency products. Past performance is not indicative of future results.

Feltontrading Method
in Technical Analysis
Posted
Thank you for the kind words. As you mentioned, I would be happy to answer anyone's questions.
Gary