
Welcome to the new Traders Laboratory! Please bear with us as we finish the migration over the next few days. If you find any issues, want to leave feedback, get in touch with us, or offer suggestions please post to the Support forum here.


danhoyda
-
Content Count
29 -
Joined
-
Last visited
Posts posted by danhoyda
-
-
hey Jperl, what does the spread between the VWAP and the PVP tell you, If the spread is higher is it more likely to succeed?
-
Hi everyone! my name is daniel, I am relatively new to this forum and am so happy to be here because of the help I have recieved.
I would like to get some help on developing a code to do a certain kind of study for me.
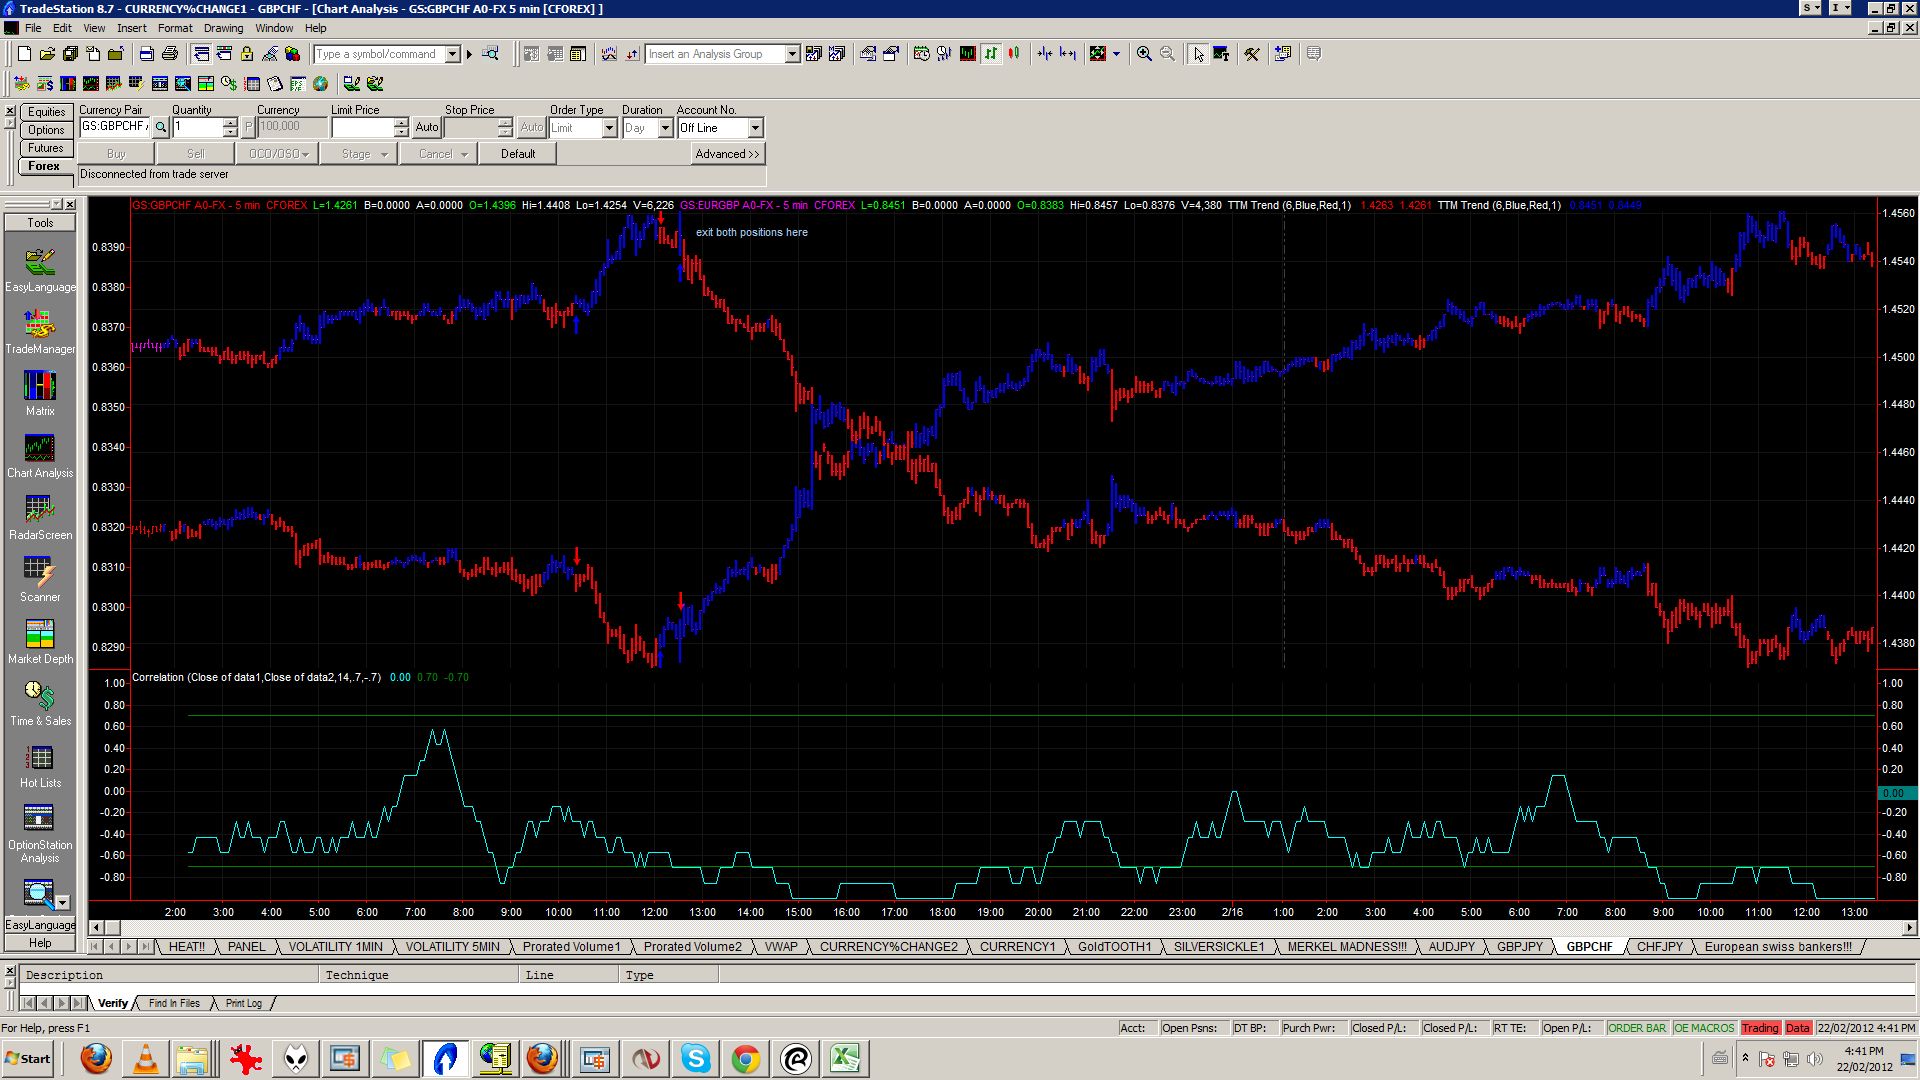
I have plotted on various graphs on tradestation, currency pairs. I have noticed that the inverse of the GBPCHF is almost exclusively the EURGBP. I am plotting the heiken indicator on each of the currency pairs.
The study I would like to conduct is as follows, As one bar on a currency changes color the program will look to see if the same bar on the other currency has also changed color. If this happens at the same time, the program should log the price of the close of each and enter a position in the direction of the indication on each currency. (Red = short, blue = long). Once a position has been logged, the study will continue to analyse bars on each currency and should one change color (on the close) the price will be noted (and theoretically position is closed)
I do not have very much experience with easy language so any help would be appreciated. Thanks!!
Dan

-
I think I understand better. Thanks Jerry.
-
thanks very much to all the support that was given to create this wonderfull tool. I am very gratefull to both dbtina and jperl. I am about halfway through the trading with market statistics section and am very much enjoying it. I really like who Jperl uses Newbie, because thats what I am right now. Just wanted to post my thanks. I did not know that the tick by tick had to be constructed in real time. This helps alot.
-
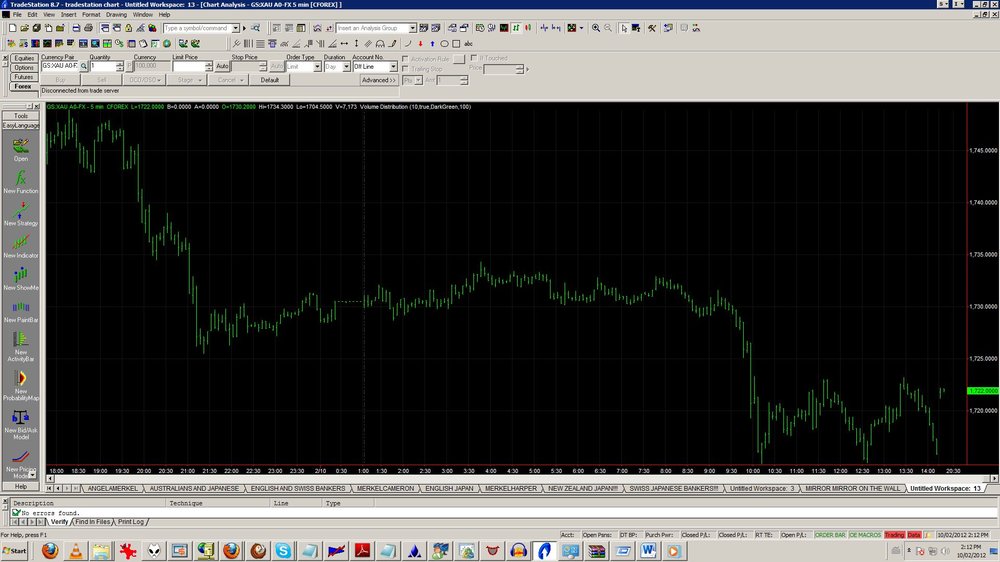
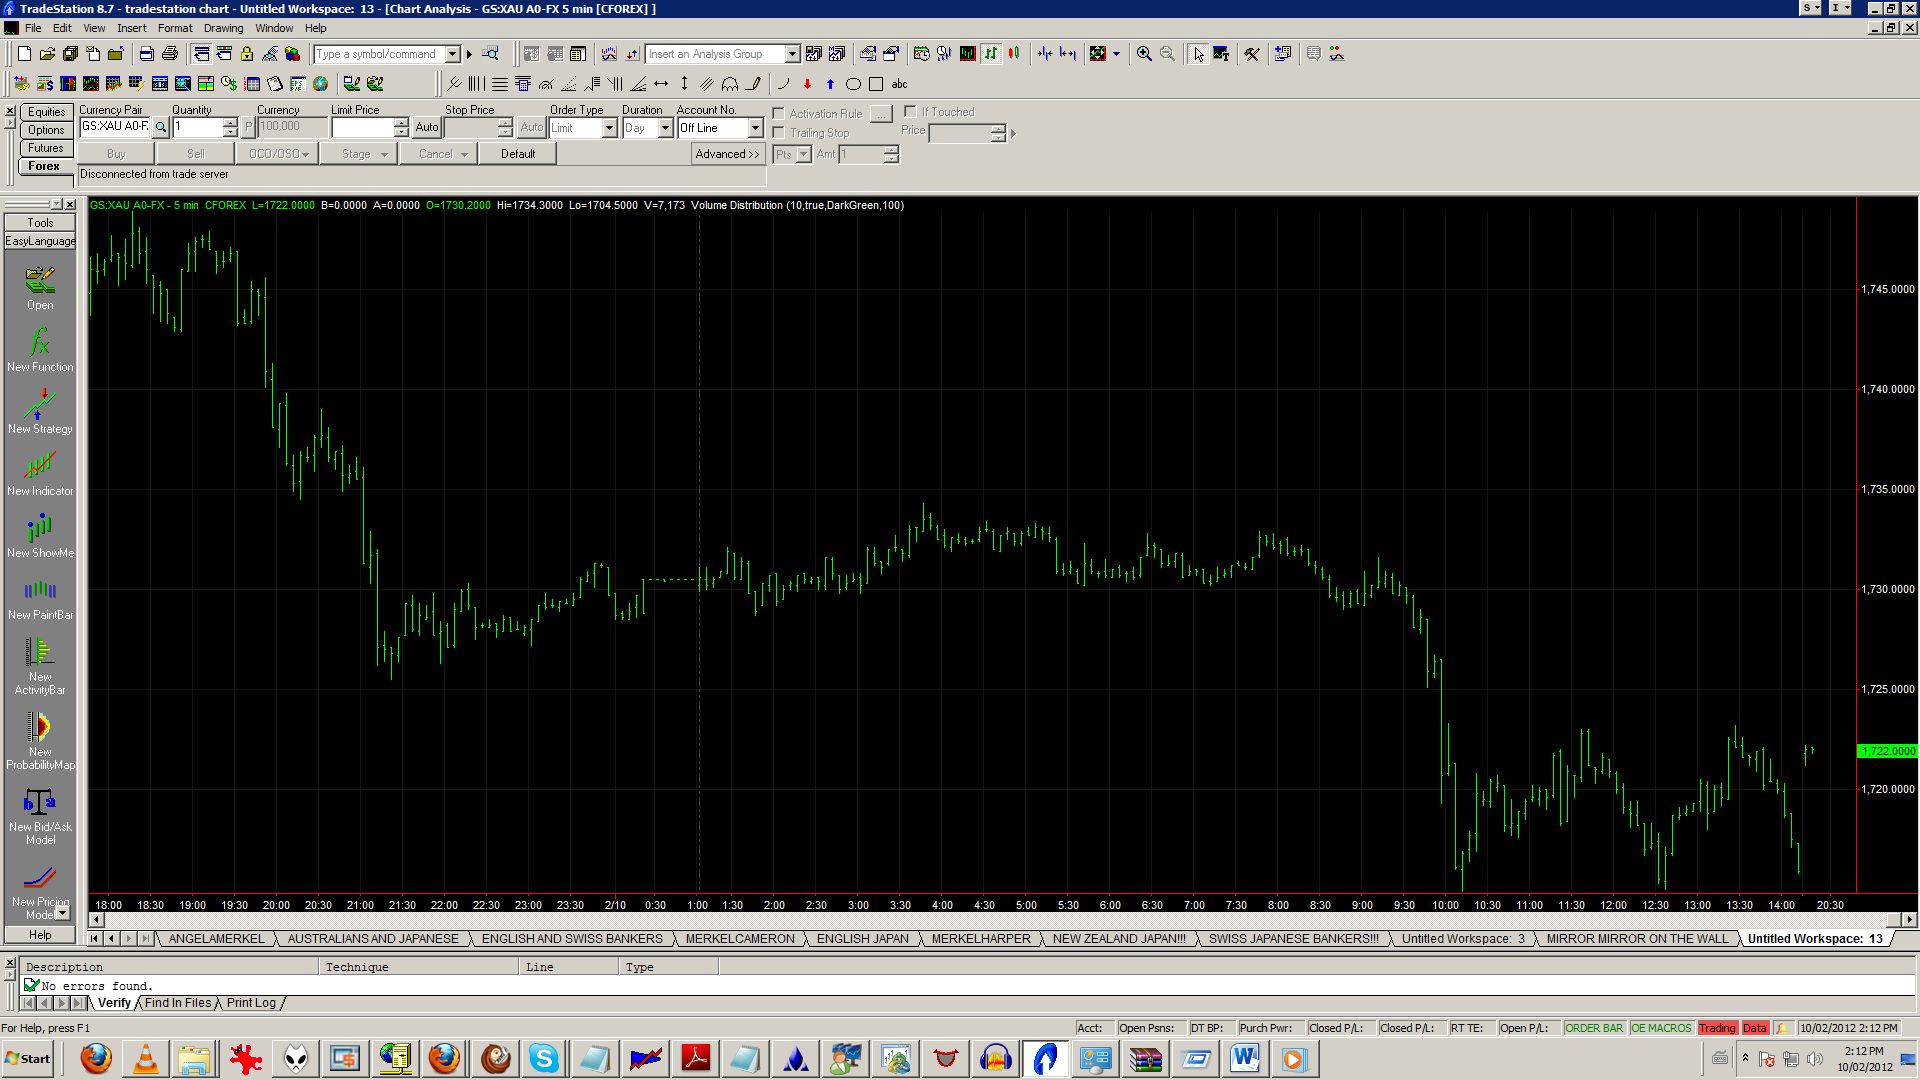
hey Jerry, I love the technique. You have indeed taught me. My question today is with the FX. I have been interested in plotting the volume distribution on the forex but it does not seem to have the same results as plotting the distribution as with other vehicles. I guess my question is. If you plot the Volume and get the price on the close of the bar, as you could do with any simple volume indicator, would this be the same price (the peak volume point) as the peak volume price on the volume distribution histogram. I think my question is, what is the difference between the volume distribution and the volume?
-
I am pretty sure it calculated a 10 day high and low a 5 day high and low and a 1 day high and low as well as a relative high and low of the current chart timeframe. I believe it also calculated bottom relative high and low points, I think the program called these BP's however it could be B_'s something else because I can't quite remember.
Thanks Onesmith
Dan
-
so do they not work for forex?
-
hey guys, Im not sure if you guys know about it but there was an indicator called something like keysupport and resistance. I recently uninstalled TS to see if something was working incorrectly. However now that I reinstalled it I can't find the indicator on this site. Has anyone managed to find it. I would be very thankful for anyone that can point me in the right direction.
Thanks!
Dan
-
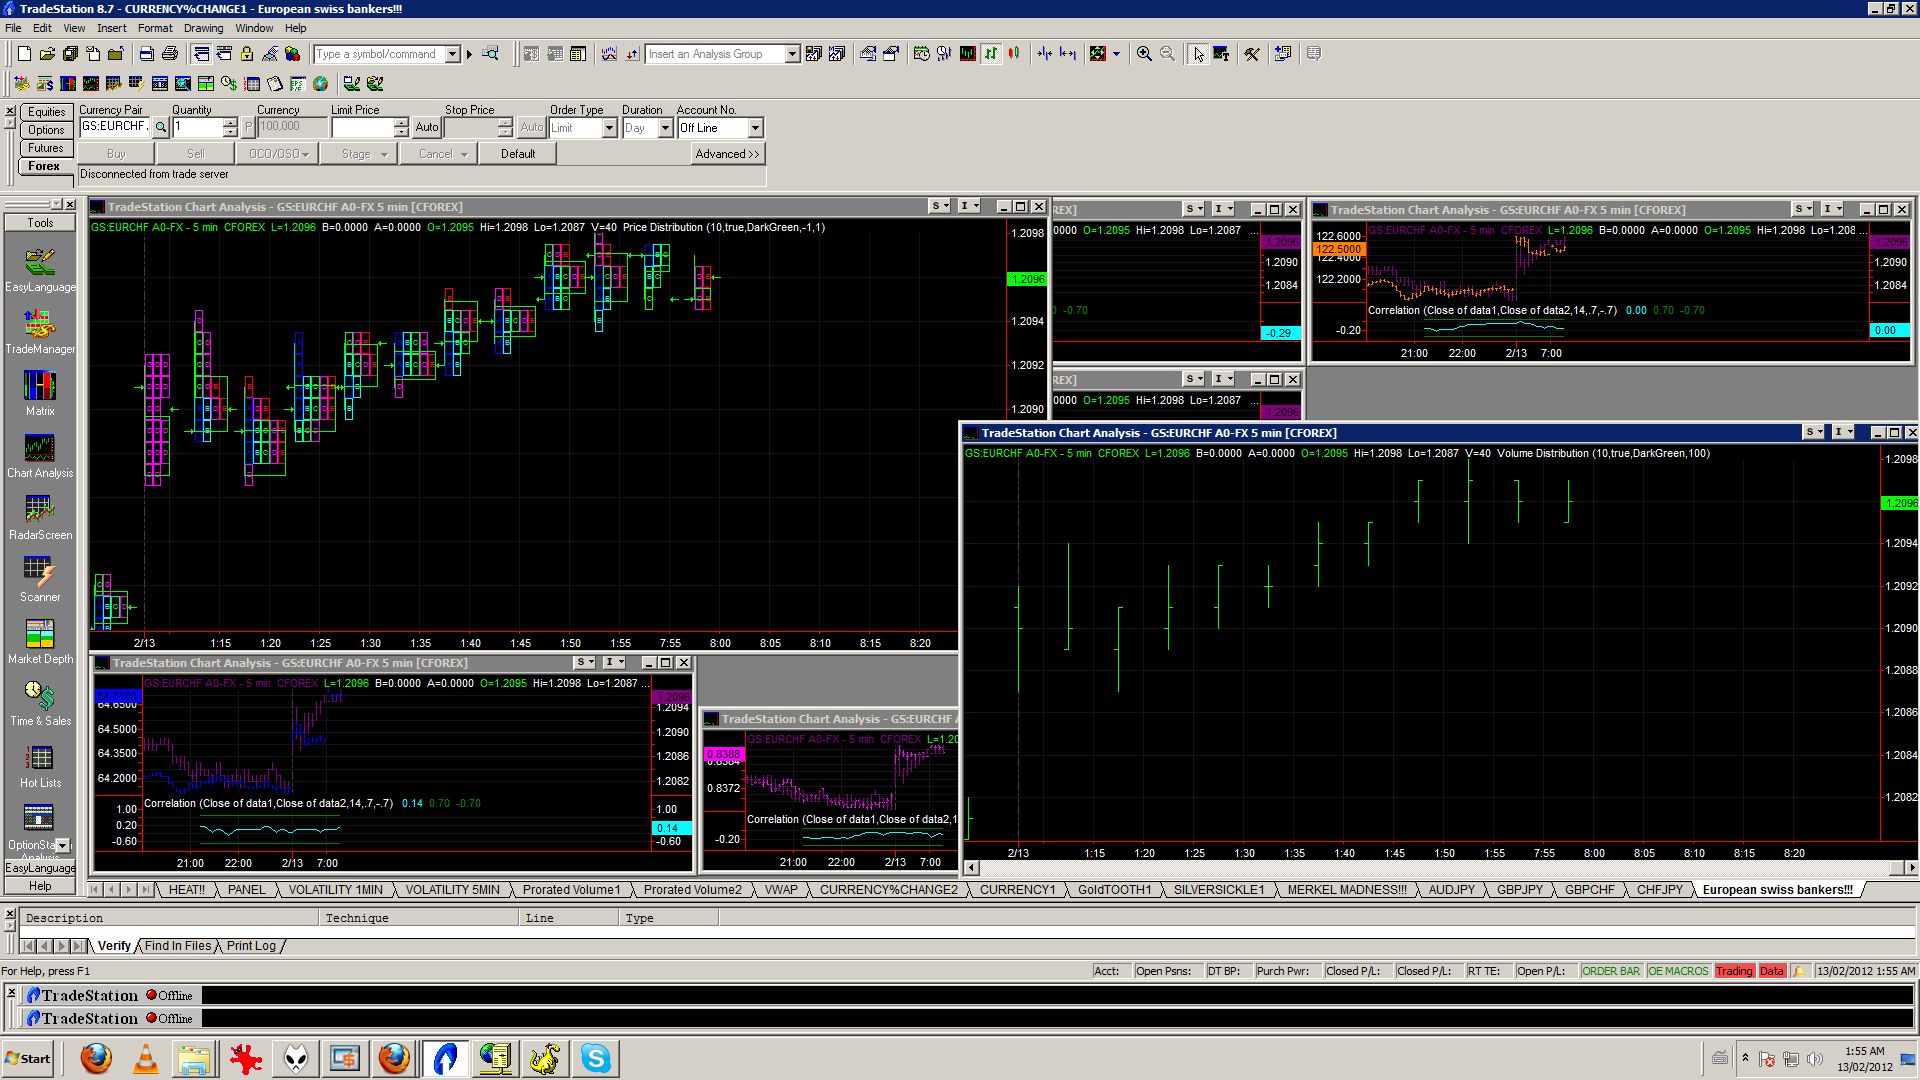
hey tiger. I get the data from global server. I only get the forex so I don't have access to the ES. Also tradestation is working in offline mode. the data comes through quoteroom and globalserver and owndata (quotemanager).
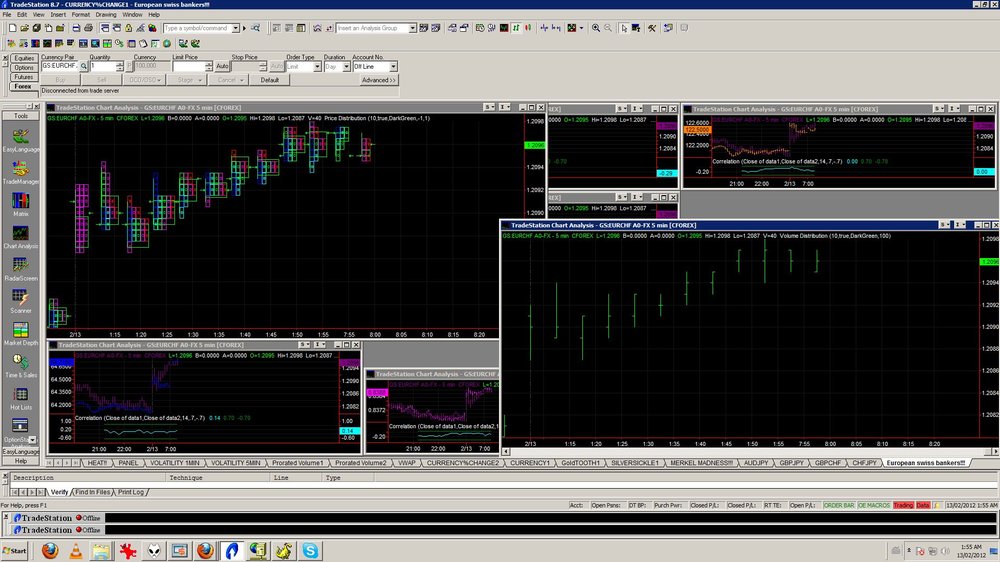
Here is a picture of the price distribution and the volume distribution for the EURUSD.
Thanks for the help so far!
Dan
-
I'm not sure if this tool needs the bid ask information. TS is not allowed in Canada so the TS copy is cracked. Not sure if this is why.
-
From what I understand, when you go to the activity bar in tradestation and plot the volume distribution, you are supposed to get a distribution on the left side of the screen. I'm not sure what is wrong with my tradestation because I get the picture you see on the screen. I am not sure what you mean about spot forex and it being useless. Can you elaborate. Thanks for the help
Dan
-
Hey guys I'm not sure what is wrong with my tradestation but when I go to plot the volume distribution under the activity bar it shows very strange information, I am not sure what to make of it. I have posted a pic below. Is there something wrong with how I plotted it?
-
thanks onesmith. I have been interested in the murray math indicator do you know anything about it?
-
I LOVE this indicator. Thank you very much for this. Could someone explain to clearly what exactly it is doing. My code understanding is very limited. Any help would be appreciated.
Thanks!
Dan
-
that computer date time thing is what I changed it back to.
Dan
inputs:
UpCol( black ),
DnCol( Red ),
UpPRV(green),
DnPRV(Darkcyan),
delay(10);
variables:
offset(0),
color(0);
vars:
CurrentTimeInSecs ( 0 ),
TotSecondsDiff( 0 ) ,
SecondsDiff( 0 ) ,
MinutesDiff( 0 ),
prv(0);
plot1(0, "Zero");
if date = date[1] then
begin
CurrentTimeInSecs = ( ComputerDateTime - DateToJulian( Date ) ) * 86400 ;
TotSecondsDiff = CurrentTimeInSecs - CurrentTimeInSecs[1] ;
end;
If TotSecondsDiff > delay then
begin
prv = (ticks/TotSecondsDiff) * 60 * barinterval ;
IF prv > ticks[1] THEN
setPlotColor( 2, UpPRV)
else
SetPlotColor(2, dnPRV);
Plot2 (prv, "PRV");
end;
if c > c[1] then
color = upcol
else
if c < c[1] then
color = dncol
else
color = color[1];
Plot2[1] (ticks[1], "PRV");
plot3(ticks, "Volume", color);
-
pardon me I got it to work thanks for the help I changed something on the original code and thats why it didnt work. I changed it back and now it is.
Thanks.
Love the indicator.
-
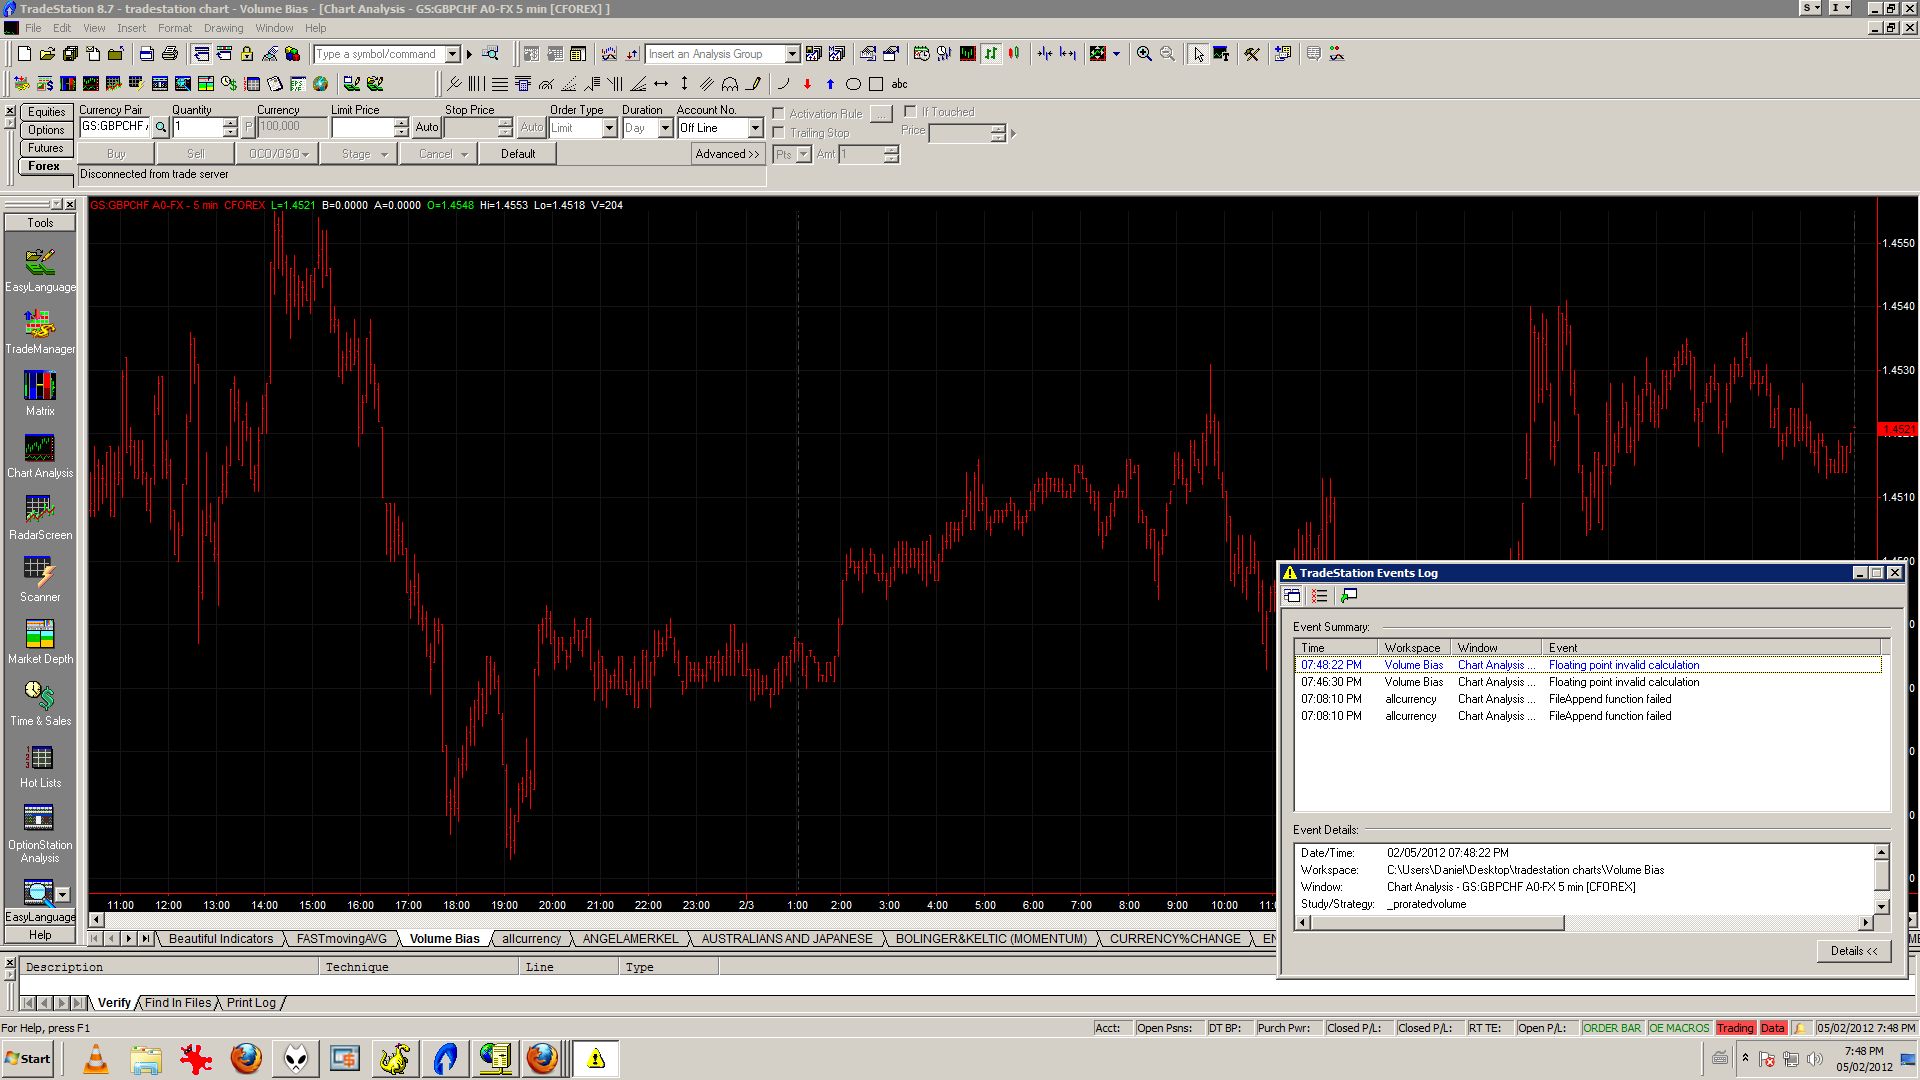
hey tams here is the screenshot you requested i am trying to plot it for the GBPCHF ratio, the error i get is a floating point invalid calculation
here is the code in the easy language as well.
// PRV Pro Rated Volume
// author: unknown (previousely posted by TXUK)
// enhancements by TAMS
//
// This indicator projects the volume at the end of the bar.
// It calculates the PRV based on the current trade pace,
// and the time remaining in the bar.
//
// This information is useful to spot turning points
// ie. whether the money is drying up... or flooding in.
//
// This indicator is usable on minute charts only.
//
// Instructions:
// Set the volume to display as a thick histogram
// and the PRV to display either as a thin histogram, or as a thick point.//
//
// enhancemnts by TAMS:
// 20070102
// added user configurable colors
// auto detect chart resolution (original version can only be used on 5min chart)
// added delay, so that the PRV does not get overwhelmed at the beginning of the bar
// added the zero line, so that autoscale starts at zero instead of the lowest volume
//
inputs:
UpCol( black ),
DnCol( Red ),
UpPRV(green),
DnPRV(Darkcyan),
delay(10);
variables:
offset(0),
color(0);
vars:
CurrentTimeInSecs ( 0 ),
TotSecondsDiff( 0 ) ,
SecondsDiff( 0 ) ,
MinutesDiff( 0 ),
prv(0);
plot1(0, "Zero");
if date = date[1] then
begin
CurrentTimeInSecs = ( Currenttime - DateToJulian( Date ) ) * 86400 ;
TotSecondsDiff = CurrentTimeInSecs - CurrentTimeInSecs[1] ;
end;
If TotSecondsDiff > delay then
begin
prv = (ticks/TotSecondsDiff) * 60 * barinterval ;
IF prv > ticks[1] THEN
setPlotColor( 2, UpPRV)
else
SetPlotColor(2, dnPRV);
Plot2 (prv, "PRV");
end;
if c > c[1] then
color = upcol
else
if c < c[1] then
color = dncol
else
color = color[1];
Plot2[1] (ticks[1], "PRV");
plot3(ticks, "Volume", color);

-
when i try to apply it to a chart it says floating point invalid calculation.
-
hey Tams, I am not sure what I have to change here to make it work in tradestation, can you give me another hint.
// PRV Pro Rated Volume
// author: unknown (previousely posted by TXUK)
// enhancements by TAMS
//
// This indicator projects the volume at the end of the bar.
// It calculates the PRV based on the current trade pace,
// and the time remaining in the bar.
//
// This information is useful to spot turning points
// ie. whether the money is drying up... or flooding in.
//
// This indicator is usable on minute charts only.
//
// Instructions:
// Set the volume to display as a thick histogram
// and the PRV to display either as a thin histogram, or as a thick point.//
//
// enhancemnts by TAMS:
// 20070102
// added user configurable colors
// auto detect chart resolution (original version can only be used on 5min chart)
// added delay, so that the PRV does not get overwhelmed at the beginning of the bar
// added the zero line, so that autoscale starts at zero instead of the lowest volume
//
inputs:
UpCol( black ),
DnCol( Red ),
UpPRV(green),
DnPRV(Darkcyan),
delay(10);
variables:
offset(0),
color(0);
vars:
CurrentTimeInSecs ( 0 ),
TotSecondsDiff( 0 ) ,
SecondsDiff( 0 ) ,
MinutesDiff( 0 ),
prv(0);
plot1(0, "Zero");
if date = date[1] then
begin
CurrentTimeInSecs = ( Currenttime - DateToJulian( Date ) ) * 86400 ;
TotSecondsDiff = CurrentTimeInSecs - CurrentTimeInSecs[1] ;
end;
If TotSecondsDiff > delay then
begin
prv = (ticks/TotSecondsDiff) * 60 * barinterval ;
IF prv > ticks[1] THEN
setPlotColor( 2, UpPRV)
else
SetPlotColor(2, dnPRV);
Plot2 (prv, "PRV");
end;
if c > c[1] then
color = upcol
else
if c < c[1] then
color = dncol
else
color = color[1];
Plot2[1] (ticks[1], "PRV");
plot3(ticks, "Volume", color);
-
can anyone repost this code to TS i would be interested to try it out.
Thank you!
-
i think there is something wrong when i put this indicator on my chart it looks like this.
-
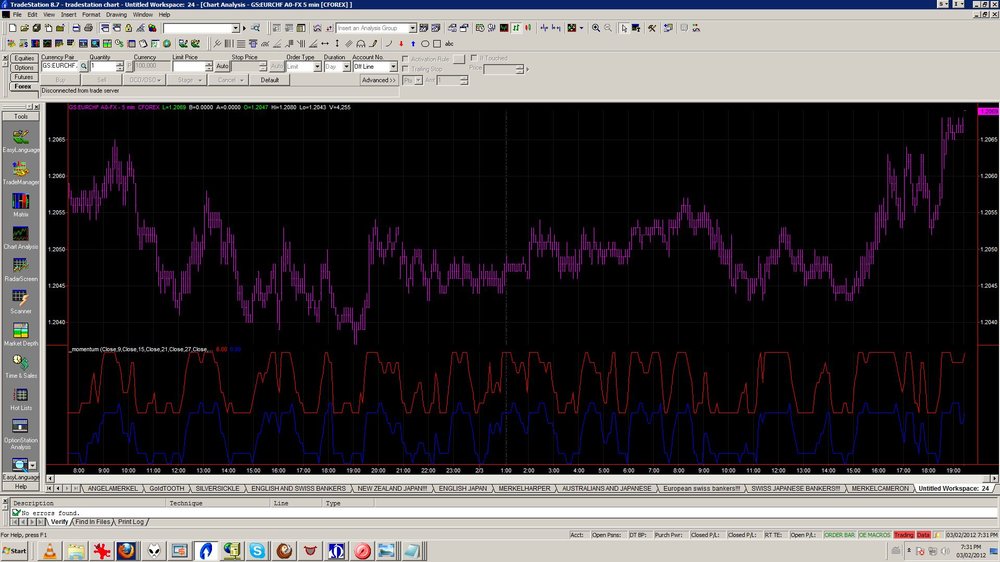
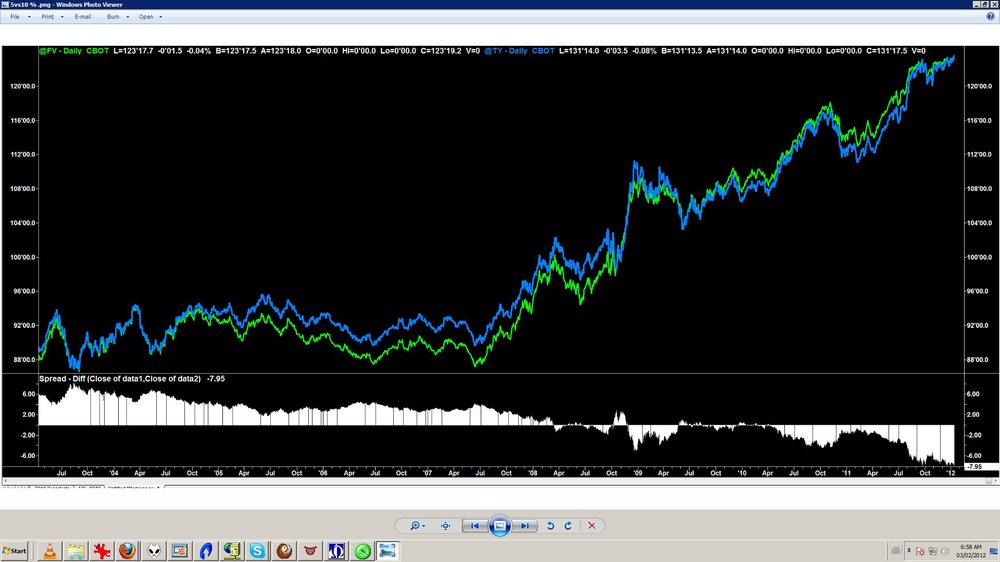
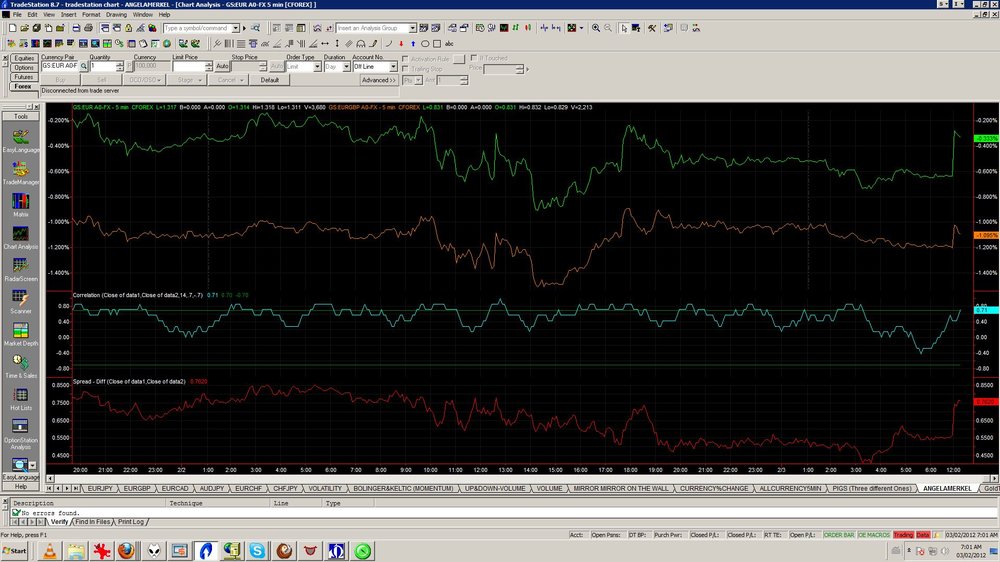
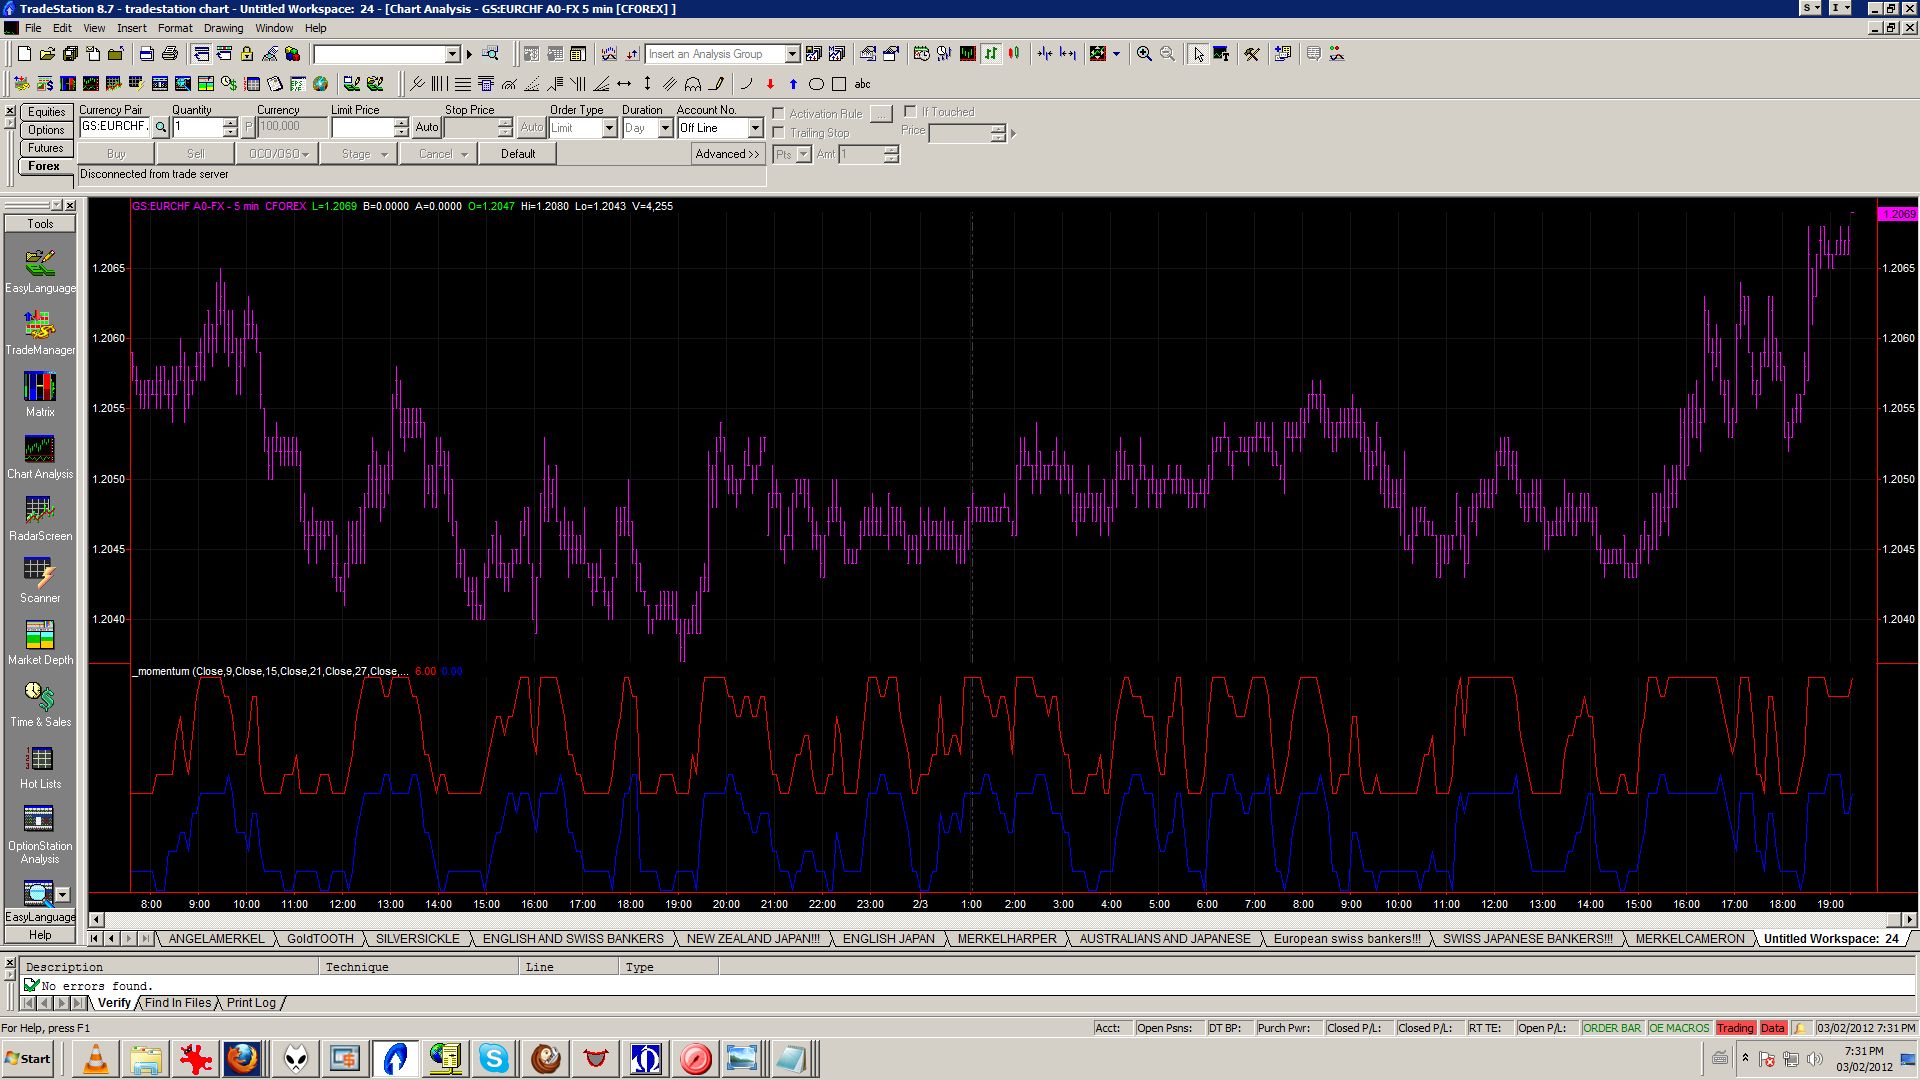
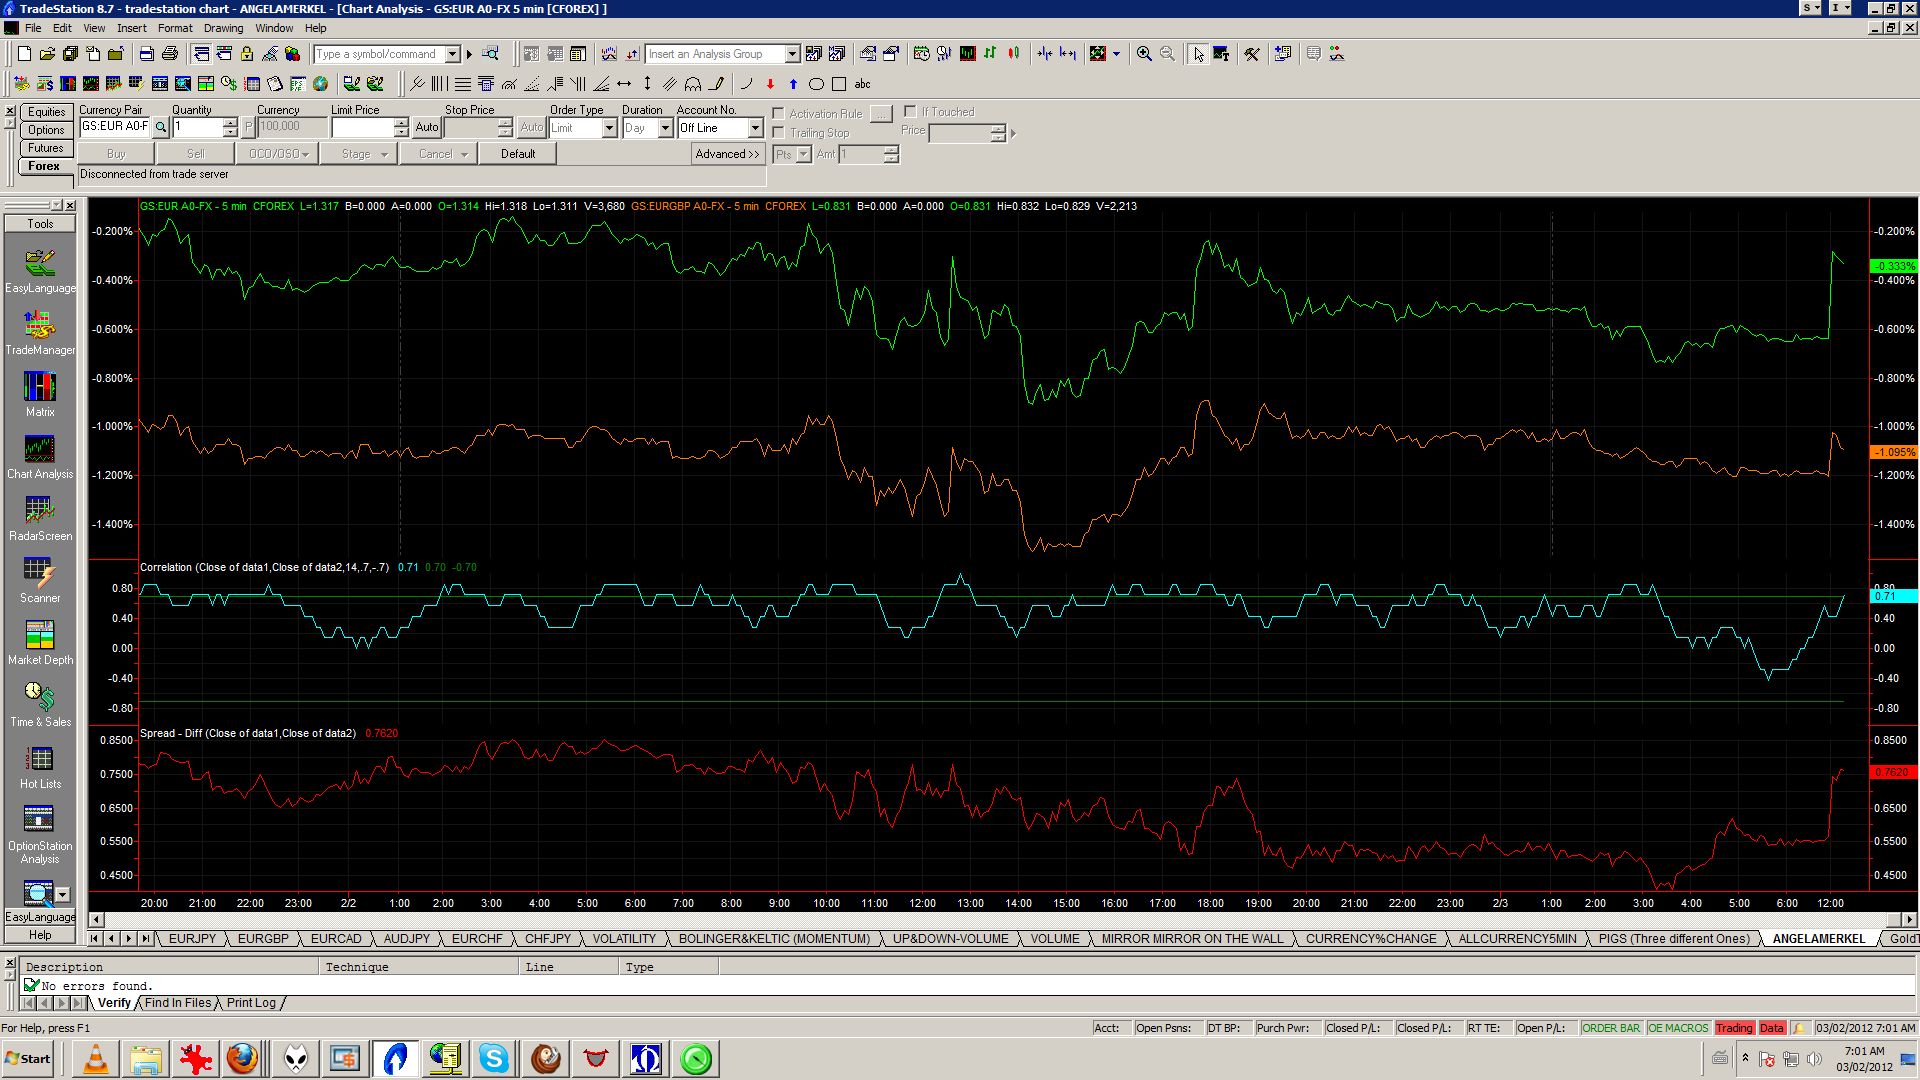
hey im trying to modify the tradestation indicator for the spread between two things on a % scale. the one thats on it just plots a line and I think it takes the absolute value. I would like it to trace a zero line and plot the reverse direction should a crossover occur between the two charts can anyone help me here are some screenshots of two different charts. there is nothing common with the charts.
-
here is the chart you requested.
-
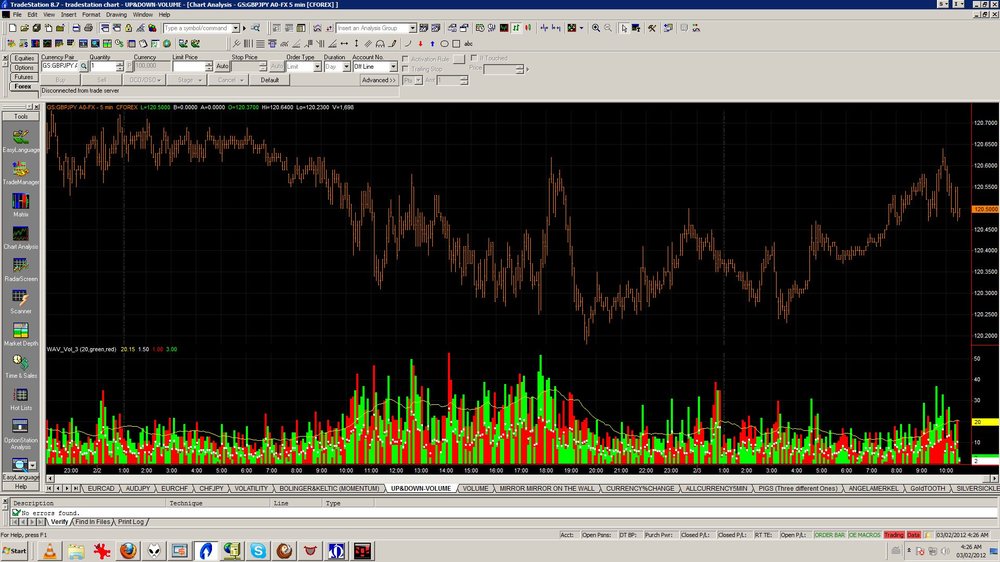
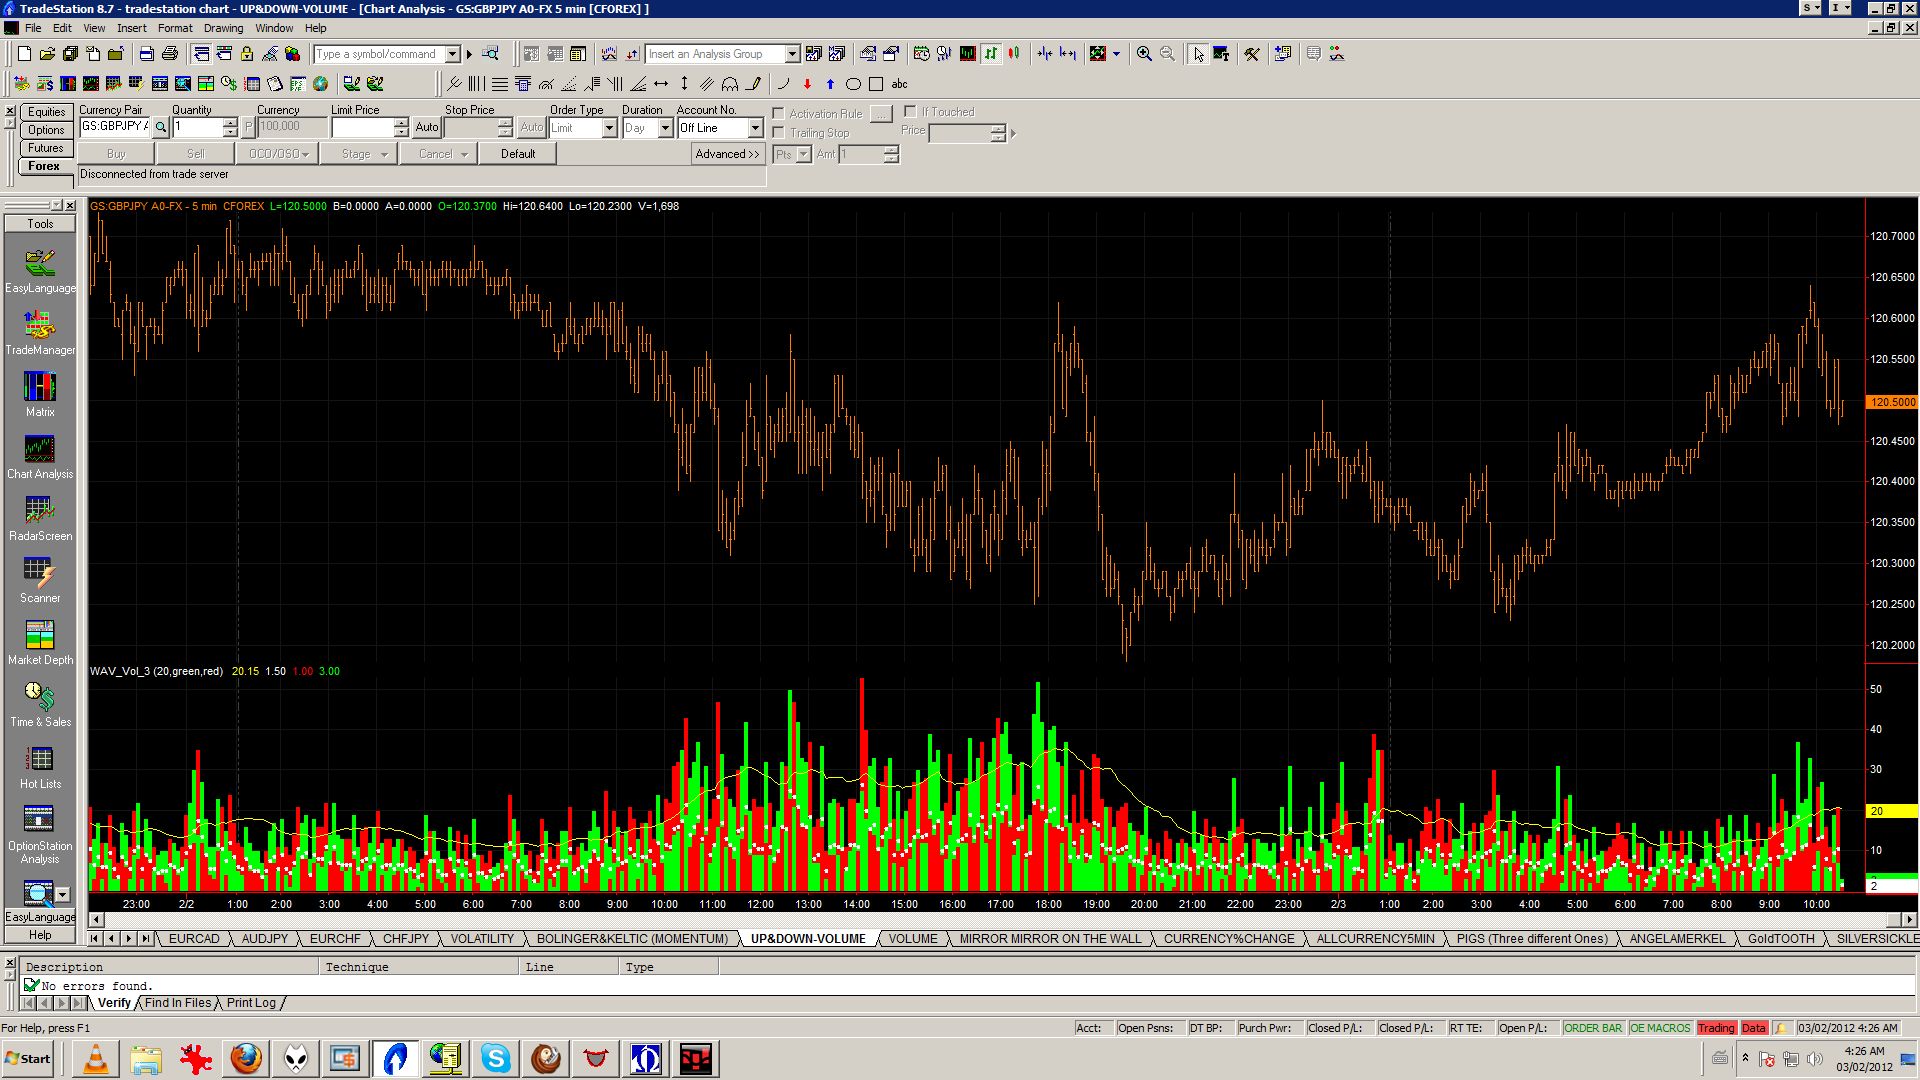
Hi everyone I am not very familiar with tradestation easy language, I got a indicator I like on this website. i think it was walter that led me to it or tams. Forgive me if I have got the person wrong.
I would like to add a alert when a quick increase or decrease happens. or even if a level is hit. so i know. Thanks for all the help, here is the code.
[LegacyColorValue = true];
{ WAV_Vol_3 Indicator WAV 8/20/05
intended for intra-day sessions only
plots histogram showing both upTicks and DownTicks for a bar in
real time - the larger of the 2 is always shown on top
plots volume average
plots mid-point of total average as a dot
}
inputs:
AvgLen(20), //length used in volume average
UpColor(green),
DnColor(red);
vars:
VolAvg(0), //plotted vol avg
Vol(0); //intra-bar volume (ticks)
//only for intra-day
if BarType < 2 then
begin
Vol = ticks; //sum of upticks and downticks
VolAvg = average(vol,AvgLen);
plot1(VolAvg,"Avg Vol");
//do not change order of following
//be sure both plot3 and plo4 are same width
if UpTicks < DownTicks then
begin
plot3(UpTicks,"UpDn",UpColor);
plot4(vol,"Total",DnColor);
end else
begin
plot3(DownTicks,"UpDn",DnColor);
plot4(vol,"Total",UpColor);
end;
//plot mid point of total ticks with a dot
//dot should fit within histogram
plot2(Vol/2,"Mid-Vol");
end;//if BarType

Bonds
in Market News & Analysis
Posted
I'm having trouble understanding bonds.
When interest rates go up, newly issued bonds have a higher interest rate per coupon payment so previously issued bonds which have a lower interest rate than the new bonds issued therefore they are less valuable to the market. The old bonds prices to market should go down.
The inverse would be true if interest rates go up. (ie bond traded prices go down interest rates are higher).
The bonds fluctuate on the market because they are traded. So wouldn't they be a gague for what interest rates actually are based on what the price of a bond, that is traded on the market at any given time? But the prices fluctuate alot. So if prices of bonds change alot then interest rates are always changing?! What does the fed mean when they are increasing or decreasing rates?
How does one differentiate between a bond traded on the market with a coupon rate of 5% compared to another bond traded at 10%? Are all bonds traded on the treasury market a given rate? How could they be? Because there are bonds issued every 2, 5, 10 and 30 years.
I guess my question is, When watching bond prices, how does one know what the coupon payment is when they buy one on the market?