
Welcome to the new Traders Laboratory! Please bear with us as we finish the migration over the next few days. If you find any issues, want to leave feedback, get in touch with us, or offer suggestions please post to the Support forum here.


BearBullTrading
-
Content Count
33 -
Joined
-
Last visited
Posts posted by BearBullTrading
-
-
BearBullWhat is the time frame in the charts?
20 changes?...
Tomer.
Yes..20 x price changes....I use this resolution primarily as an overall view/summary. I look at a 15 sec and a low resolution tick chart to follow price movement for more exact entries/exits more closely in RT.
Cheers
-
Wasn't on my game today....
Due to circumstance missed about the first 15 mins after pit open..This is often a good time to get positioned so felt uncomfortable having missed it. I had a valid entry to short just as I was getting settled in but passed as had already missed an earlier entry point
Took a short entry later (mid screen) but the quick exit was random...
Accepted I wasn't "on it" so chose to be an observer for remainder of session.
Cheers
-
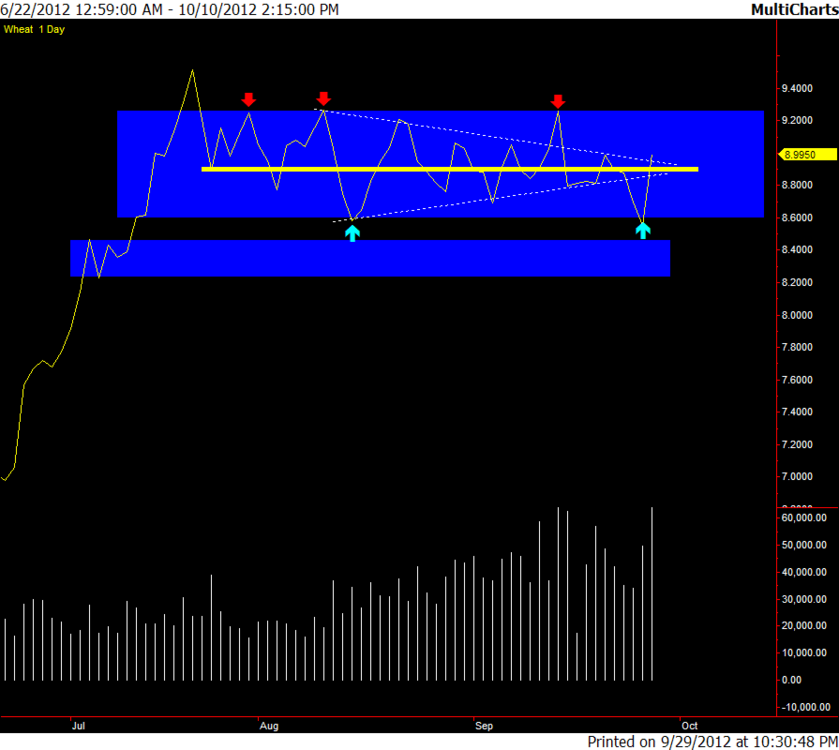
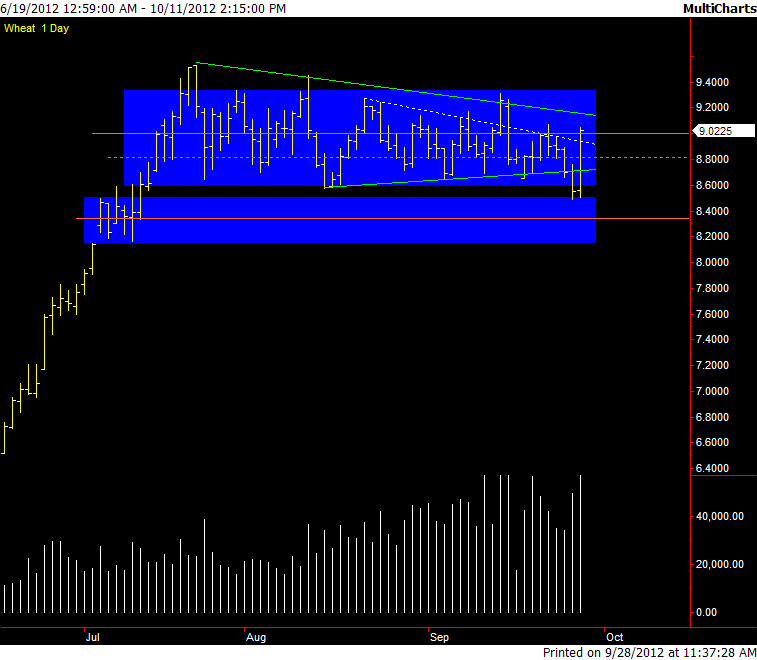
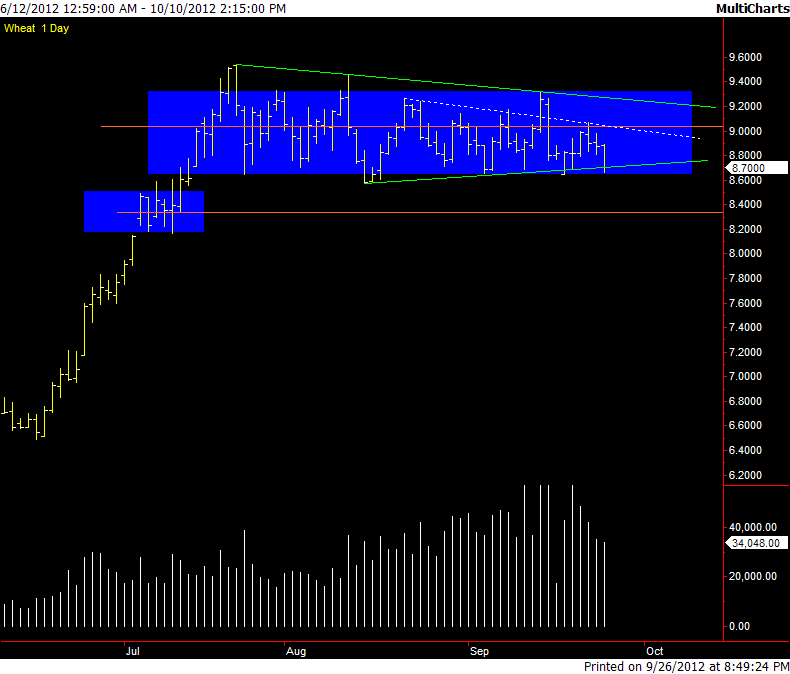
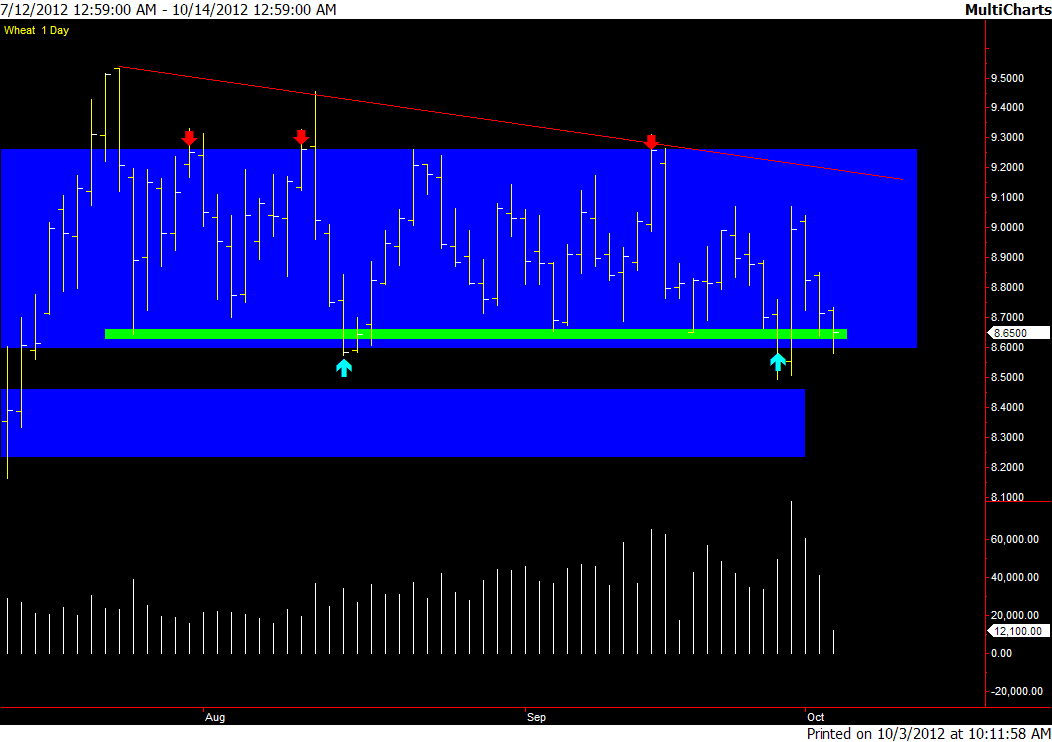
Chart 1 : Daily
We have come back to the lower end of the Large Trading Range, having failed to take out the previous swing high.
I have marked a line in an area where price has touched several times. Price has also made excursions below this line - the purpose is to indicate a general area of interest, not necessarily a specific level.
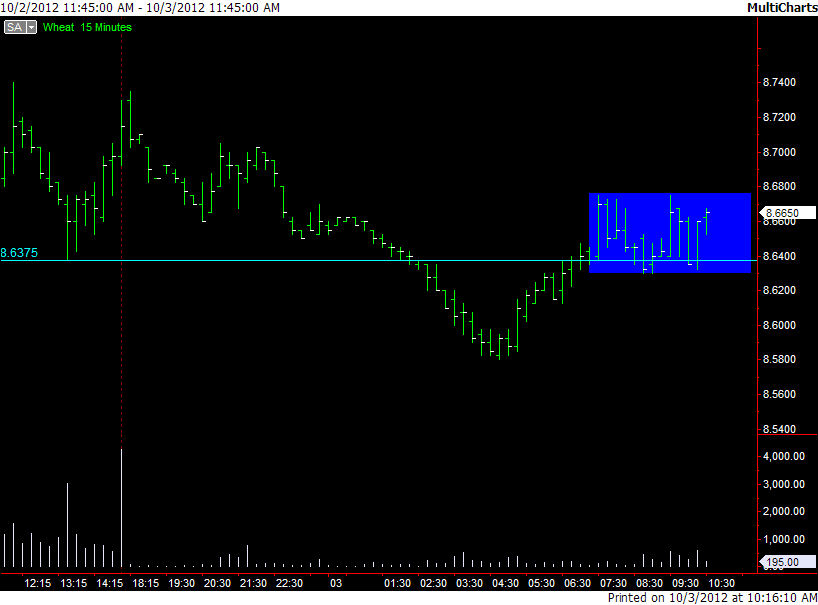
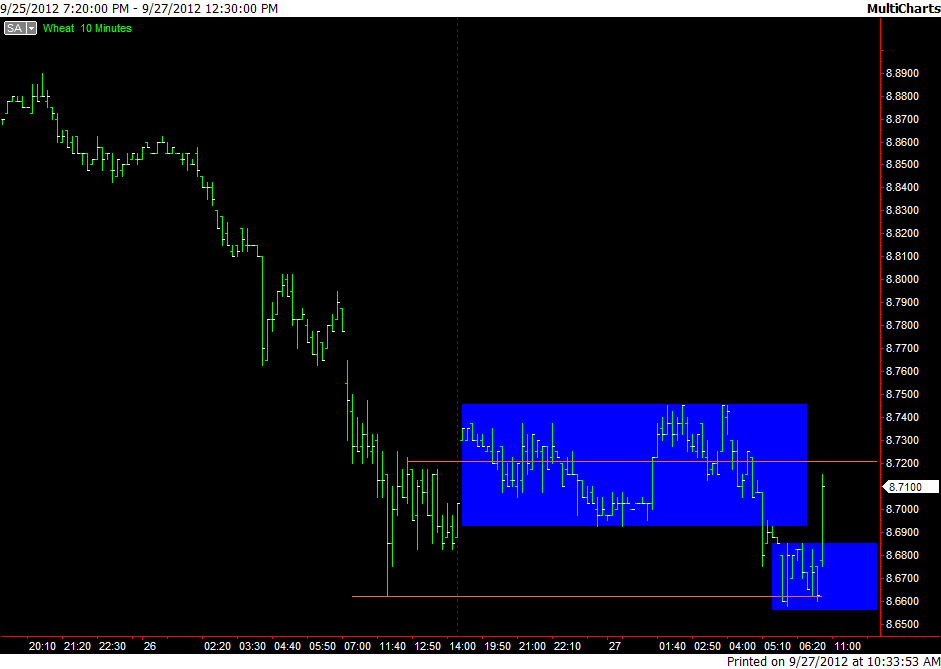
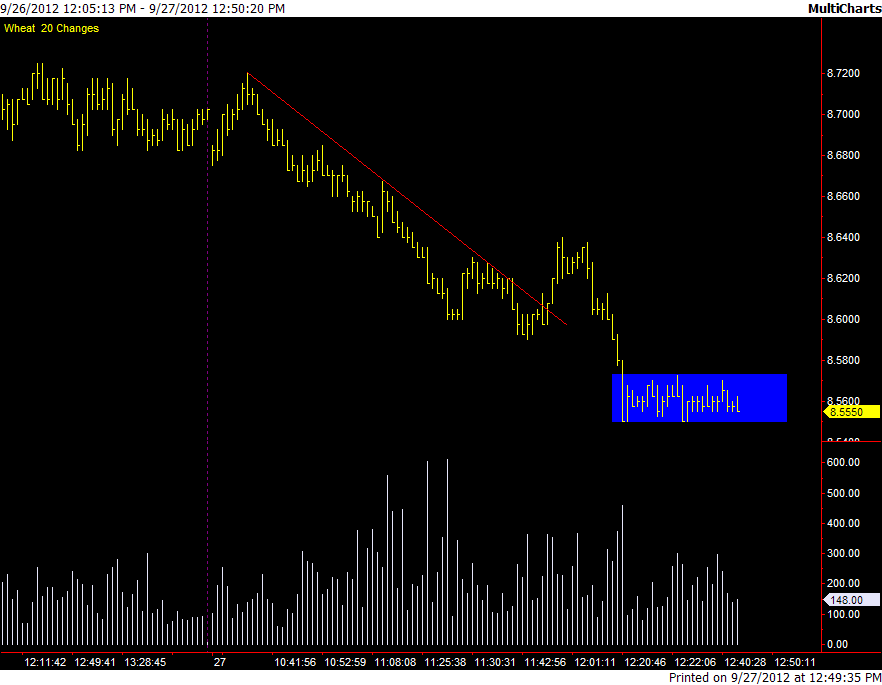
Chart 2 : Overnight Session
We see price fell below previous day low (cyan line) before forming a range prior to the pit open.
The ON low is formed between 8.5800/8.6000 & there are a couple of slightly larger volume bars going into the low and coming out.. I didn't notice these on this chart in RT at the time of printing. Only later in day & may be (in)significant ?
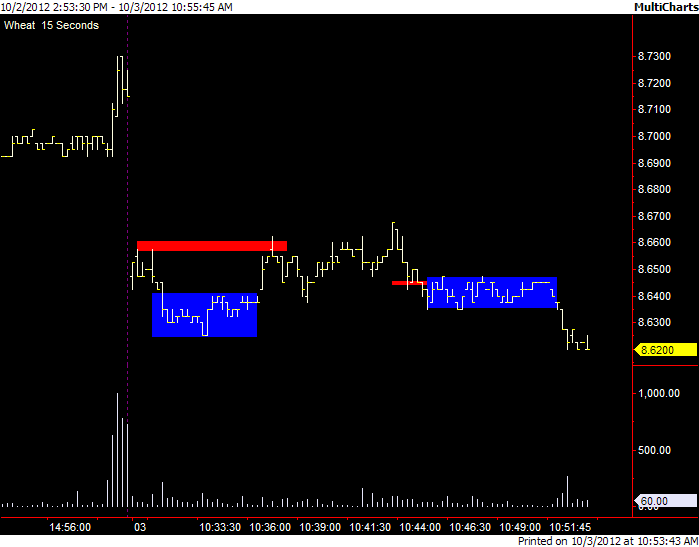
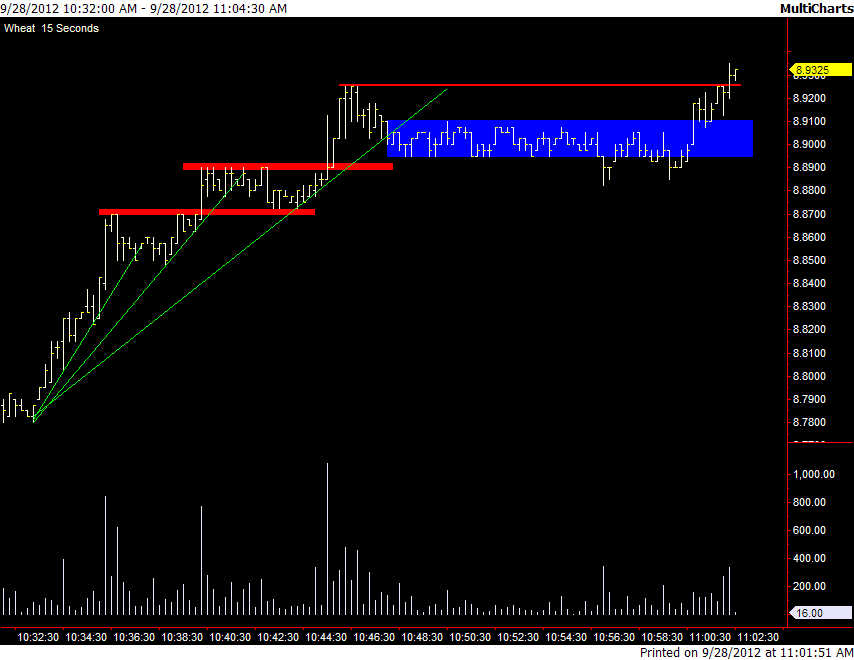
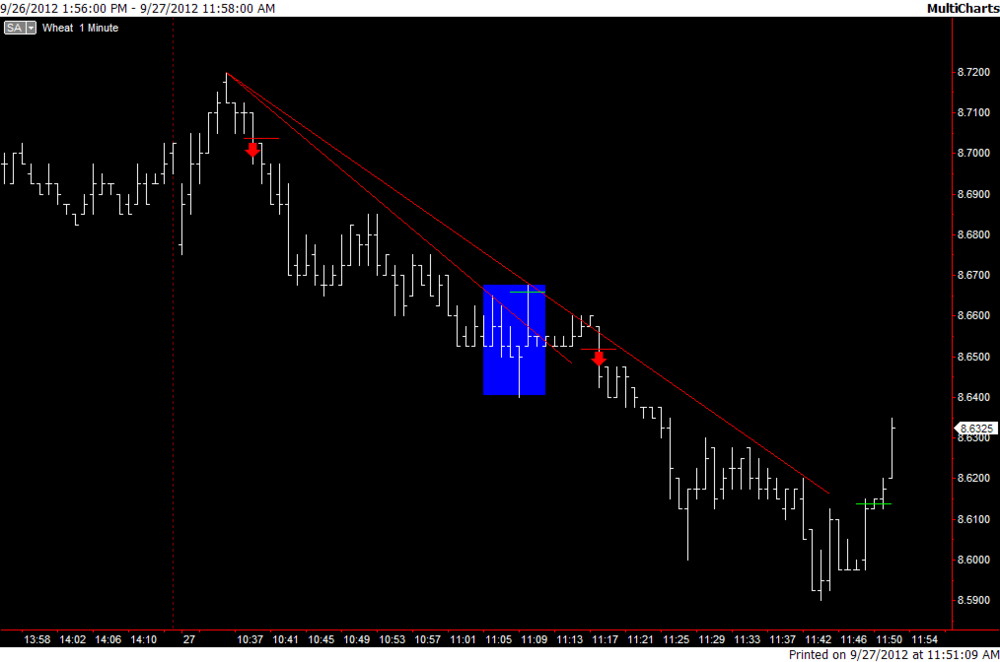
Chart 3 : 15 Second
First trade: Long above red line. At this point we were still in the pre open range indicated on previous chart..Violation of my plan as I should have waited to see which which out of that range we moved.
Stopped for loss on break of demand line(mental, not drawn) and Lower Low.
Second trade : Short on break of minor consolidation. Stopped for loss on pullback (error printing chart)
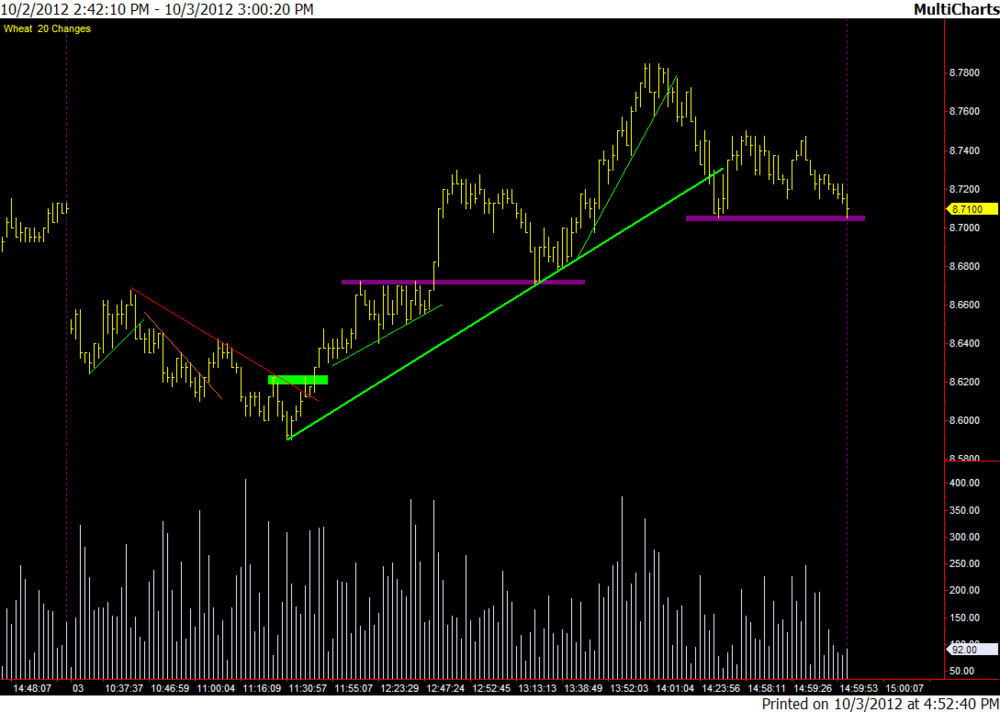
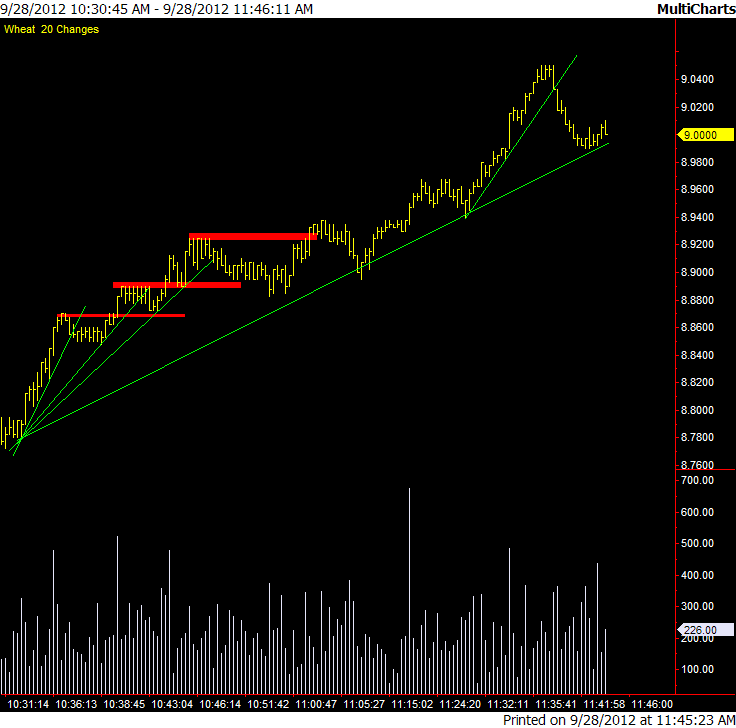
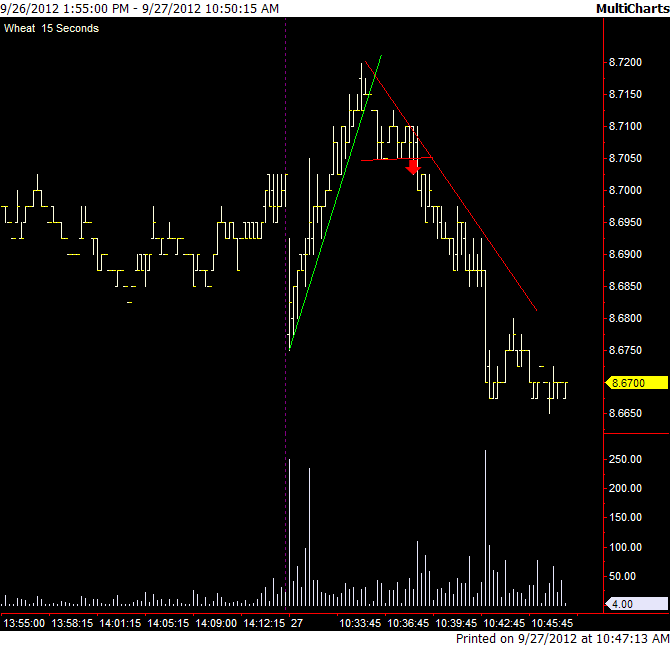
Chart 4 : 15 Second
I've shown my long entry here, break above green line (printed as quick as I could in RT) but maybe the most interesting aspects are my thoughts/observations behind it in RT as opposed to the actual entry/exit,
- We are in a general area where there "may" be an attempt to provide support.
- The DOM : . Wheat generally has about 15 > 30 contracts shown at each level on the DOM.
As price was falling from 8.6350 I noticed about 150/200 contracts bid at 8.6000.Price initially bounced of 8.6025 (the bids stayed at 8.6000).
Price bounced, came back and filled the large bid. There was a a nice bounce before again coming to re-test the lows.
This time price went through, found more volume & then reversed
AFTER this reaction & we got back to the 8.6000 level there were still bids in the DOM of 120/130 contracts layered at 8.5975 / 8.5925 / 8.5875.
I don't know, or need to know the motives behind the bids - could be exiting previous shorts or opening new positions... We DO know that we are in a possible low of day / reversal area & that higher than average bids have already been filled in this area, and there are still unfilled bids for more. Also in approx area of ON low, where there was slightly higher volume ON as per chart 2 comments
- Following the "spring" off the low, we test the previous reaction high.
At this point I'm thinking how the person(s) who were bidding for a further 400 contracts at the lows is thinking...How bad do they want them...Does another point or two matter to them ?....Will they be given a 2nd opportunity at the low? ..Will they get aggressive ?
From the reaction high we consolidate briefly. .This makes me think as we havent (yet) retested lower. may move higher, but I have to wait for the market to show its handr.. Price takes out the previous 2 reaction highs = Long
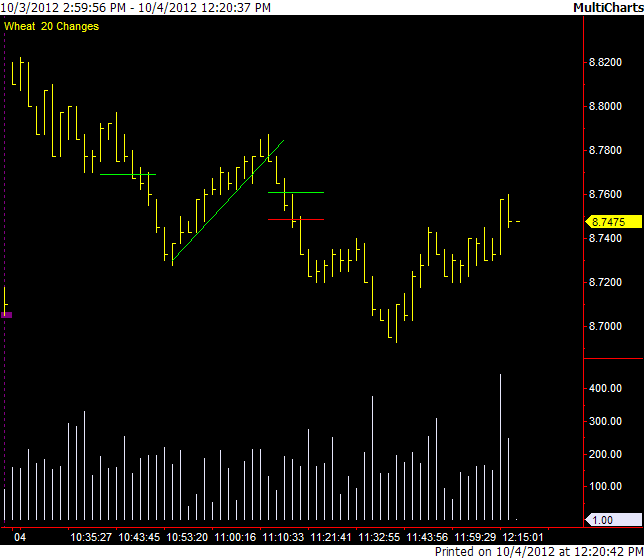
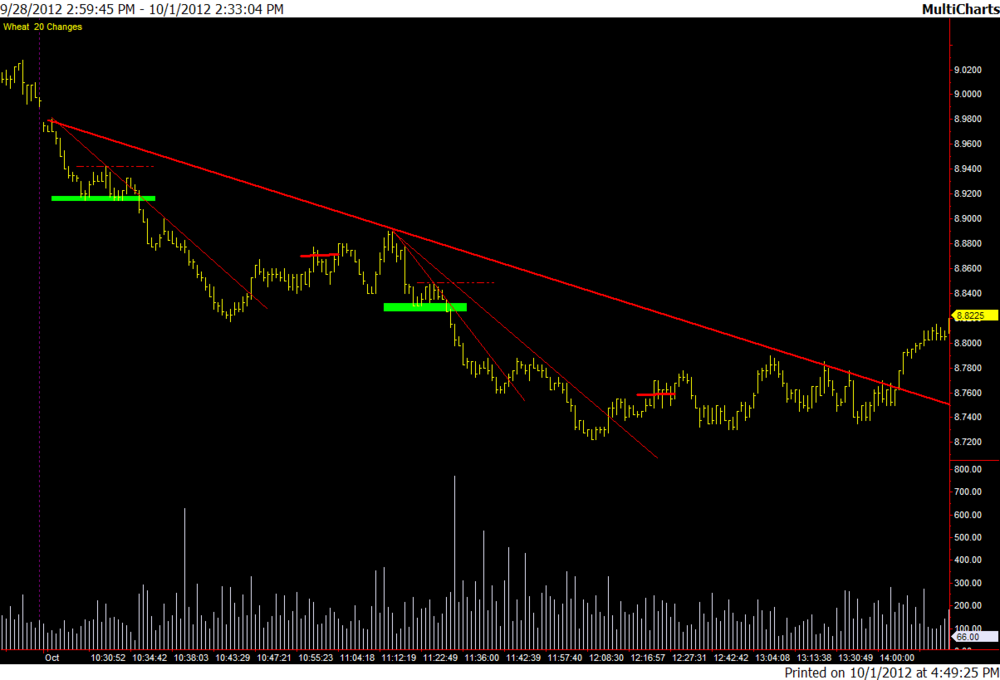
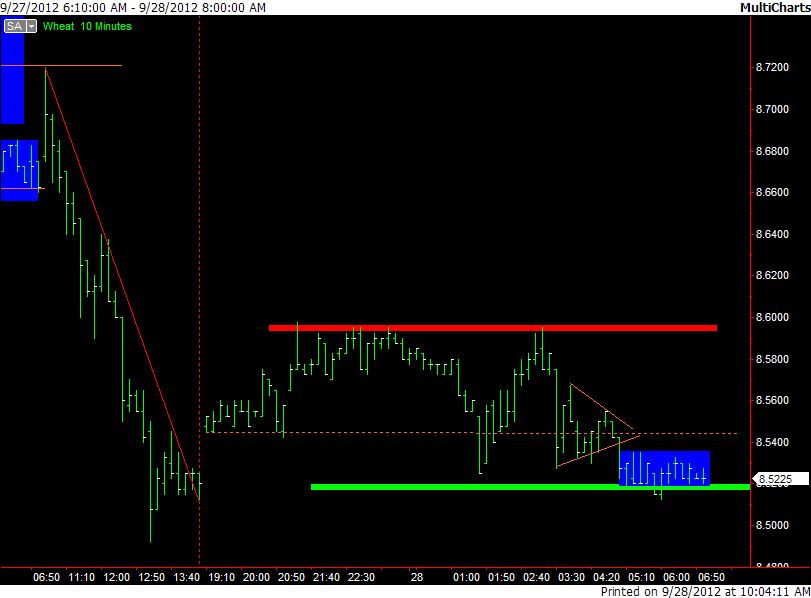
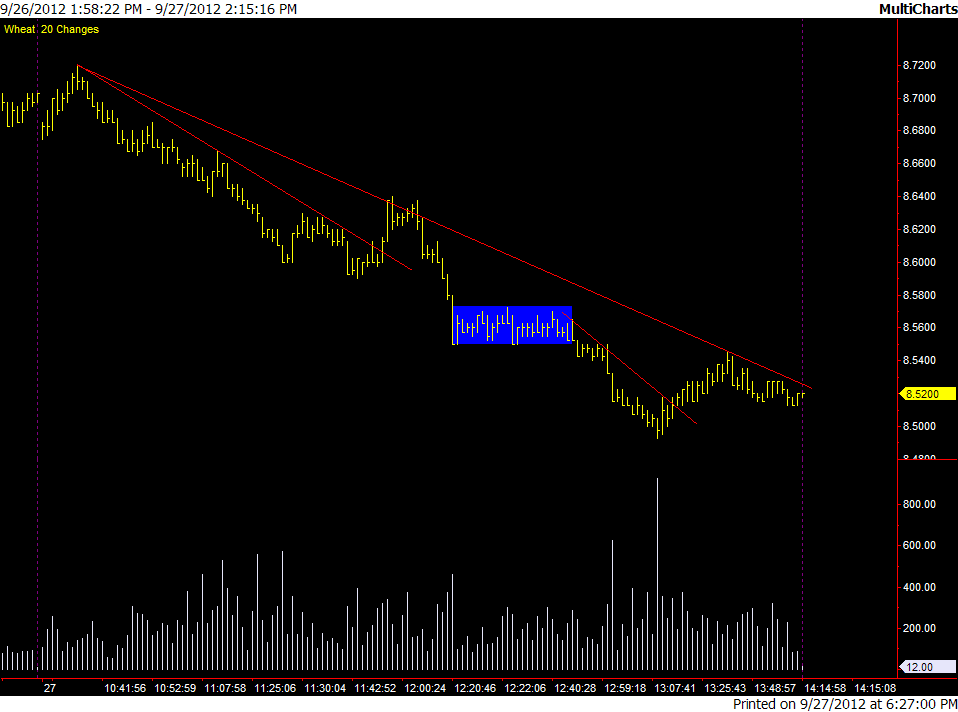
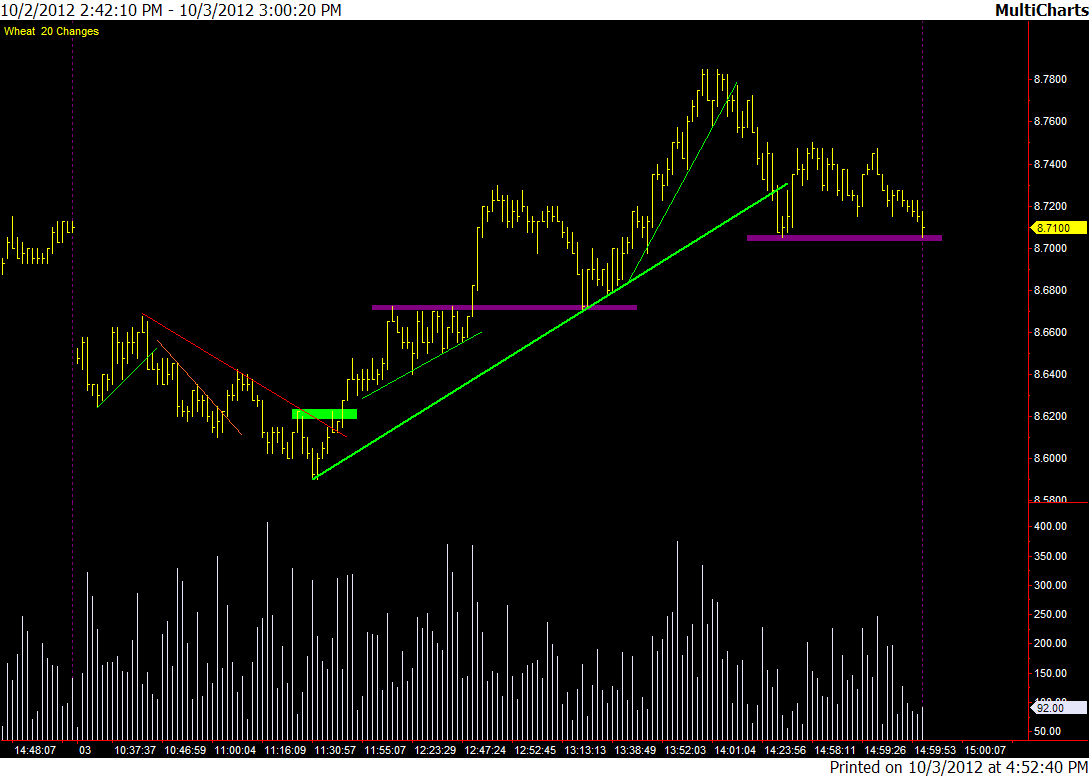
Chart 5 : 20 change / complete day
This chart shows just shows where the above took place in relation to how the remainder of the day played out. The lines have been transposed from my 15 sec shown and dont show everything I was thinking, my movement SL/DL lines etc.
As Db recently mentioned, it depends how involved one wants to be , but there were further opportunities for those who wanted to hang around, add etc.
Cheers


-
Though I've addressed this in the Trend thread, today is fresh in everyone's mind, and it seems like a good time to remind those who'd like to add another tool to their belts that S&R can be used with SLs and DLs to stay in the trade longer than one might if he were to use SLs and DLs alone.Yep... Working with SL/DL breaks together with S&R / swing H/L's etc is a balancing act for me and I do not have a definative "if / then" approach as to what is my "reason" to enter/exit based on the above will be.
Sometimes it will simply be a break of the SL, other times I want to see a HH etc.
When making these decisions in RT I acknowledge and accept my decisions will not always be optimal.
-
- First short below green line...Exit shown by red line. Higher High
- Re-entry short below 2nd green line....Exit shown by red line., break of swing high.
I was shorting here not far above the low of day.. Not always a place some traders like to play, but watching in real time having drifted sideways for 15 mins I felt there didn't seem like any desire to move higher, so felt an early entry as opposed to a more usual LOD break entry worthwhile.
The hindsight analysis tells me I "could've" taken a bit more from the market by just exiting at the break of supply lines, or waiting until higher swing points taken out but in Real Time I'm ok with the way things went.
-
I don't know if this is the correct place for this....but there may be a trade someone could, would or should take , so....
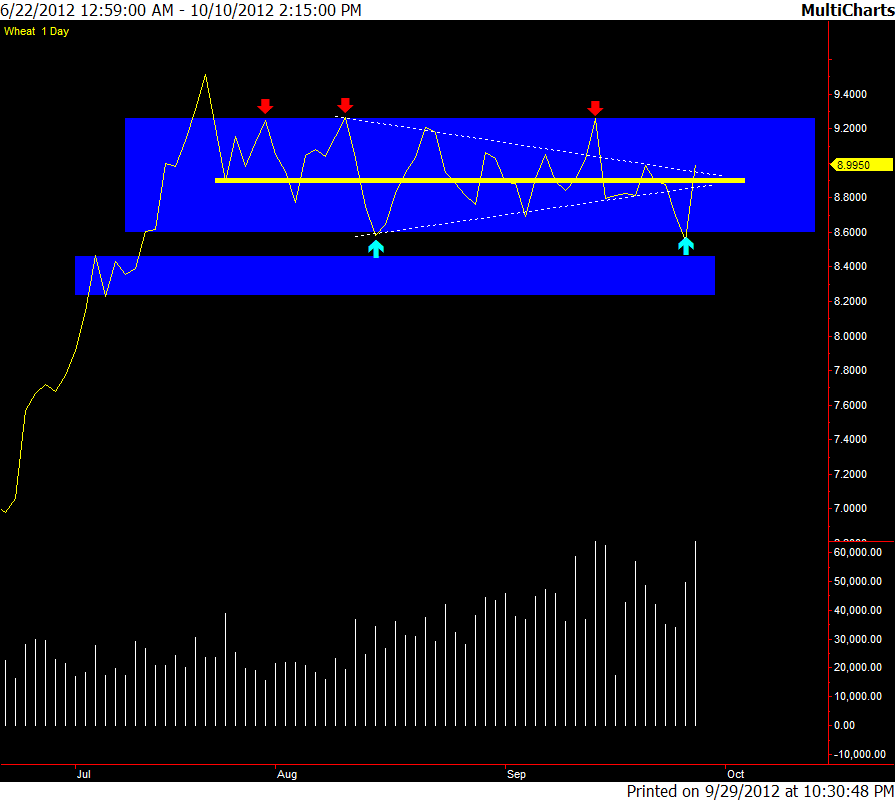
Chart 1:
Strip back the chart to a line on close.
Whilst the close doesn't have any significance for intraday, on a daily+ I do look at it, as the close is the point we finally end up after everyone who wants to, big or small has had an opportunity to have their say.
Using the line chart we can identify a large Trading Range. Within the range we have a hinge.
The hinge was firstly broken to the upside, hitting the TR high before immediately moving back to the low end of the hinge where it spent a few days before a just as sharp move to the downside and subsequent rejection of the lows to end just above the approx midpoint & top of (inner) hinge..
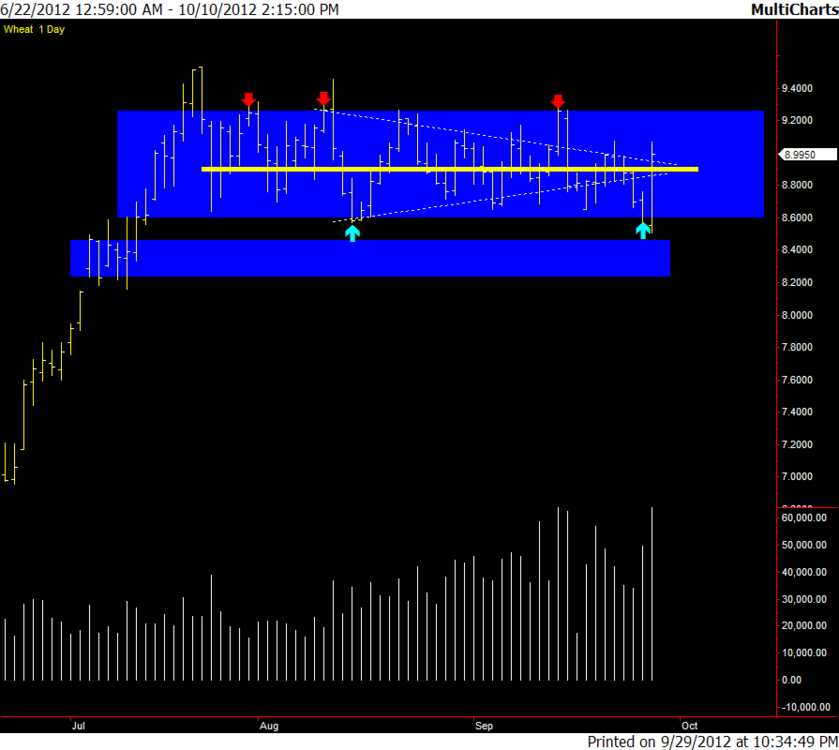
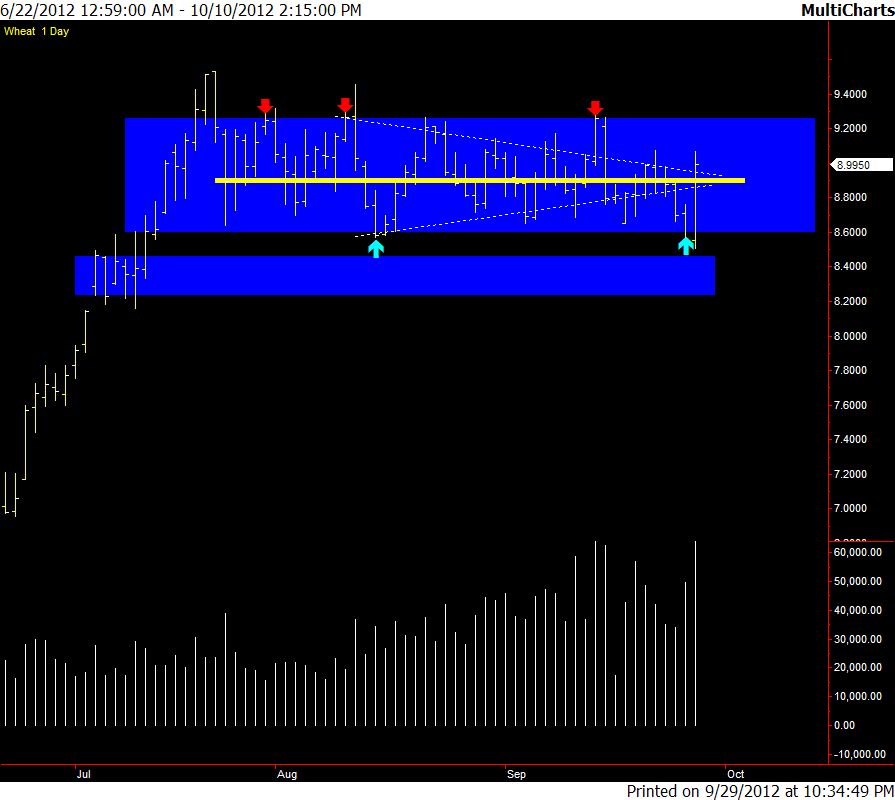
Chart 2:
When we change to a bar chart we can see the extremes & another few touches of the TR high.
(Although not marked, it looks like there is a smaller TR within the large TR: approx 8.7000 > 9.100)
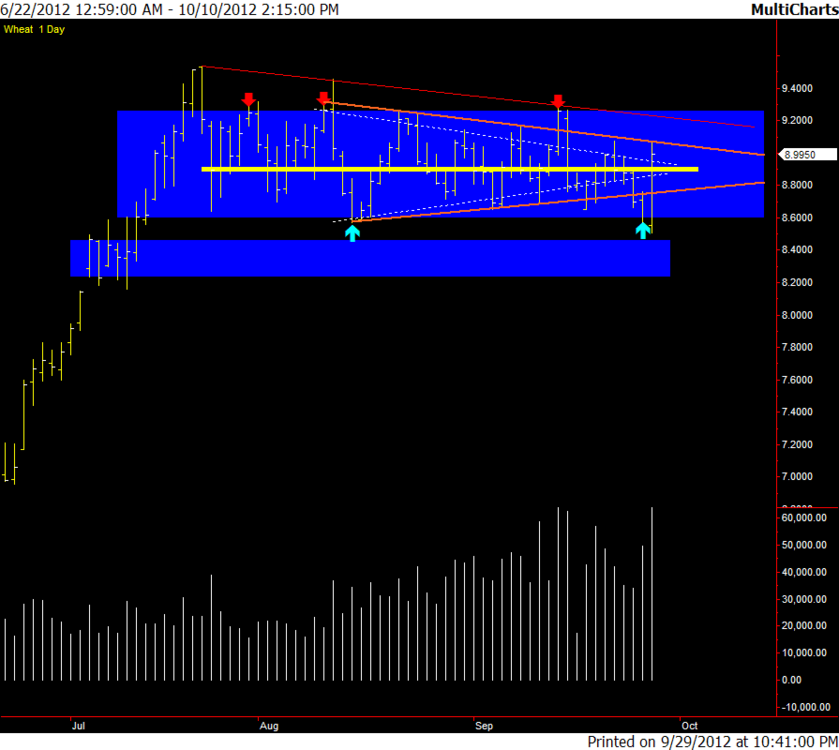
Chart 3 :
By adding (orange) lines at the extremes, we now have another hinge whilst the midpoint has stayed the same.
(Price has strayed out of the lower hinge line, but thats ok, it was fairly brief & they're just lines on a chart and have no magical power to make price do anything ;-) ).
I've also added a lower sloping (red) Trend line at the upper extremes.
So what scenarios do we have....
- Could already be short at the slight break of the low a couple of days ago, you could still be in, (although with a decent drawdown) if your SL is above the last swing high.
- Could already be long at the rejection of the lows, need to see it take out last swing high, break hinge to the upside.
- Could short here at upper hinge line with a tight SL above last swing high.
- Could buy break of hinge/swing High looking for test of TR high/TR line
The hinge demonstrates a coiling effect of pressure building, and as we have seen an excursion to both the upside and downside before rejection back into the TR. From here, as price moves through time, the hinge may be a spent force and we just drift either way within the range or a break may serve as a catalyst to exit the larger TR...we'll see
-
Not a film.......but...I love this, so..
Rare footage of legendary Bond Trader, Charlie DiFrancesca (Charlie D) giving a speech to new traders in 1989.
The talk is split into 12 parts
Note: You will likely have to turn your computer sound settings right up to hear.
Cheers
-
Open Outcry : Documentary about the pits
Cheers
-
Today: Look for reaction to see if move further down into "new" range or higher towards yesterdays breakdown point .
Move into lower range rejected. Back to mid point'ish of large trading range.
Took a small piece of a large pie today... Long above lowest red line, out on break of last demand line.
There were certainly opportunity to hold/add long positions.....but at least the golf if good

Cheers
-
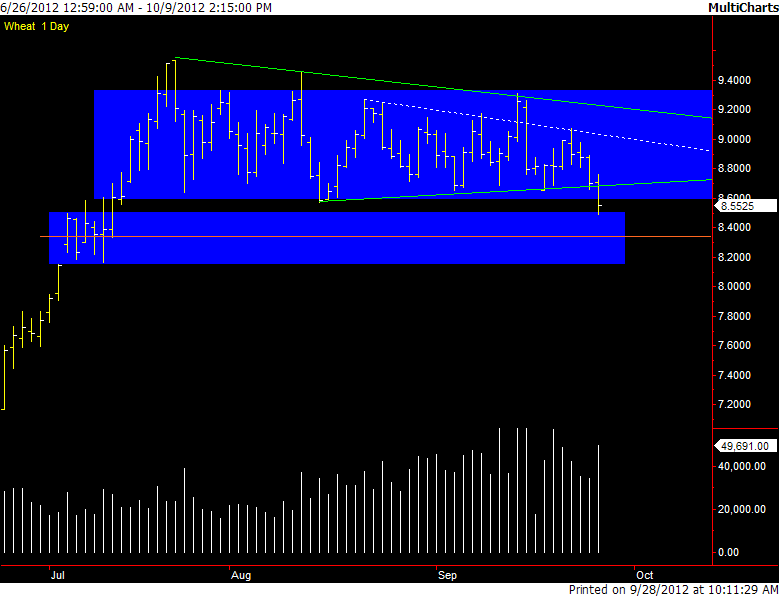
Daily
Price at top of small range
10 min / Overnight
Range for last few hrs of o/n session. Closed at prior day close.
Today: Look for reaction to see if move further down into "new" range or higher towards yesterdays breakdown point .
or more tempting may be just watch the Ryder Cup.
Cheers
-
Enron : The smartest guys in the room
Cheers
-
ok..time to join in...
Note: I've tried capturing my charts during the day. Some of the SL lines I've just watched visually rather than drawing on charts and have sometimes moved them.
One of the recently mentioned points that helped me stay on the right side today was just because price is near potential support don't just expect it to bounce.
Daily Chart:
(approx) Broad extremes of wide rading Range: 8.6000 / 9.6000
Price near low end of range. Poss Breakout ? of large "hinge".
- just mentioning above because as a daytrader not a reason in itself for me to get in
10 min / Overnight
Price tested prior day low. Last bar is "pit opening bar" heading back to approx mid of o/n upper range.
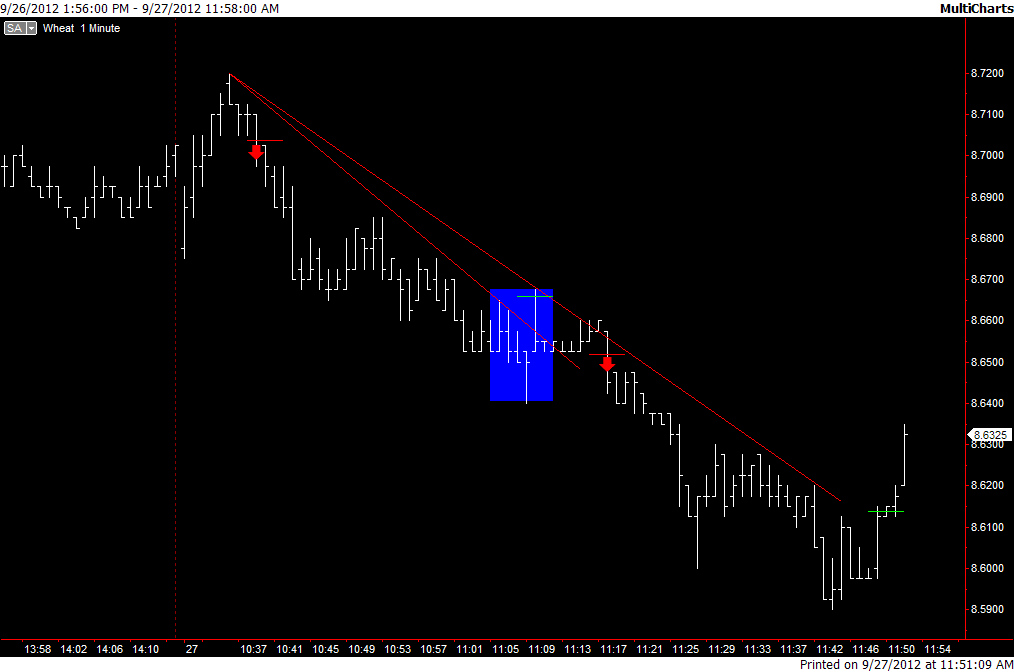
15 second chart
Price nicked the mid line. Broke demand line, Consolidation breaks = short.
1 Minute chart
I was "shaken out" in blue area at green line.Re entered short . Exit at break of supply line.
20 change chart
After break of supply line, attempt higher/HH before resumption lower. Price in sideways range before moved lower again.
Currently now at/near top of lower smaller range high lit on daily chart.
Wheat is same size tick/point as ES so pretty nice action & some smooth/decent opportunities either in 90 mins or for those who stayed (not me) around longer.
Cheers
-
Capital City -This was a UK TV series aired in 1989/90.
Fond memories of this one as I was just starting my banking career in London .. Watching this and reading Liars Poker convinced us we were all gonna be "Big Swinging D**** " in no time :rofl:
Anyone remember watching this series ?.....Was it aired overseas ?
One of the main actors, Douglas Hodge (Declan) was also in the tv drama
Dealers (1989) - which apparantly used the same dealing room set as Capital City
Cheers
-
Inside Job - Oscar Winning "Best Documentary" about the crash of 2007/09. narrated by Matt Damon
Too Big to Fail - dramatization about Lehman / crash / bailouts etc
Cheers
-
Ahhh... the ole days when 5 pip cable spreads...chain smoking in the room....and light brown trading desks were "in"...
Here's a video from the same era featuring the current NZ Prime Minister, John Key.
-
New album out today so thought a M & S song was appropriate...
<iframe width="560" height="315" src="http://www.youtube.com/embed/rGKfrgqWcv0" frameborder="0" allowfullscreen></iframe>
-
One of my favourite songs from a fav band of mine...
though I'm liking this version with Noel G ..
<iframe width="420" height="315" src="http://www.youtube.com/embed/H4b48Jx7Un0" frameborder="0" allowfullscreen></iframe>
Couldnt resist putting another one up...
-
....This thread is solely for educational purposes....
So every indicator, chart type , entry signal etc you mention or show in this thread is freely available for everyone who has a desire to be "educated" by you, correct.
You cant "educate" a class if you don't provide the "textbooks" for everyone.
-
Whilst addressed to SIUYA here's how I do it (or dont)...
I don't enter a trade using a R:R ratio...
.....when do you decide to move your stop to break even? ....I don't . If I see no reason to get out, then I want to stay in..Being taken out at breakeven just so I don't lose, whilst my reason for initially taking & remaining in a trade is still valid doesn't work for me.
... how do you define a High probability/low risk trade?I don't.... every trade has a risk and it will either win or lose...I do not label specific trades as having a "High/Low probability" or "high/low risk".
Cheers
-
I do not use a risk:reward ratio...
If I have a reason to enter, I want to enter and at this initial point I do not know where I will exit
Once I have entered a trade, every tick and trade thereafter will have some consequence on the market outside of my control....therefore
My job is to stay in until I see a "reason" to get out...That "reason" may come 1 tick..10 ticks...100 ticks, whatever, after I have entered.
-
...... However, pull up a chart of the ES contract, and compare the volume with SPY. You will notice non-negligible differences in traded volume on some days, or some parts of the day.....Beware the ETF trap..?
"..While the price of an ETF closely tracks the underlying index's value, the volume of an ETF only reflects the popularity of the ETF itself - NOT THE SUPPLY OR DEMAND FOR THE THING THE ETF TRACKS...(authors Capitals)"
From here...
BEWARE THE "ETF" TRAP - ChartWatchers - StockCharts.com Blogs
Cheers...
-
First - thanks to everyone who took the time to help me.I do hear what you are all saying - and grasp most of it – set your stop when your trade entry / logic is invalidated, stops are set as a result of testing, probabilities, the risk level one is willing to absorb, etc.
But you may think I do not get it - after you read this.
1. While it may not be realistic, as a relative newcomer, I am seeking some black and white rules that take the anxiety out of my trading.
2. I may be able to answer my own question (through your wisdom provided thus far) that if i cannot stomach or my account cannot tolerate too much risk, than i simply set my stops tighter knowing that I will be stopped out more often miss out on bigger run-ups and yet avoid larger losses. Maybe this is all that simple.
3. But if it is that simple, why are there supposedly credible professional trading tutors out there who prescribe two opposite but absolute stop placement rules?
a. - "Exit as soon as the trade goes against you and if the trade does not go in your favor within the first few seconds of the trade on the M5". and the opposite...
b. Place your stop at the bottom line of the channel or approx 2 x ATR - which results in a far greater draw-down per trade and far greater risk.
Here's my lack of understanding - and I'll give you what I hope is a simple picture using just a sample setup. Please see the attachment.
- In using a simple price action channel, one would enter at the arrow, when price just passes the upper channel line.
- Using some of the logic I read, a stop theoretically should be placed just below that line as this is where the trade logic has gone wrong.
- After all, if price goes below where I entered, and i would not have entered there in the first place, then that's where my stop goes.
- And if get stopped out there as I would have in my diagram, I missed out on the big run up later.
So the "but" is that price may drop and fluctuate a bit - needing "room to develop" in side that channel before it finally picks up and goes profitable. And if in fact I set my stop much farther out, at the bottom of the second channel line, I stand to get stopped out with a much greater loss - at a point only 6 candles further into the trade (the Hammer just before the next red candle).
So - at the sake of being redundant - sorry - why not do as some professional trading tutors firmly advise and exit if the trade does not go in my favor within the first few seconds of the trade (on the M5) - trading off a larger loss with more frequent smaller losses? Some professional tutors also say to place a stop at the bottom of the second candle back.
To which you can say - you have to back test this to determine if that makes sense.
Is this the real only answer?
I apologize if I am just wasting everyone’s time. Maybe I need a vacation. I may be missing the point and not getting anything. I hope you can follow what i am saying. Thank you very much, again, for your time and help.
If I just note some points on your chart as to what has happened...
- The market makes a low (1st green candle) (Point A)
- Market moves up and makes a high (Point B)
- Retraces about 50/55%(eyeballing it) and makes a higher low (low of Green candle) (Point C)
- Market moves higher, above point B (D), - you enter
A common method of determining wether price will continue in a direction is looking at the swing high/low sequence...If its making HH..HL..HH...HL etc, someones assumption may be that it will continue to do so, until the sequence is invalidated.
If using this "structure" point of view, the sequence of Low (A)..High (B)..Higher Low ©...Higher High (D) would be broken and invalidated below point C, therefore the stop would be just below Point C, as that is were this "trade logic" has gone wrong ,
(If your logic is based on price touching channel lines for entry/exits I cant comment as I don't subscribe to the same "trade logic" re channels to base a trade decision on).
Only you can decide if this size stop is to rich, depending on where you anticipate the market going, how often/likely you expect it to happen etc.
Having a larger stop does not necessarily mean "greater drawdowns" or increased "risk"
With the caveat that this is hindsight analysis (of which everyone is an expert) and without much market background ..Once in the trade at your entry point, after the trade developed a stop could have been moved up below the green candle (2 candles after entry) or below the green "hammer" (5 candles after entry)..(A break above the hammer could have been an adding point) ...
Whilst this hindsight analysis shows the above, or even just leaving a stop at the initial point C would have "worked".. they are just ideas to think about as the market develops and next time, when trading on the right edge, this approach could just as easily "fail"
Trade Well..
-
... It is their (learned or inherent, I don't know) detachment or dispassion that allows them to "see" the market in such a way that they are able to extract from the markets....
Being able to "see" the market will not put 1$ in someones account....It is the ability to "act" that causes extraction.
Trade Well...
-
I will be cuttung down on my posts since I really do question what I posts has value as a learning tool....
Tom
I think the way you are currently posting is fine.. (Yours, Josh, Neg8r posts are some of the most useful here)
Posting thoughts, rationale, ideas, trades (if you want to) as the market is developing is far more interesting & beneficial than posting a chart with a couple of green arrows way after the event saying...."I bought here.."..

Your primary responsability is to yourself, so going forward post what & how You are comfortable with
Trade Well....


Trading The Wyckoff Way
in The Wyckoff Forum
Posted
Whilst I didnt trade NQ today, I did have a few thoughts for review from a CWS perspective whilst following....Missed some things and saw some things.
Trading Range extremes at approx 2682 > 2657
Mid point at approx 2670
1...Missed seeing the the move originating from the mid point to support.
2...Saw a "hinge at support.
3...Saw the LH top on tick chart at mid point....CWS exit a long from 2 & CWS have looked for short for move back to S.
4...Saw previous S acting as R
5...CWS have looked for short on rejection of 4