
Welcome to the new Traders Laboratory! Please bear with us as we finish the migration over the next few days. If you find any issues, want to leave feedback, get in touch with us, or offer suggestions please post to the Support forum here.


ake
-
Content Count
32 -
Joined
-
Last visited
Posts posted by ake
-
-
Just curious Is what timeframe the chart is and what instrument ? The ma is 20 ema?tIt's a 1m EUR/USD spot chart, for yesterday, with a 34EMA.
Here's another setup, from just a few minutes ago, same instrument and EMA.
-
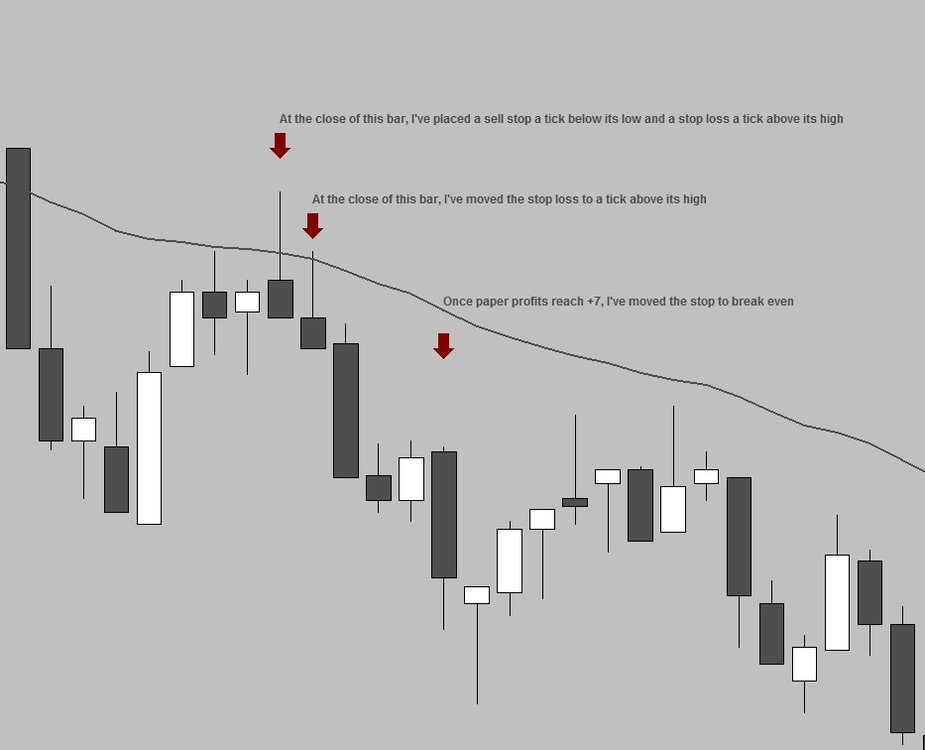
Thanks for this. The picture below shows where I place the stop initially and how I tighten it up until it gets to break even.Back testing appears to support the view that leaving the stop a tick below the low of the hammer, untouched, results is more profitable trades and less break even ones.
What's your view on this? Thanks!
Apologies, here's the picture!
-
Thanks for this. The picture below shows where I place the stop initially and how I tighten it up until it gets to break even.
Back testing appears to support the view that leaving the stop a tick below the low of the hammer, untouched, results is more profitable trades and less break even ones.
What's your view on this? Thanks!
-
i find the 1 minute chart slightly daunting due the large amount setups off the ema.You may want to consider taking only trades where the candlestick pattern is a hammer that has pierced the EMA. That's going to limit the number of signals you'll get during the day to about 2 or 3 in the 1m DAX and another 2 or 3 (on average) in the 1m EUR.
-
On the Dax do you use the 100ema like JMC?No, I use a 34EMA, which I'm still testing. General impressions so far is that I would probably be better off going back to the 20EMA and the 50SMA. There's more opportunity, although the moves aren't as great as the moves off the 34EMA.
From a risk/reward perspective, the 34EMA is perhaps better but only if you do stick to your target. If you don't, --and I do have trouble with that--, you'd be (and I'd be) better off going for slightly smaller but more frequent moves off the 20EMA.
-
IMO this makes or breaks this (or any system).Stop placements:
1) Classic candlestick analysis would say one tick above the high or below the low of the entry candle.2) Use previous support/resistance.3) Fixed number.Entering long with a stop, I've been placing my initial stop a tick below the low of the signal (candlestick pattern) candle, then, upon the close of the entry candle (which drags me into the market), I tightened the stop to a tick below the entry candle.
So far my impression is that this is unnecessary and would be easier, faster and less error-prone in a one minute timeframe to put the stop directly a tick below the low of the entry bar.
What's your experience? Any advice on this? Thanks in advance!
-
Its slightly off topic but what do most traders here do when there waiting for a setup. Especially those who trade 5 minute and upwards. I find it extremely difficult to maintain concentration when the first setup on a 15/30 minute may not be for hours into the day.I've also found that because i have waited so long for that touch of the ema, it is difficult to say no to a candlestick that is weak, a market that is losing its momentum, etc. The trade you just look at after and know that was a crap setup.
Any advice or is this something i'll learn the hard way
If you ask your platform to alert you when price touches the moving average you might be able to trade multiple instruments in 5m or higher.
Alternatively, you can trade off a 3m or 1m chart (or charts). I found that trading off a 5m chart isn't suitable for my temperament. I need more action that it provides, so I started trading off a 1m chart. At first I found it challenging, but got used to it and, months later, I settled for 2 instruments in 1m (EUR and DAX). That helps me keep focus and not get bored.
-
am a little hesitant to put on a "with trend" trade towards the end of move.Pat, a quick tip.
There was a time when I needed hard rules to determine if the current move is coming to an end. What helped me is this: if the last leg of the move is shorter than the previous one, momentum is slowing down.
-
I've always entered on a stop - reasons being:1) You guarantee to fill all your winners
2) You guarantee to not fill some losers (no fills)
In contrast, a limit order works as follows:
1) You guarantee to fill all your losers
2) You guarantee to fill some of your winners
And when you break it down like JMC does on a 1 minute chart, you aren't 'sacrificing' much for that extra confirmation. On a daily those no-fills can be huge. The catch being you are paying for that extra confirmation and you will get tick-in's that will frustrate you.
Very good points.
Katz and McCormick's research shows that a limit order appears to work best when entering with the trend, immediately after a moving average crossover. Again, this needs to be taken with a grain of salt (by discretionary traders) because their test was, naturally, automated.
Of the two entry strategies (with-trend at the MA crossover and countertrend when price bounces off an MA), tested with both limit and stop entries, they concluded that entering with a stop when price bounces off a MA was the best performing.
This appears to confirm the outcome of my rather more modest (and discretionary) efforts to test this entry.
The book admits that the way the tests were carried out was a bit rudimentary and a more sophisticated entry (candlesticks?) could improve results further.
-
I've come across two books that discuss this pattern from different angles.
The first is "Winning the trading game", by Noble Drakoln, 2008. Drakoln says he uses the 9EMA, the 20SMA and the 50SMA to trade off a daily chart. When price pulls back to any of these levels, he waits for two to four bars for an appropriate candlestick to setup, then enters the market "immediately". He discusses other ways of trading the moving averages as well.
The other one is "The encyclopedia of trading strategies", by Katz and McCormick, 2000, where the authors focus on automated testing of entries when price bounces off moving averages on daily charts. Take this with a grain of salt, but the outcome of their research is that, in sample, the optimal entry is with a stop. Out-of-sample, the limit order performed best.
There is a considerable amount of detail in this book, which lends credence to the author's research. As an explanation of why a stop entry performs better in their tests, they speculate that optimal entries appear to have both a counter-trend element (entering against the pullback) and a with-trend element (entering with a stop).
-
Obviously, you could increase your winning percentage by waiting for some type of confirmation (ie. candlestick pattern). But, of course, you get the tradeoff of taking more intial risk, i.e. larger intial stop loss..Thanks for this, JMC. I've been trying out recently entering with a limit order, with a stop order a tick above the high or a reversal candlestick and at market at the close of a reversal candlestick.
I can't comment on the last one because I'm still "forward testing" it. However, in regards to the first two, I've found that the optimal way to manage the trade immediately after entering is around these lines:
1. Upon entering long with a limit order, tighten the stop to a tick below the newly formed low as the market starts to move in favour of the trade
2. Upon entering with a buy stop order, tighten the stop loss to a tick below the entry bar at its close
I've found that although, as you mentioned, the risk initially is higher entering with a stop, the average loss is smaller if the stop loss is tightened as above.
-
I find this extreme difficult to do however from backtesting it seems to produce the best results.More frequently than not, I get stopped out on my way to the target, with a profit about twice the risk.
Because of this, the rationale behind how I set the target as well as its accuracy may not be as relevant as I'd like to think. Any arbitrary target will probably do, provided that it is far enough, we protect profits on the way there and the win/loss ratio adds up.
Sometimes I find it easier to stick to the target when I'm not sure if that particular support or resistance level is accurately drawn.
This may be because I stop thinking that the rationale for the target is correct and price should be attracted to it. I just accept that I may get stopped out for a profit and I'm less likely to exit at market. Sometimes these are my most profitable trades.
-
BB - what do you think of the 2nd arrow? It got through the EMA but gave an inv hammer. Would you consider a short there or no b/c it busted the EMA?For whatever that's worth, I've recently back tested this in the EUR/USD and the DAX.
The outcome is that the probability of success appears to be marginally lower but the potential profits wouldn't be, on average, different from trades where the entire body of the signal bar is below the EMA.
This wouldn't deter me from taking these trades. However, I don't take them because they add a degree of ambiguity: how far above the EMA is OK?
I find it easier and less stressful to look for the simpler, "clean" version of the setup --the signal bar opens below the EMA, pierces it and closes below it.
-
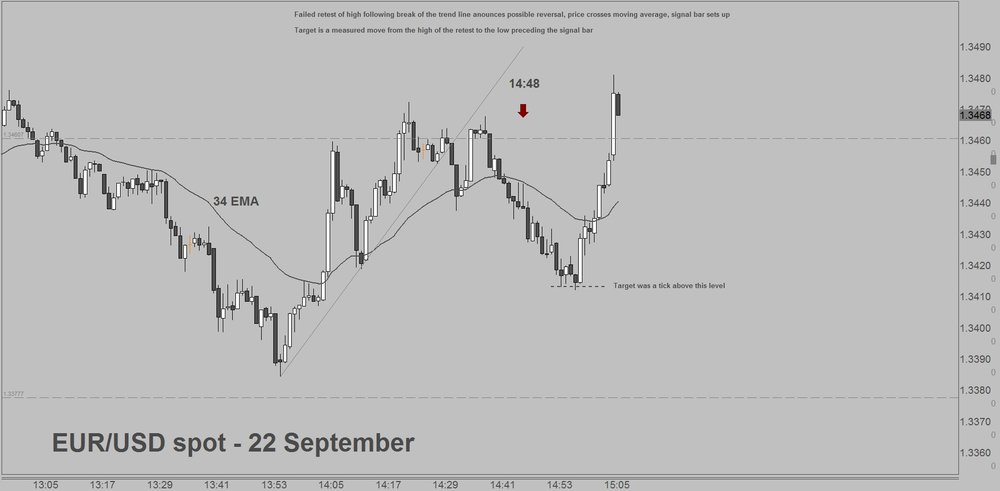
From peoples perspectives and experience do you think a fixed target or trailing stop is better? I can't see how a fixed target can work when volitilty and conditions are always changing. Iam trying to trail behind candles that go in my favour but having varying success.If I catch an intraday trend reversal (failed retest of a high or low after the break of a trend line) I'm more likely to trail the stop. If I entered on a pullback to the EMA I use a fixed target.
For fixed targets I use horizontal lines of support or resistance, which I draw in a one hour chart by loading 3 months worth of one hour data, zooming out until I can barely tell a bar from the next and identifying trading ranges that turned into reversal points. Then I draw a horizontal line, sometimes on the higher boundaries, sometimes on the lower ones, depending on how price behaved around that price on different days.
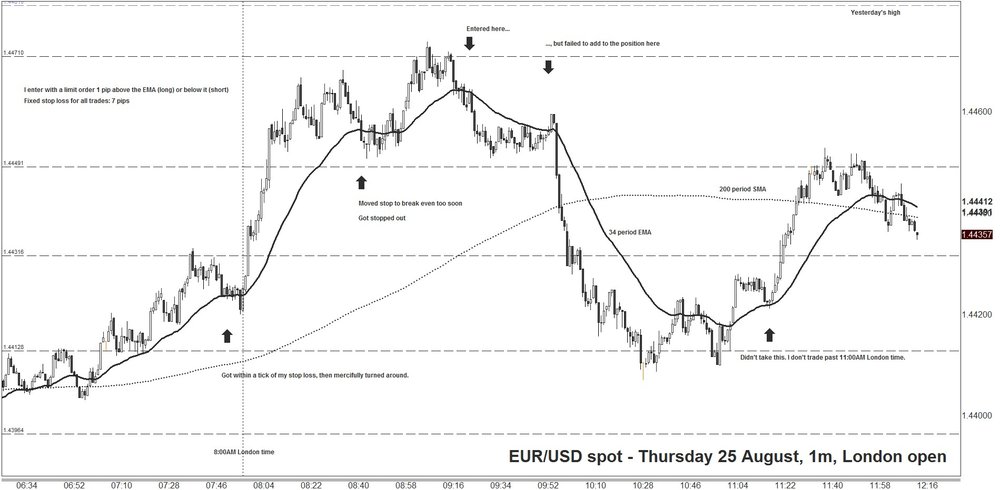
I place a limit order to take profits at the first horizontal support or resistance line that is more than three times the size of the risk away. In the EUR/USD 1m with a 34EMA this is generally between 30 and 40 points, with a risk of 7 points. In the DAX 1m is about 20 points with a risk of 5 or 6 points.
I protect profits as price moves towards my target. I move the stop to break even once price has moved in my favour the size of the initial risk, and I move the stop to protect profits about the size of the initial risk once paper profits are twice that.
I have found that my returns are better when I stick religiously to the target and don't get out early because I thought I saw a loss of momentum.
-
More likely, he uses it because many people do--it's the 8th number in the fibonacci series: 1,2,3,5,8,13,21,34,55. It's why you see 89 tick charts, or 233 tick charts, and so on.Thanks for this, Josh. I actually didn't know it was a number if the Fibonacci series. A friend of mine trades oil here in London for BP and he uses the 34 EMA. I tried it out and seems to fit the EUR/USD well in 1m.
I personally don't think it would make any difference to trade the 34, 35 or 36. The difference is minimal most of the time and it would probably not make a difference to the size of the stop loss I use.
-
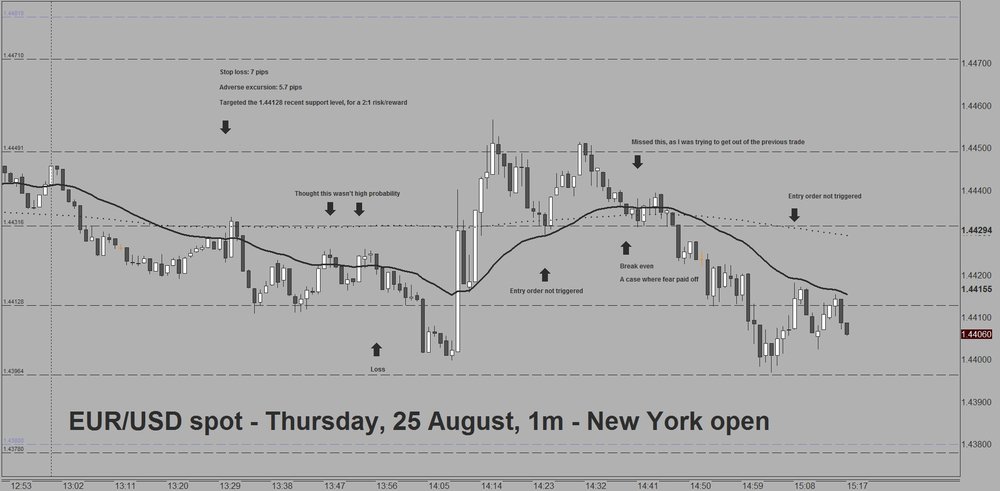
Afternoon trades, EUR/USD spot, 1m.
-
34EMA seems like an unusual number. How did you come up with that?Also, where did you close out your trades? Do you have fixed profit targets?
I got used to trading the 20 and the 50 EMA. 34 is about mid way between them, so you can catch the action of both and is simpler to have a single EMA.
I put a limit order to exit at the next level of recent support or resistance and let the trade run until I got a profit of about 20 pips (3 times larger than the risk), then I start looking for signs of weakness. Not very original, I'm afraid.
I do leave profits on the table. I exited the short trade this morning at market at +23 pips because volatility started to contract and there was a pause in the move. I later realised, looking at the big picture in 1m, that I exited just as the market was breaking the neckline of a massive head and shoulders pattern. The move was bound to go much further, but I didn't see it at the time.

-
This morning's trades. EUR/USD spot, 1m, 34EMA.
-
4. Use a larger period for the EMA (50, 100?)
5. Take only trades where there's no support or resistance (trend lines, pivot levels, 200 SMA, yesterday's high / low) between the entry point and the target
-
I've found nothing to be a filter apart from personal experience of watching good and bad setups.Ideas for filters, Phoenix.
1. Take only the signals where there is a confluence of support (for longs) or resistance (for shorts) areas. For example, if price is bouncing off the EMA AND yesterday's low, or any pivot level or a trend line
2. Take only the signals that follow an A-B-C up or down. Notice that this won't stop you from taking trend reversals. In many cases the reaction that follows the highest high in a trend is made up of an A-B-C and the B correction happens before the crossing of the EMA
3. Take only long trades if price is above the EMA in the higher timeframe
-
Also should be noted I got runover (- .20) buying the pullback at 9:30am. Starting to favor Brownsfan's recommendation of briefly waiting to see how price reacts to the EMA before jumping in.JMC, do you use volume? and do you use the Bollinger Bands for targets or for entries in range bound days?
Thanks!
-
Would it make sense to split the axioms by type of technical trading?
I imagine that there may be different axioms for swing trading off daily charts than for intraday 'swing' trading (riding pullbacks and rallies), intraday momentum (going for a single leg or momentum move up or down), or scalping / order flow trading.
-
You don't know it's a climax until it reverses and verifies that it's a climax.By climax I only mean a large range expansion bar or two. Discretion plays a role in determining whether a large range expansion close to the target is enough reason to exit, naturally.
-
Exits.
I prefer to enter long with a buy stop a tick above the signal bar and place my stop loss a tick below the low of the entry bar.
I like to target a 'measured move'. In an uptrend, if the swing point at the EMA is C, and the swing that starts the retracement is B, I place a limit order to take profits at a distance equal to that between A to B, that is, the length of the last leg of the trend.
I exit at market if there is a price climax on the way to my target.
Any other ideas for exits?


Should a NON-taxpayer Be Allowed to Vote?
in General Discussion
Posted
Interesting question. This is a public policy debate.
Same question, but from a personal ethics viewpoint could be:
"Should someone who pays no federal income tax vote?"