
Welcome to the new Traders Laboratory! Please bear with us as we finish the migration over the next few days. If you find any issues, want to leave feedback, get in touch with us, or offer suggestions please post to the Support forum here.


BigAl
-
Content Count
10 -
Joined
-
Last visited
Posts posted by BigAl
-
-
Hello Fellow Traders,10575 - 10548 = 27 points
27 Points x $5.00 per point = $135.00
10 Contracts x $135.00 = $1350.00
Carlton
Hey, Carlton.
Here is how I reduce risk. It has worked very well for me for several years now.
I use scaling out to reduce risk. I set my 1st target or half my position at 10 ticks. It is the magic number for me. Not the holy grail but works a high percentage of the time. This gives me a break even cushion and reduced the % of my loses.
From your scenario above:
Your trade earned 270 ticks
Scaling out:
5 contacts x 10 ticks = 50 ticks
5 contracts x 27 ticks = 135 ticks
Scaling out earned 185 tick but it reduced the risk from 100% to 0% once you've captured the 1st 10 ticks. It's nothing new. Scaling has been around for a very long time because is lowers the overall risk to your portfolio.
Trade Well!
BigAl
-
What methods are you using for 70% profitable?Thanks
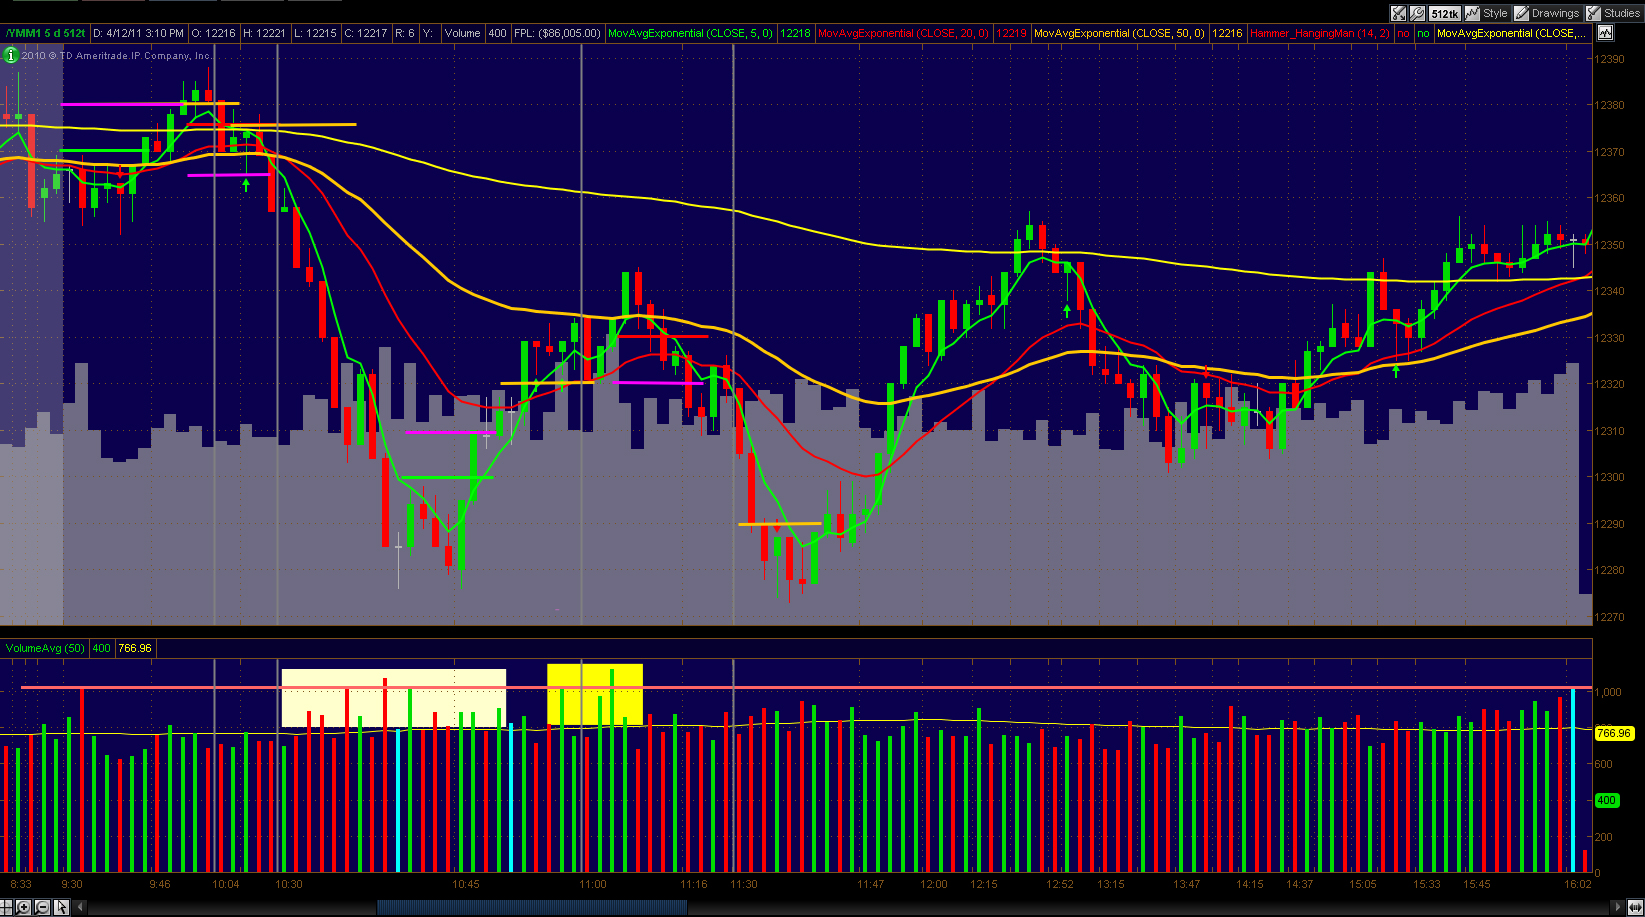
I trade the reversals of the morning time zones of 10:00, 10:30, 11:00, 11:30
12:00 and 12:30. I use volume spikes and 512 tick bars for the YM. The closer the spike is to the time zone the better the signal. Watch the market internals. The weekly open, overnight open/high/low, that day's open and previous day's high/low. Candlestick formations and patterns and Market Profile Value High/Value Low.
The key is getting 10 tick at the 1st target. Much higher percentage than trying for 15 or 20 ticks.
See the image below.
Trade Well,
BigAl
-
For me I always trade in multiples of 2. Either 2, 4 6, 8 or 10 cars.
I take 1/2 of the position at my 1st target. 10 ticks for YM, 4 for ES, 12 for NQ and 5 TF.
Place the pstop with the ticks gained (from breakeven to risking 50%) from the 1st target and let the 2nd target trade. In fast moving or ranged bound markets, I'll play it fairly tight.
I average about 70% profitable, 20% breakeven and 10% non-profitable
Trade Well!
BigAl
-
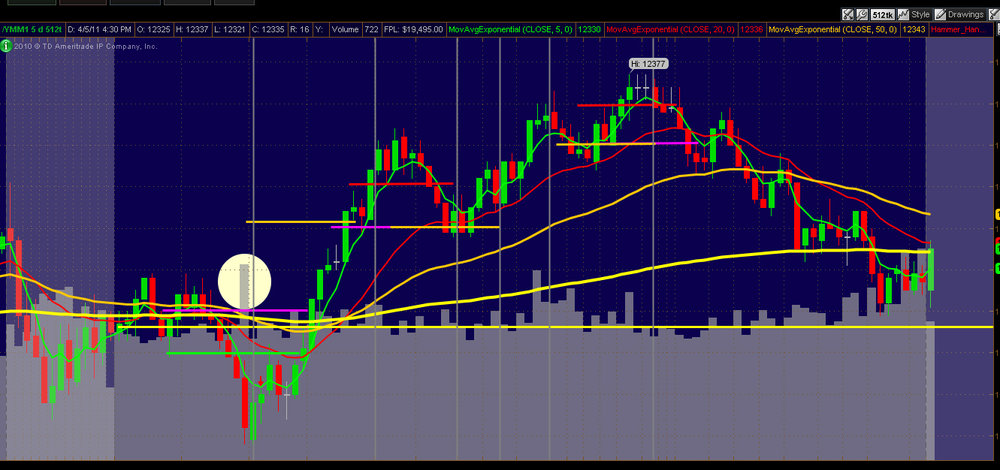
I use volume spikes at the morning time zones of 10:00, 10:30. 11:00, 11:30
12:00 and 12:30 to indicate market reversals.
See the image below.
Trade Well,
BigAl
-
Good Morning joshdance.
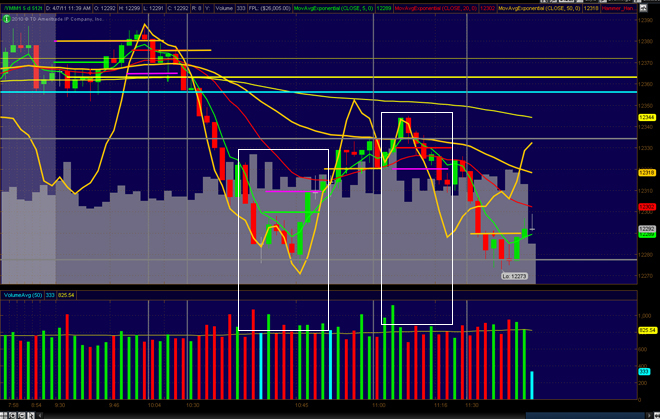
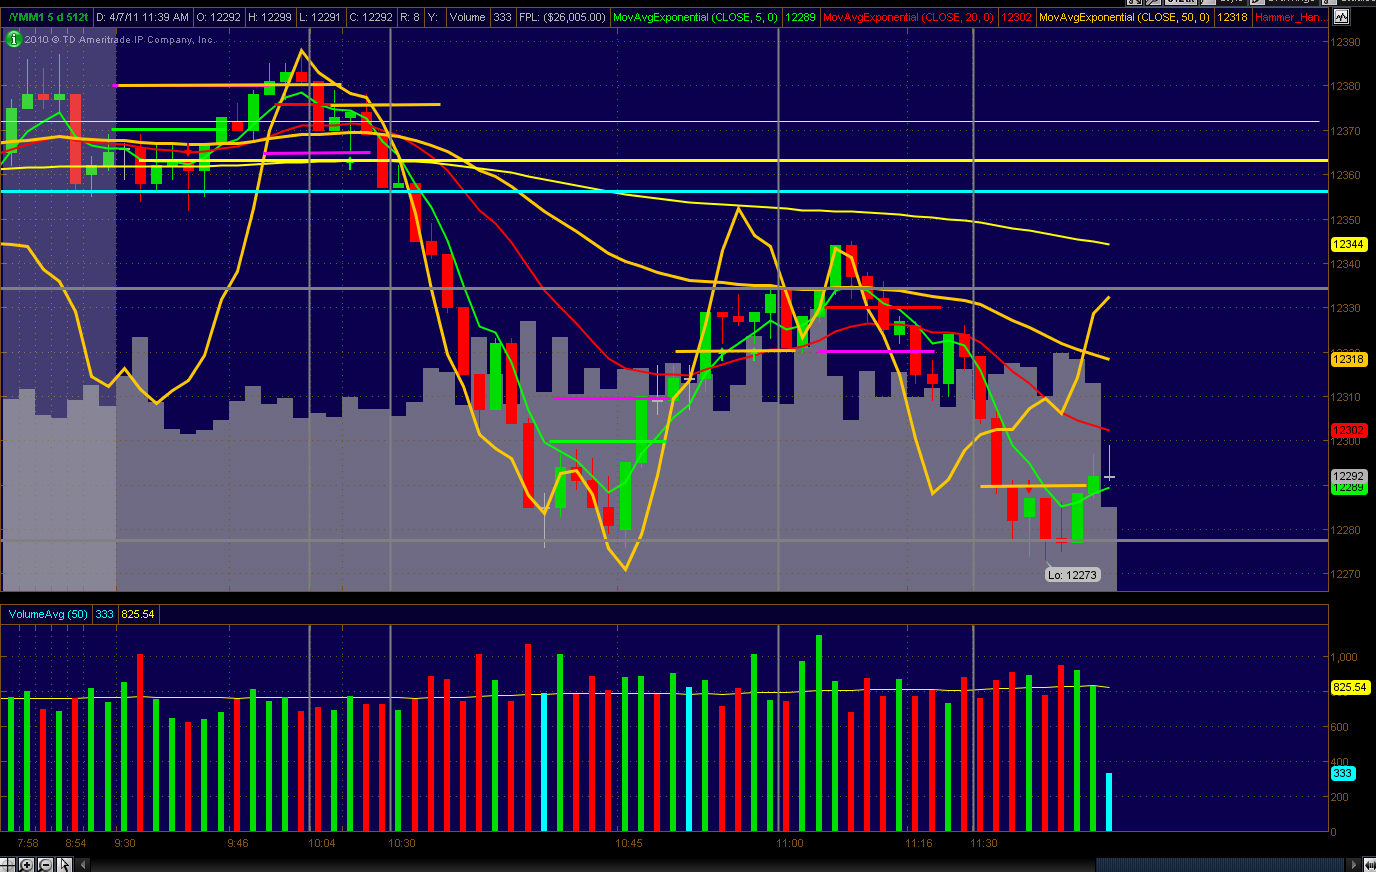
Click on the image below to see how I used volume to trade the YM yesterday (4/07).
The thick gold line in the upper chart is the Volume Flow Indicator. The lower chart is the Volume Avg.
Look how the volume spiked higher, over the volume average on a few bars before each reversal. Even after the markets dropped on the news of another earthquake in Japan, the volume indicated the reaction to the news was over or at least lost some momentum.
Traded Well!
BigAl

-
Thanks BigAl,So if this were not a reversal but instead a continuation move, would you look for less volume here, more volume, or it depends on the follow through for the move? Basically, I'm looking at how to interpret volume here at these edges (like the low/high of the day,e tc.).
What I look for is a spike in volume at or near my time zones. Then look for lower volume on the next few bars. I place my entry just above the high of the larger volume bar to buy and just below the low to sell. Spikes create better entry signal, but they don't always precede at reversal. If long (at 10:00) I look for volume spikes at or near (10:30) the next time zone to exit. Of course there are the market internals, candlestick and Market Profile formations and patterns that guide my entries and exits.
Oops! The market's open. Trade Well!
BigAl
-
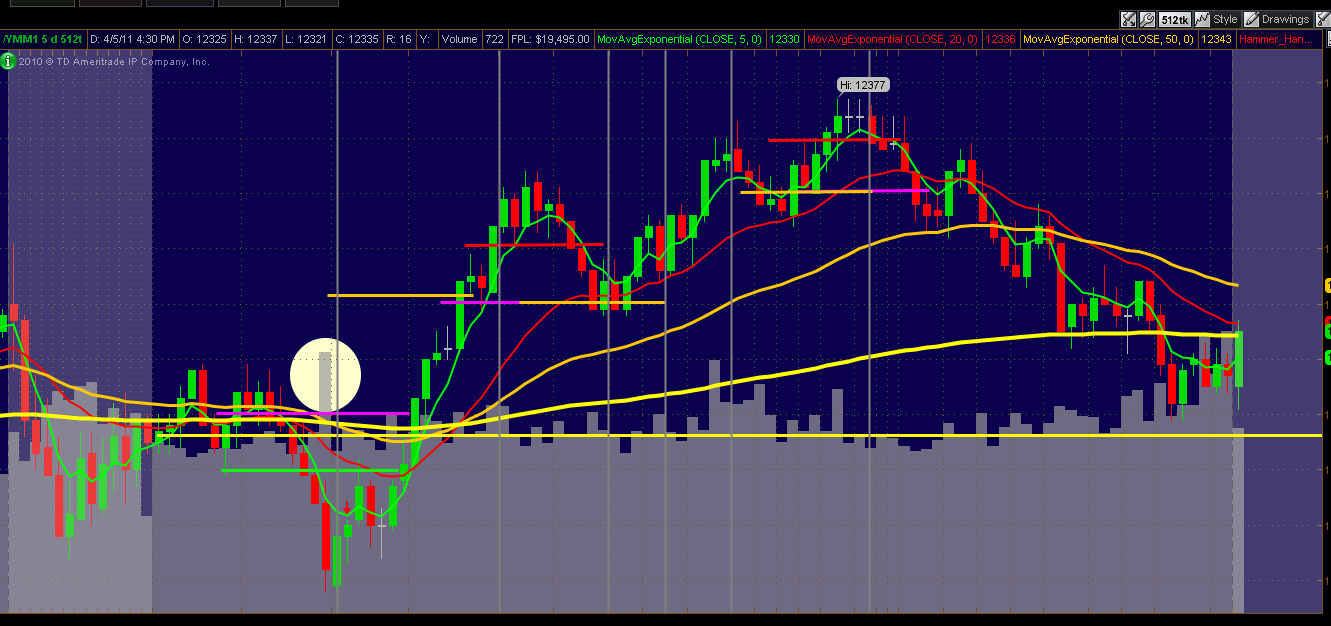
Hi BigAl, may I ask two follow up questions that I've been meaning to ask someone who knows?1) Is there an advantage to you trading correlated markets, as NQ,YM,TF, and ES are all so closely related? Is it due to volume you're trading or some other reason?
2) On your chart the big volume bar indicated a reversal from the low. In your experience what volume would have indicated a continuation? In other words, what constitutes a good reversal signal here versus continuation?
1. Yes, these four indices move in step with each other. Just look at identical time frames for each and you will see the relationship. Now, the important part is that they are not always in sync. That's what I look for. A few years ago the NQ was the market leader and it still can be at times. The Russell 2000 is the new kid on the block and tends to show strength or weakness earlier than the others. I look for the index that is showing the strongest trend in either direction and trade that index. I also watch the market leader for the day to see if it will push (higher) or pull (lower) the other markets.
2. It's not the amount of volume, it was that the volume was significantly greater than the previous red bars during the sell off. Average volume for the YM on 512 tick bars are between 650-750. That bar was 1020.
Remember, It does not matter what the market does, it only matters what you do!
Trade Well!
BigAl
-
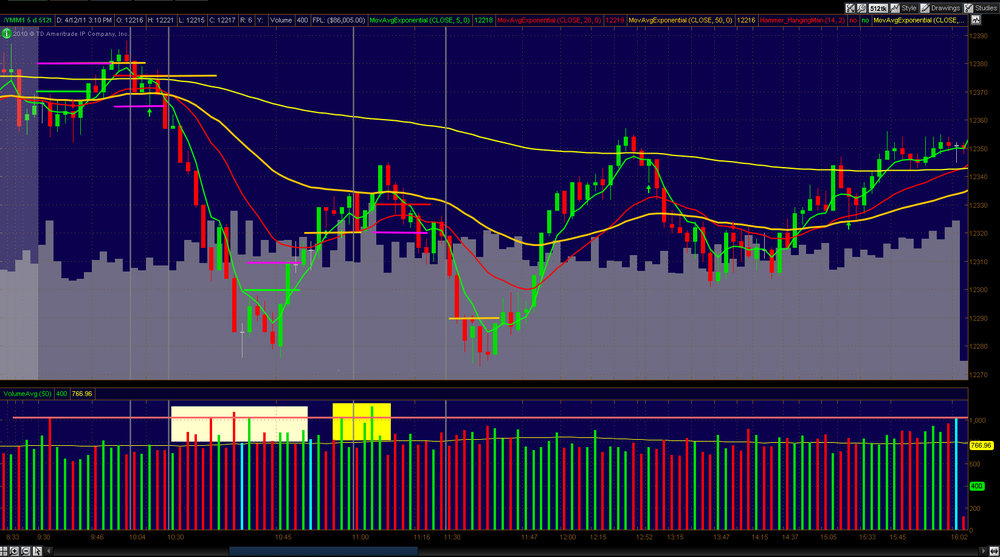
Here is today's trading of the YMM1
The gray vertical bars are time zones.
Green horizontal bars are Buy entries
Red horizontal bar are Sell entries.
Magenta horizontal bars are 1st target (1/2 the position)
Gold horizontal bars are 2nd target and pstops (closing position 2nd 1/2)
Gold and Magenta bars together means closing out the position
As Phil-n-Texas, I use tick bars. 512 for the YM. I have found showing the volume
on the upper subgraph very useful for indicating the turns at the morning time zones.
Notice the yellow circle over the volume spike on the 9:57 bar.
This was my indicator to Buy.
10:00 good for 10 points 1st half and 30 for the 2nd. Total 40 ticks
10:30 (actual 10:48) good for total 20 ticks
1:30 good for total 20 ticks
Normally I don't trade the afternoon session but I was home and took a shot. From the results it looks like a played the last way too tight.
Remember, It does not matter what the market does, it only matters what you do.
The only leading indicator is...........You!
Always, Trade Well
BigAl
-
Hey, Firm Biz and other members.
My trading system is very simple:
Use Price, Volume and Time
Market Internals
Basic Candlestick formations and patterns
No mathematical indicators.
Day trade the YM, ES, NQ and TF
Use volume to indicate if market will reverse (or continue) at six time zones in the morning. 10:00 (after the news/report) - 10:30 - 11:00 - 11:30 - 12:00 - 12:30
Remember, I does not matter what the market does, it only matters what you do!
There is only one leading indicator..........You!
Glad to join the forum
BigAl
What Really Works for Technical Traders
in Technical Analysis
Posted
In keeping with Phantom opening post.....the pictures below are the hammers and dojies from last week's (5/16 to 20) YM and ES trading. I use 512 bars for YM and 1600 for ES.
The green horizontal bars are Long Entries, Red - Short Entries, Magenta - 1st Target exit at 10 ticks in the YM. Pstops (protective stops) are 15 tick below or above the Entry Prices. Just look to see if the market traded back above or below the hammer or doji at the entry.
I've only posted the 1st Target of 10 ticks and I'm using only 1 contract per trade to keep the example simple.
5/16: 6 trades for 60
5/17: 4 trades for 40
5/18: 3 trades for 10 no line for entries and exits
5/19: 3 trades for 30 no line for entries and exits
5/20: 4 trades for 20 no line for entries and exits
1st target total for week: 160 ticks