
Welcome to the new Traders Laboratory! Please bear with us as we finish the migration over the next few days. If you find any issues, want to leave feedback, get in touch with us, or offer suggestions please post to the Support forum here.


rocky9281
-
Content Count
42 -
Joined
-
Last visited
Posts posted by rocky9281
-
-
I don't trade the ES. But do you guys think that there is a fixed time for its breakout ?
For e.g, SGX nifty always breaks out of its range between 12 am to 1 pm EST.
Have you noted anything like that for ES too?
-
Just a general question here. If anybody knows the answer, please help me
Are the stock(etc.) exchanges a source of income for the large institutions?
If yes:
1. What %age of their annual income comes from trading stocks,futures etc?
2. Do u think that these large institutions will quit operating on these trading vehicles someday in the future?
-
If we see a small bid rising up tick by tick, is it true that the bid is actually very large, and is placed by a pro?
For example,
bid qty=158,bid rate=123.11
bid qty=158,bid rate=123.12
bid qty=158,bid rate=123.13
bid qty=158,bid rate=123.14
bid qty=158,bid rate=123.15
See how the bid rose from 123.11 to 123.15, but the size remained constant (158).
1.Should we go long here?
2.Is this a phenomenon that we will search for BOTH in the best bid ,as well as in all the tiers of bid that are below the Best Bid ?
3.Are the reverse things true for ask?
-
What is a stale buyer and why should he MUST buy and MUST suffer losses?
If he knows he is about to suffer loss, why didn't he cancel his bids and avoid unwanted fillings?
Lastly,
Can stale buyers buy with:
1.algorithms like TWAP
2.perfect prints on ask
3.double prints
-
Please help with this question.
How does large institutions enter or exit positions?
I know about the following options:
1 Large block trades and
2. Algorithms
What are the others?
-
Firstly I would ask wherever you heard it. Secondly I think there is more to it than that. For example a seller may bid up the price to 'test' supply and demand at those levels (of for a variety of other reasons). Broadly speaking you can assume who one by price direction tests and stop runs not withstanding.Thanks Blowfish
Blowfish, please explain briefly what do you mean by
1.price direction tests ,and
2.stop runs not withstanding
-
I have heard this from some traders that, if we see large prints in the time and sales, we must stay out of the trade and let the buyer and seller battle it out. After that, we should go with the one who wins.
My question is, how do you determine who won?
IMHO, if price gives breakout to the upper side, the buyer has won and we should buy, and vice versa for breakdown. So we are just waiting for a breakout either to the upside or downside.
Is there anything more to it?
-
What does it mean when I see the same volume figure appearing again and again in the time and sales window, also, it comes constantly in the same side (either the bid or the ask).
Please note that these are intervened by many other trades.But this number appear too frequently.
-
Thought it might be of interest to give a brief history of how I met the tape and fell in love with it. One book I owe to my first contact with the tape is Tape Reading and Market Tactics by Humphrey Neill. As a new trader this book was my bible in trading. I also studied the works of Jesse Livermore and Richard Wyckoff. What got me interested in tape was that all three traders had one thing in common. They were great tape readers. Back then.. the tape was the ticker tape. In Reminiscence Of A Stock Operator, Jesse Livermore learned to read tape at a young age working in a bucket shop. He would simply stare at price numbers and take notes. Eventually he started seeing patterns and support and resistance points off the tape. This gave him a tremendous edge as a trader.The story of Jesse Livermore was a true inspiration for me. Tape reading books are very limited... but I went on a mission to learn everything I could about the tape. I then decided to program my brain to seek patterns in tape. I used a simple real-time bar chart with a time of sale only and stared at it for months after months. For the first month or two... I was completely clueless. I had no idea what the tape was telling me and I was completely conviced it was impossible to trade off the tape. At that time it was too fast to read and wondered how anyone can keep track with all those prints. By the third and fourth month I started seeing little clues in the tape. I started seeing big lots getting bought and then being sold a few ticks later. This was fascinating to me because I was now seeing other traders hand. For example, I would see a 100 lot bought at the ask and then sold 3 ticks later on the bid. I then assumed that this 100 lot trader might think he is wrong hence the reason for selling. I was amazed to see price reverse from this piece of information only. I then started following big lots. I assumed that these big traders knew what they were doing and decided that I can profit if I can simply follow their footsteps.
Within half a year, I was able to identify many different types of clues on the tape. I started focusing on tape to time my entries and exits. I also started seeing the personality of the market through tape and the trader pyschology off the tape. A mixture of green and red (bid and ask) on the tape indicated a lack of conviction which led to a choppy market. In a trending market, the tape showed more green or more red. I started paying attention to the flow of the tape as well. In a trend, the tape will roll fast. Once the tape starts to halt, the markets will usually halt or even reverse at times.
I then applied the famous Nicholas Darvas' box theory into tape reading. Sounds weird but the box theory is very similar to market profile with higher/lower value placements. The box theory simply shows how price will travel in a range or box... once it breaks, it will enter a new box or value area. What you dont want to see is for price to breakout of a box and then return into the previous box. With tape, I would look for price rejection or what some traders refer to as the "token". The token became the upper point in the box and the lower point in the box. This was strictly short term. (short term as in seconds) If the tape broke above the token, I did not want to see prints back in the previous bracket. This concept became a key element in my tape reading skills.
In 2006... I read John Carter's book, Mastering The Trade. I enjoyed it especially because I was a pivot point based trader. I decided to check out his website and took the free trial for a week. That was the first time I heard of Hubert Senters who was also a great tape reader. I had the opportunity to watch some of this tape reading videos. (they are great by the way) I applied some of his techniques into my tape reading skills such as: watching for a base and closer observation of the flow of the tape. I also got the idea of seperating the tape into two columns to filter out the small traders from big traders. (extremely useful in my opinion)
Its been over 3 years now since I started using tape. It took me a while to really understand it but I truly believe tape reading offers a tremendous edge in trading. Even in my 3rd year as a tape reader I have learned new things off the tape such as identifying false breakouts. I have also made it a habit to take mental snap shots of the tape and then recall if there were more buyers or sellers. This helps me understand supply vs demand, hence market direction.
Happy Trading

Hello Soultrader,
Since you are an experienced tape reader, I request you to help me by replying to this post (post # 56).
Here is the link: Trading F&O by Time and Sales - Page 6 - Traders Laboratory Forums
-
Compression(or expansion)of the bid-ask spread.Any idea what it indicates?
How to use bid-ask spread in trading?
I think the compression(or expansion)of the bid-ask spread has got something to do with an intraday short lived rally or reaction.Can you please elaborate on this?
Also, please mention why does this happen..
-
Some possible price and volume combinations in time and sales window are:
1. High volume trading going off-both in bid and ask, with intervening small/medium trades in both bid and ask.I don't think this pattern should be ignored just because it is indeterminate as both bid and ask sides are traded heavily, but should be watched closely because the high volumes indicates professionals are participating.
2. High volume trading going off in bid,not a single trade is of small/medium volume.Also, not a single trade going on in the ask. (vice versa)
3. High volume trading going off in bid.Along with that,small/medium volume trades going off at ask. (vice versa)
4. Large number of small/medium sized trades going off at bid.None of the trades is of high volume.May not seem to be professional activity,but at the end of the day the summation of the volume of trades at bid at that price level comes out to be very high.
What does each of the above four combinations indicate, and hence, what the tape reader should do when he sees them in his time and sales?
-
Please throw some light on Time and sales refreshing.
1.Why does the T&S refreshes?
2.What does it mean when we see the time and sales data/window refreshes?
3.What to look for after the refresh?
-
Hello BlowFish,
Those vendors who provide true tick by tick data are too expensive for me.
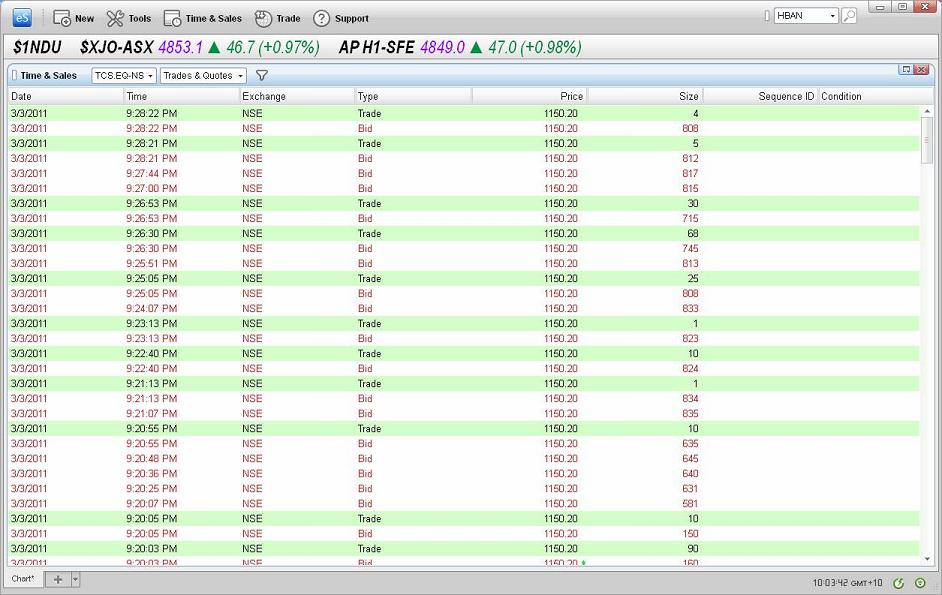
Most of the data vendors here provide data with ticks updated for every 1 second(although the exchange publishes every tick, these vendors can't incorporate it that fast and accurately).Please see the screenshot attached at post #49 for a sample of this kind of data.This is from eSignal.
So this is bit inferior than true tick by tick data.Will that lead to data aggregation? Will that kind of data work for T&S analysis? Shall I go for it?
-
un filtered, un coalesced dataHello Blowfish,
I asked some people about unfiltered, uncoalesced data. They haven't heard these terms earlier.
IMHO,I think:
Unfiltered means - they should disclose every trade as they occur and don't hide any trade.right?
Uncoalesced means- they don't add up two or more trades and show them as one trade... like bought 50@ 200.5 and bought 25@200.5. These 2 trades add up to give bought 75@200.5,and show this 75@200.5 in the T&S instead of the two separate trades of 50 and 25. Am I correct?
Please tell me what do they mean,in case I am wrong.
-
Do they report un filtered, un coalesced data? Do they report bid/ask info? If so there should be no reason why not.I am attaching a T&S screenshot of the exchange under consideration.
It seems they are reporting bid/ask info aren't they?
Regarding reporting of un filtered, un coalesced data, how to know whether they report them or not? Does this T&S shows these are reported?(I don't know what is meant by un filtered, un coalesced data )
If not, please tell me how to find out whether the concerned exchange reports these.
-
Will tape reading work with the equities of Indian stock market? Or is there any reason that it will not work? The exchange is called NSE-National Stock Exchange Of India.
-
This is described in NoBsTrading.
"The market is sitting at 05 bid/06 offer.The person bidding 1,500 at 05 pulls his bid. As soon as the market goes 05 offer, he buys whatever is offer and puts his bid back up."
Please clarify the following things:
1.What does it implies when we see bids getting pulled in the trading screen? Bearishness?
2. How did the market go 06 offer to 05 offer? Does this has something to do with bids getting pulled? Please explain .
3.Why did he put his bid back up again?
4. Is this guy buying with both market(at ask) and limit orders(at bid)? How do we distinguish and identify this person in T&S?
-
Hello,
Can you please explain the following sentence:
"When there is more depth on the same side of the market, limit orders are relatively more expensive than market orders because of (1)an increase in the execution risk and (2) competition from the existing limit orders."
1.What is meant by "execution risk" here?
2.does "competition from the existing limit orders" mean that other limit orders may get filled before my limit orders ?
-
I am attaching 2 screenshots. The first one is in black text.But actually they were all in red-every trade executed at bid-in a single price level.
The second one all green -every trade at ask-in a single price level.
Please tell me-does the first one tells to short immediately and the next one buy immediately?

-
Don't think I know the book (though may have just forgot).
Ok,Thanks.
Please do me another favor, please don't forget to tell me your thoughts about the teachings on this book, after you have gone thru it.Its in module 2 (pg86-pg157). I will wait for your reply.
-
Is this book good?
Daytrading University Trading Course.pdf - 4shared.com - document sharing - download
especially the second module (pg86-pg157)
Please let me know your thoughts about this book
-
Thanks to BlowFish and $5DAW.
Just a couple of queries.
1. While buying and selling, do the pros use market buy and sell orders instead of limit orders?
2.Blowfish, I have gone thru Tape Reading And Market Tactics & Studies in tape reading.But neither of them has concepts like-pace of transactions, how orders are refreshed (or pulled), how one sided the book is etc. (or did I miss them?). So I think I should start with the other resources directly. Your comments please.
Breakout Trade Strategies on ES
in Technical Analysis
Posted
Sure. But can I have my answer please?