
Welcome to the new Traders Laboratory! Please bear with us as we finish the migration over the next few days. If you find any issues, want to leave feedback, get in touch with us, or offer suggestions please post to the Support forum here.


savarez
-
Content Count
21 -
Joined
-
Last visited
Posts posted by savarez
-
-
tapes make traverses make channels, and their gaussian relationshipAs a general principle this sounds fine but in reality, the market simply does not behave in a uniform 3*3 relationship as in your theoretical illustration.
-
This is not only about the volume, but also about the price. Hence price-volume relationship. The troughs of the volume correspond to the points on the price pane. If you have 2R on the volume pane, this 2R should do something to the price and trend lines in order to be part of the sequence on your fractal.That is obvious. What is still not clear is why the B2B trough is at 10:45.
-
Ok. Here is what I see in the chart. The question on the table is why the trough of the medium lines is not at 10:25.Thank you for your thoughts but I fail to see how your post answers the question. Looking at the black peaks they decrease to a minimum at 10:20 followed by a sequence of increasing peaks. So it would seem logical to put the trough at 10:25. And I am still mystified how we can have a medium gaussian sequence all contained inside the rtl that defines the medium b2b. Perhaps the chart clip is from a thread that does not adhere to the conventions described in THIS thread......
-
EVERY container ends on an FTT. We know that if a VE has occurred then we have NOT had an FTT, so the container CANNOT be finished. Closing inside, on or outside the LTL at the time of the VE is irrelevant.
-
The market begins a new cycle (for all fractals) at 14:15 (Eastern Time) yesterday (10-13-2010). Start the annotation process from that point in time.
HTH.
- Spydertrader
Thanks for the clue. Here's a shot at today, but even with hindsight, it's hard to tell which gaussian belongs on which fractal level. My skinny b2b2r2b came unstuck at 15:30 yesterday (oops) when p3 fell below p1 (not permitted of course). Without some guidance for distinguishing fractal level for each container,the nesting seems to come unravelled pretty quickly.

10_14_2010.thumb.jpg.2e2e8f36d833506a018e422d3dcc0f21.jpg)
-
Post your corrected version of a chart. Then we can talk.Sorry I don't have the data to reconstruct the chart. Why is that necessary for you to contribute to the discussion? I'm sure that we could all benefit from your excellent understanding of how to nest gaussians.
-
re: #4. If an x2x (b2b here) gets us to a P2 then wouldn't the Olive P2 need to be where the thin b2b ends , being 11.05 now that we're saying the medium B2B g's should be thin ?
One step at a time:
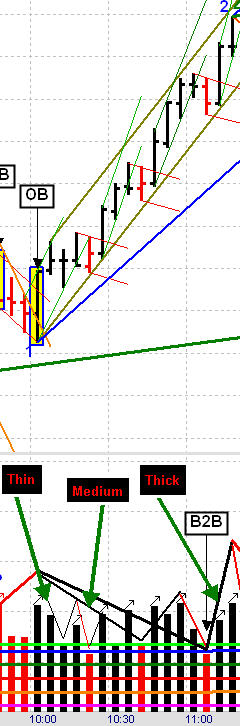
10:05 bar bo's the orange rtl and we form the skinny green tape. This must contain the skinny b2b. Price must close outside the b2b container in order to form a 2r container on the same fractal level.
10:25 (red bar) closes outside the green skinny tape, to give us the skinny 2r red tape. Our skinny b2b container ends on the 10:20 bar. This defines olive p2.
10:30 closes outside our skinny 2r tape, forming a new green skinny 2b tape and we now have olive p3. We draw the olive RTL. The RTL is cloned to give the LTL. For geometric reasons it is drawn to the high of 10:10 instead of 10:20 in order to contain all of the price action. This makes 10:10 appear to be olive p2.
The skinny b2b2r2b (skinny green tape, skinny red tape, skinny green tape) construct the olive B2B medium container. Price must close outside the B2B container in order to form a 2R container and reach medium p3.
If this is wrong, I am hoping that Spydertrader will explain why. I am trying to adhere to the principles illustrated in post #4 http://www.traderslaboratory.com/forums/f34/price-volume-relationship-6320.html#post70030
-
Think one more time. The chart was from Spyder.Is he immune to mistakes? He has warned about referring to older annotations.........
perhaps you might like to offer a detailed alternative if you feel that my explanation is wrong.
-
Thx for the reply savarez.apologies I see you mentioned this in your p# 2216
but to be frank, I'm non the wiser..
so what are we saying here?
1. the thin guassians are wrong because they don't end at 10:30?
2. the medium g's are wrong because it's P3 needs to be outside it's RTL (Olive)?
3. the Olive RTL and LTL is actually the container for the medium B2B g's and not medium B2B2R2B ?
4. although the Olive Ltl should start where the Blue P2 is at 11.20 because a B2B gets us to a P2?
5. the thick g's are wrong because they should be medium?
how are we to understand how/where/when to annotate thin g's ?
confused:
thx
1. No, the thin lines are correct. It's just that you can't see the thin lines that continue beyond 10:30 because they are hidden by the medium lines.
2. Correct.
3. Correct
4. At the close of the 10:30 bar we can draw the olive RTL. We can then clone it to give us the olive LTL. The LTL is positioned so that it contains all of the price action up to that point in time. This would mean that the LTL has to be positioned at the high of the 10:10 bar, where it is shown. This creates the container for our medium B2B which is being created by the thin b2b2r2b sequence, which extends with further cycles of 2r2b inside the olive RTL.
5. Correct. We cannot begin the medium 2R until price closes outside the olive RTL, and we cannot have a thick B2B until we complete the medium B2B2R2B.
-
"1. Why does the sequence for the thin lines (thing, goat, tape, whatever) end at 10:30 ?"Does anyone have an answer to #1 ?
The thin lines do NOT end at 10:30. They continue, underneath the medium lines, which as shown, are incorrect
The medium 2R gaussian is wrong. Price must close outside the olive RTL before it can reach the p3 of the medium sequence. The olive RTL defines the container for the medium B2B. The thick B2B is actually medium.

-
The 10:25 bar is the first close outside the skinny b2b green tape, giving us the red skinny tape 2r. The 10:30 bar closes outside the red skinny tape, forming the 2nd green skinny tape, taking us from p3 of the skinny tape b2b2r2b sequence, giving us the olive rtl. This is the rtl of the medium B2B. To be consistent across all fractals, price needs to close OUTSIDE this olive rtl in order to reach p3 of the medium B2B2R2B container. However, price fails to close outside the olive rtl so I suspect that the medium 2R drawn to 11:10 is incorrect. Perhaps 11:20 is medium p2.....

-
I was talking about purposeful annotations one can do. Feel free to add all the lines you wish. In this thread Spyder has made a statement about faster fractals needing their completion before slower fractals doing their job. The chart I posted illustrated this notion crisp and clear.Your post suggested that the thin line sequence ended at 10:30. For me that was misleading, because I don't think that it did. If I am incorrect then please explain why.
-
In order to keep the discussion about fractal nature of the Gaussians afloat, here are some questions. All questions refer to the chart of Spyder quoted above. All times eastern and end of the bar.1. Why does the sequence for the thin lines (thing, goat, tape, whatever) end at
10:30 ?
Enjoy.
For the purpose of clarification,I think that I am correct in saying that the thin line sequence does NOT end at 10:30. It continues, 2r2b2r2b, hidden underneath the medium and thick lines lines.
-
Here's my Gaussians drawing on the paper.Please let me know if it's incorrect.
Thanks.
Incorrect. see attached
-
Before going back to the chart, let me answer your questions.Point 2 is at the peak/highest volume of R2R.
.
Incorrect. The second R of the R2R will not necessarily be greater volume than the first, so p2 will not always be at the highest volume of the R2R. P2 is at the highest point reached by price (assuming long) before price leaves the R2R tape.
-
chart for Oct 5. Gaussians drawn with hindsight
10_5_2010.thumb.jpg.dcd2d1757d71b87c3cdd1af4351686ae.jpg)
-
The market provides the answers you seek, and it does so each and every day.- Spydertrader
This sort of reply does not help those here trying to make sense of this thread. Making the step from the gaussian principle illustrated in post #6 to distinguishing the sequences on each fractal level requires more than you seem prepared to offer. A chart or two, with an explanation of WHY, would go a long way.....

-
Her's my chart for Tuesday 10/05/2010.Do these four fractals have the same weight?.
I would suggest that the first 3 are. If not, perhaps Spydertrader might be good enough to explain why.
-
Watch volume pace ...Are you saying that "volume pace" defines fractal level? An example would make things clearer if you would be so kind.
Thanks
-
It is unfortunate that no clear explanation regarding how to identify fractal levels consistently has ever been given in this or the IT thread, despite numerous requests from the many individuals that have devoted many 1000's of hours to this methodology.
10_14_2010.jpg.5f42e153f0fafa3f1f3c2f1739af11d4.jpg)
10_5_2010.jpg.86de400bf5fcfe981457bc5d2937b613.jpg)
The Price / Volume Relationship
in Technical Analysis
Posted
Thanks for the chart. This helps to clarify several issues I have been struggling to resolve. The 15:55 bar VE's the magenta LTL, so it cannot be an FTT of the magenta container. However, it finishes the gaussian sequence for the magenta. The B2B (for the next sequence on the same fractal) starts on the same bar so the VE hasn't caused price to "go around again" and our B2B doesn't start on an FTT. So clearly not all p1's are FTT's. Thank you for your help.