
Welcome to the new Traders Laboratory! Please bear with us as we finish the migration over the next few days. If you find any issues, want to leave feedback, get in touch with us, or offer suggestions please post to the Support forum here.


Jeff65
-
Content Count
24 -
Joined
-
Last visited
Posts posted by Jeff65
-
-
Hi Jeff , this is an example of the score......i don't have idea how to calculate....I believe the score is a numerical representation of the trading rules. The code posted above does use a trend filter to filter trades.
-
thanks Jeff......in any case the signals must be filtered ...in market club there is a score and they suggest to take the trade at + 70 for long or - 70 for short.......How do you compute a 70 or a -70?
-
Hi Jeff thanks for your post.....i am using on forex as per market club ......looks very good......here tha chart daily on EURUSD......do you see all correct ?Thanks
Looks good Dirk. Never thought to try it on forex.
-
The CURRENT DAILY LOW. There is only ONE low of the day after the day is over but during the day new lows can be made. You do NOT know IN ADVANCE which low will be THE DAILY LOW. That's why you take your chances within 20 pips of the current daily low. Sooner or later, you are right.Thanks for the clarification.
Thus the first bar of a new day could be within the "current daily low" definition and we could be entering on bar 3 of the day given bar 1 is down, bar 2 is up and bar three breaks high of bar 2 taking us long into the trade?
Thanks.
-
Thanks Jeff65.But isn't better to use "LimitOrder" function?
I've never used that function. But yes, there are many ways to accomplish a single task.
-
When you state to enter within 20 pips of the daily low, what does that mean? The low of the past 24 hours?
-
Please advise waht are the best steps to start leaning about markets and investing. I investview good?That's a tall order.
 I would say start reading a lot to discover what type of trading or investing you are interested in. Consider how much capital you are willing to commit and thus, lose. Buuild, test and refine a trading plan while tading in a simulated account. Be sure to also read about money management and trading psychology. Never use real money until you prove your worth in a simulated account.
 -
-
I get the concept.But how can I catch bar close event?
Code would be good.
The code example of an Open Range Breakout system may help. Execute it on a 5-minute chart. I wrote it for the futures market but can be adapted to other markets. Orders are based upon the first 30-minutes of trading and remain active all day.
Let me know if you have questions.
// Example Open Range Breakout // Executed on a 5-minute bar // Order levels are based upon first 30-minutes of trading. // Order levels and stop levels remain valid all day. variables: MP(0), HH(0), LL(0); MP = MarketPosition; { ---------------------------------------------------------- First 30 minutes of Market Open Compute Opening Range 830 - 900 Central ---------------------------------------------------------- } If ( Time = 900 ) Then Begin HH = Highest( High, 6 ); LL = Lowest( Low, 6 ); End; { ---------------------------------------------------------- Place orders between 900 and 1455 Central Place only one trade per day ---------------------------------------------------------- } If ( Time >= 900 ) And ( Time <= 1455 ) And ( MP = 0 ) And ( EntriesToday(Date) = 0 ) Then Begin Buy ("LE") next bar at HH stop; Sellshort("SE") next bar at LL stop; End; // Set stop levels at opposite range If ( MP = 1 ) Then Sell next bar at LL stop; If ( MP = -1 ) Then Buy to cover next bar at HH stop; // Exit all trades at 1500 Central If ( Time = 1500 ) And ( MP <> 0 ) Then Begin Sell this bar at close; Buy to cover this bar at close; End; -
Hi guys,How to enter pending order that is valid all day or until canceled in Tradestation ?
Now "buy stop/limit" order are valid only one second bar and if not executes they are canceled.
Orders are placed on the next bar. That's is, the bar after the bar that just closed.
This is how I would do it. After determining my buy level I turn on a flag. Each time the current bar closes and my order is not filled, the order is replaced. If order is filled, my flag is disabled. At the end of day, my flag is disabled and all unfilled orders canceled.
Let me know if you want me to post a code example.
-
In which case, you have to accept that there will be trades that go in your favor that have only 1/3 ( simpled version of your example) of your position on. On the other hand, each stop out will be with your max position.So, your winner is going to have to go 3 times as far as your loser to break even on a day where you have a single scale winner and a max loser. That doesn't sound like love.
Who says one can't scale in as price climbs as well?
What if the average trade nets 4 or more times risk of a full stop out? There are profesionals who scale in. There is a million ways to successfully trade and even more ways to lose.
-
There is a difference between adding to a loser and scaling into a trade as it moves against you. Adding to a loser is often unplanned and violates your risk-per-trade rules. However if your plan is to risk say 3 percent of your capital on a given trade and your plan is to scale in at 1 percent intervals then this is fine.
-
True - I completely understood, but backtesting either for the 1980's or the last 6 months is still backward looking. You dont want to fall into the trap of using numbers to justify a viewpoint....such as currencies trend less than equities. thats all.For short term trend trading models, I have always wondered if the context of what is hot right now is a great way to look at it - ie; a volatility measure - however even a short term volatility measure is not necessarily a great indicator of what is trending.
If you are really interested in a guy who does a lot of interesting number crunching for trend following (although its for long term stuff, so maybe not your bag) check out Au.Tra.Sy blog - Automated Trading System by Jez Liberty
Thanks. I do check in on that site on occasion. Take my studies for what they are. For me EC trend better and for you, that may not be true.
I have many more studies I'll post over the next few weeks when I get some time.
-
trend trading is more about money management, participation and having a diversified portfolio. You never know when stocks will trend more than currencies.Just because stocks have not trended as much over the last ten years means little. Look at 1982-2000. Looking backwards to find the right combination of trending instruments is curve fitting and just that - looking backward.

I don't trade in the 1980's.
I can only trade what the numbers tell me today. For day trading futures in the current market environment, EC has been much more kind to me than YM or ES. My trades last from several minutes to several hours and trends in EC are much more pronounced than ES. This is just my meaningless opinion.
As for longer term swing trading, that is a different game were diversification in non correlated markets does play more a role.
-
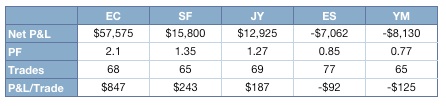
This is a little study I did back in January of 2010 when I was interested in demonstrating which popular futures markets exhibit more trending behavior. To do this I devised a simple trend following strategy that consisted of a single 50-period simple moving average on a daily chart. The system only takes long signals. It enters a new trade when price crosses above the moving average and closes that position when a daily bar closes below the MA. I'm not attempting to create a trading system per say, but creating indicator that measures a market's trending characteristics.
The rules are below:
Buy close of bar when Close > SMA(50)Sell close of bar when Close < SMA(50)
Because this is a trend following system, it should perform better on markets that exhibit trending behavior. I tested this system on some popular stock index futures markets and currency futures markets. The chart below is organized from left to right with the best producing market. Notice which markets are grouped to the left and which markets are grouped to the right.
2000 - 2009
Daily Bars – No Commissions – No Slippage
I think this provides some evidence that the stock index markets do not have nearly the trending characteristics of the currency futures markets. More specifically, the Euro really shines as a trending market. I know from personal experience that I generate consistently better results when I trade my trend following strategies on the Euro currency futures as apposed to S&P Emini. In fact, I no longer trade S&P Emini with my trend following setups.
If you have a trend following system and trade the stock index markets maybe you will want to take a look at the currency futures.
-
In TradeStation you can have two different timeframes on the same chart. Thus, the automated strategy can take information from both timeframes to determine when to trade. This is possible. However, the time frames can not be mixed, if I remember correctly. That is, you can't mix tick and minute charts.
-
Thanks for your response. I retested the system with limit orders on 5 min bars and it shows similar to your results. The problem I would have with this system is that it's performance before October/November 2008 (incidentally this coincides with the market crash) is the exact opposite-equity curve steadily going down. In any case, I understand your logic and wish you luck trading it until it stops working. Just a quick question here. What drawdown will cause you to stop using this system? I am asking because the equity curve going back to 2005 has a sharp V shape with turning point in 2008, so once the equity curve starts going down you cannot be confident it's just a temporary blip or the system simply doesn't work anymore. Regardless of all the ranting here, I do like your systematic approach to researching market behaviour.That's a good question. One technique I like to use is to apply either a moving average to your your trading system’s equity curve. You'll have to try a few numbers to see what you like. By placing a simple moving average over your equity curve you create an indicator alerting you when to to stop trading and when to resume trading. You trade the system when the equity curve is above the moving average and stop trading it when it falls.
It's true you can't be certain if the drawdown is temporary or if the edge is simply gone. But by "trading the equity curve" this will help keep you out or alert you to when the system is experiencing long periods of drawdown.
I have a blog post on this with a short video demonstrating this concept here.
-
I backtested your system on 5 years of data and it doesn't show good results, it does show better results starting from 2008 but still nowhere near the equity curve you are showing. I used 1 min OHLC data to test the strategy. I am not saying simple things don't work but this just seemed very suspicious to me that such a system would work and the backtest showed it wouldn't.The graph at the beginning of this post is on a 5-minute chart. The system does not trade 1-minute bars because that's far too noisy. It was designed on 5-minute bars and I've also traded it on 10-minute bars.
Also during the development it was pointed out that this was a recent edge, that started in the last two years and probably won't last forever.
If you want to know more I posted some videos on my blog that show how I developed this system. You can find those videos here.
Again, this system probably has an edge that will not last forever. It's not a super great system. You're not going to get rich trading this system alone! But it's an example of finding an edge in the market and attempting to exploit it. If you watch the videos on how I created it you will get the main thrust which is, tips on developing a trading system.
Hope that helps.
-
Hello JeffI know it is an old post, but do you remember why you used the ATR value?
Martin
Hey Martin. I simply picked it. I did no back testing or optimization on that number.
-
How closely does the clone match the real deal? Good question.
Market Club just posted an alert in regards to their Perfect R Portfolio going long today in USO. They purchased USO at $37.13. The Perfect R Portfolio Clone with data from TradeStation triggered a buy signal today @ $37.31.
Occasionally I've noticed these slight price differences and I would assume they are due to the data being supplied from different vendors.
-
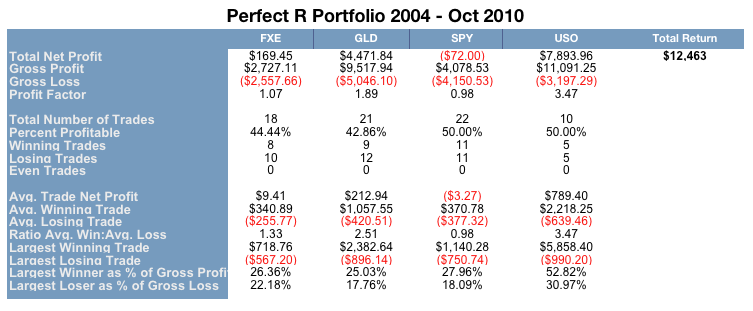
The Perfect R Portfolio
I was recently watching a short video hosted by Market Club. This particular video was a presentation on their “Perfect R Portfolio”. The Perfect R Portfolio is a portfolio of four ETFs (SPY, USO, GLD, and FXE) that are traded based upon Market Club’s “Trade Triangles” technology. The system rules are simple and clear. For each trade you dedicate 25% of your trading capital. Go long when you see a green Trade Triangle and close the position on the red Trade Triangle. These green and red signals are actually price levels that allow you to place your buy stop and sell stop orders and wait for the market to fill your orders. These values are updated weekly. It does not get any easier than that. Such a simple greenlight/redlight system can be very appealing. In short, the Perfect R Portfolio is a complete trading system that provides you exact entry and exit levels.
Because the portfolio contains ETFs, does not trade very often and only takes long positions (there is no shorting in the Perfect Portfolio) it seems suitable for trading in retirement accounts such as a 401K. In fact, I do believe this is what the creators had in mind when developing the system.
How Do They Do It?
I enjoy attempting to figure out what is going on when I see a trading system demonstrated on-line. It’s a challenge and great fun to reverse engineer signals. Market Club’s Trade Triangles were no exception. Don’t get me wrong, I have nothing against Market Club and I do believe they provide a valuable service. However, how they generate signals became an interest for me and in the end, the concept they are using is well known, simple and totally free. Market Club does provide a nice looking chart where buy/sell signals (Trade Triangles) are nicely displayed on-screen.
When I examined the entry and exit signals over time I came to the conclusion that the Trade Triangles are nothing more than a classic breakout indicator. That is, they simply take the highest high over the past N days to determine when to go long and then determine the lowest low over the past N days to determine when to close that same long position. More specifically in the case for the Perfect R Portfolio they use a three month channel of price extremes to determine market direction (trend) and use a three week channel to determine entry/exit price levels. Trend trading based upon price channels is well documented and continues to be a valid trading method.
Trend: Three month price extreme.
Signal: Three week price extreme.
The trend component of the system is used to filter out bearish market conditions since the system only goes long. So, during bearish times we are in cash or cash equivalents waiting for a trend change to bullish.
For example, given an ETF we first determine the overall trend. This is done by determining the price extremes based on a monthly chart of the last three bars. Price touching these extreme levels on a daily chart would determine the trend either bullish or bearish.
Once the trend is determined a three bar price extreme based on a weekly chart is used to determine when to exit and when to initiate new trades. When the trend changes from bullish to bearish all trades are closed and we don’t open new long positions until the trend becomes bullish.
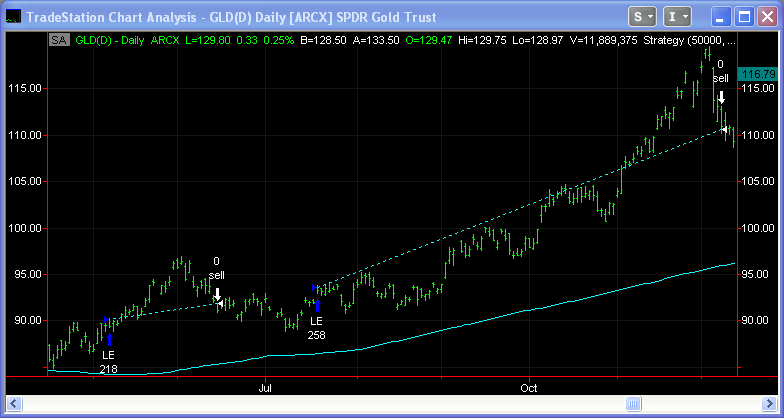
It’s that simple. Below is a trade example.
Cloning The System Logic
But how well has the Perfect R Portfolio done? Well, the portfolio is rather new so they don’t provide much backtesting data. Market Club does provide a short PDF report demonstrating how well the system performed during the 2008 market crash. However, Market Clubs price channel breakout concept can be programmed into TradeStation rather easily. TradeStations ability to access several timeframes on a single chart will be required to make this trading system. First, all trades are executed on a daily chart, buy/sell price levels are determined on a weekly chart and trend is determined on a monthly chart. All three of these timeframes can be placed within one chart and accessed by a single TradeStation strategy.
Programmer speaking coming up so be warned.
First I’ll create a workspace with a chart of one of the ETFs used in the Perfect R Portfolio. I’ll select GLD. I will want to place trades on a daily chart so I set my GLD chart to daily price data. Next I want to generate buy/sell signals based upon a weekly chart. To do this I create a sub-chart of GLD to hold weekly price data within my chart. I can then access this data programmatically by referencing “data2″ in my Easy Language code. I do the same thing for the monthly timeframe of GLD and can access that data by referencing “data3″.
Data1 = Daily chart
Data2 = Weekly chart
Data3 = Monthly chart
I created a clone of the system and tested the system with the four ETFs over the life of each ETF. Unfortunately TradeStation does not have the ability to test a portfolio of ETFs given a single strategy. This weakness is rumored to be fixed in version nine of TradeStation. Until then we’ll have to test each ETF individually. So how did it do? Not bad for such a simple system. The results are in the table in the section below. You will see that over the life of the system it is profitable. The life of the system is only from 2004 - October 31, 2010. Most of the ETF data only goes back that far!
Modified R Portfolio With Risk Management
The most obvious drawback I see with the Perfect R Portfolio is the lack of a position sizing algorithm based upon the risk per trade. That is, the dollar amount you’re willing to lose based upon the stop level. I might be inclined to use the Percent Risk Model to calculate the number of shares to purchase based upon a 2% risk-per-trade. This would help normalize risk by reducing the number of shares when the market conditions are volatile and increase the number of shares when volatility is waning. Instead the Perfect R Portfolio uses a fixed percentage (25%) of equity for each new trade regardless of risk.
In a future post I will add a position sizing algorithm to see if we can improve the results. If you can't wait check out this blog post where I already have posted the updated version. There is also a short video that explains the inputs to the system.
Download
I was having trouble uploading the TradeStation Workspace to this post but the EasyLanguage code should be attached. You can also download a copy of the Workspace or the EasyLanguage code at my blog. This code is for TradeStation 8.8.
If anyone finds an errors in the code or would like to make a suggestion please let me know.
Thanks,
Jeff
-
Very good idea.add some filters can be very profitable system.
While I can’t explain why, it is often the case that different days of the week show unique trading characteristics. I tested this day trading system across each day of the week. That is, what would the system performance look like if I just took trades on Mondays? How about Tuesday? And so on.
In short, Friday is a consistent loser and by not trading this ES scalping system on Friday, you can produce better performance results. I created some equity charts and a short video *removed promotional URL* to demonstrate what I did, for those who are interested.
Jeff
-
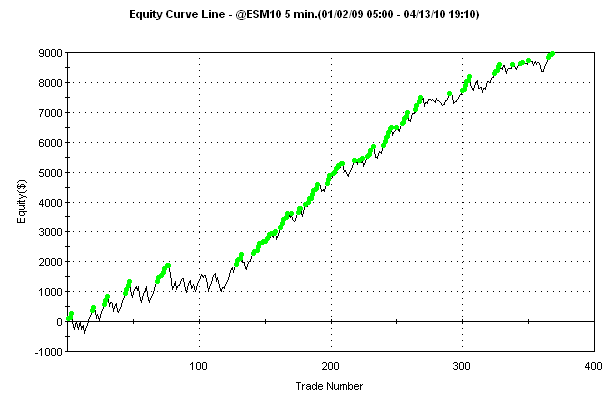
Here is a simple automated trading system that has been exploiting an edge in the S&P futures market (ES) for over a year. The equity curve shows the performance of trading one contract and takes into account both slippage and commissions ($18.50 per trade).
Equity Curve 2009-2010
($18.50 deducted per trade)
I attached the EasyLanguage code so you can experiment with it if you wish.
I create trading systems for TradeStation to exploit such edges. Edges in the market, such as this example, can appear and persist for months or even years. I attempt to find these and ride them until they begin to fail. How do I know when they fail? I usual use a simple moving average of the equity curve. When it begins to fall below the moving average then I stop trading it. Anyway, this is an example of an edge that I discovered last summer. I then created a simple trading system based around it and the edge continues today.
How does this system work? It's simple. I use RSI(9) to fade price extremes in the pre-market hours (600 - 830 Central). It can be traded on a 5-minute chart or 10-minute chart. The equity curve above is from a 5-minute chart. The system has a $150 profit target and a $250 stop which is typical for a trend fading system. That's it! The choppy nature of the ES market in the pre-market hours has really made this simple concept work. Of course the edge will not last forever! It could end this week or last for another year.
I bring this up because trading systems don't have to be complicated. Often what's more important is simply diversifying across different markets with different systems. That also implies being properly funded to trade a portfolio of systems.
Here is the code:
{== START OF HEADER ==========================================================================

Program: EE Morning Fade
Author:  Jeff65
Date:    August 2009

Platform:       TradeStation v8.6
Chart Settings: 5-minute bar
Market:         ES

DESCRIPTION:

This program uses standard RSI to fade the market. Trades are entered at the extreme of the
signal bar on a limit ordrer. Trades are exited at market.

Learn More: http://www.eminiedges.com

== END OF HEADER =============================================================================}

Inputs:
Cntracts(1),
   TradeTimeStart(530),
   TradeTimeEnd(830),
profittarget$(150),
   stopLoss$( 250),
DayLoss$(250),
   RSI_Period(9),
   UpperLimit(70),
   LowerLimit(30);

Variables:

{ -- Software Version Information ------------------------------------------------------- }

vNumber("1.00"), // Current version of this software
vProductName("Morning Fade"),// Product name

  { -- Trading Variables ------------------------------------------------------------------ }

MarkPos       ( 0 ), // Market Position
TradeFlag ( false ), // Trade Flag. TRUE = activily trade
RetVal		  ( 0 ), // Return value place holder

{ -- Money Management ------------------------------------------------------------------- }

ATR(0),				// ATR at purchase
PLB4Today(0),		// P&L total before today
ProfToday(0),		// P&L total for today (NP + OPP - PLB4Today)
OPP(0),				// Open Position Profit
NP(0);				// Net P&L of all closed positions

{=== START OF PROGRAM  ======================================================================}

  If ( date <> date[1] ) Then
  Begin
     PLB4Today = NetProfit;
  End;

////////////////////////////////////////////////////////////////////////////
//
// Compute the current market position and reset TradeFlag to FALSE
//

MarkPos = MarketPosition;
TradeFlag = false;

  NP = NetProfit - PLB4Today;
  OPP = OpenPositionProfit;
  ProfToday = NP + OPP;


////////////////////////////////////////////////////////////////////////////
//
// Determine if current time is within valid market session.
// This is done by setting the TradeFlag to TRUE which will allow
// new positions to be opened.
//

If ( Time > TradeTimeStart ) And ( Time < TradeTimeEnd ) Then
   TradeFlag = true;

If ( ProfToday <= -(DayLoss$) ) Then TradeFlag = false;

////////////////////////////////////////////////////////////////////////////
//
// If current time is within valid market session then we look for an
// opportunity to trade
//

If ( TradeFlag ) Then
Begin

	 If ( MarkPos = 0 ) Then
 Begin
    	If ( RSI( Close, RSI_Period ) < LowerLimit ) Then  Buy ("LE") Cntracts contract next bar at Low limit
    	Else If ( RSI( Close, RSI_Period ) > UpperLimit ) Then Sell Short("SE") Cntracts contract next bar at High limit;
    	ATR = AvgTrueRange(13);
    End;

End
Else
Begin

    // Exit all positions when not in valid session

    If MarkPos = 1 then sell("Close All") next bar at market;
 If MarkPos = -1 then buytocover(" Close All") next bar at market;

End;

If ( profittarget$ > 0 ) then SetProfitTarget( profitTarget$ );
SetStopLoss( stopLoss$ );
Jeff
Help With Easylanguage Asap
in Coding Forum
Posted
The most simple way is to move the inputs to the variables section of your code. Compile your code with the desired variable settings and load into a chart. Your inputs are now gone.