
Welcome to the new Traders Laboratory! Please bear with us as we finish the migration over the next few days. If you find any issues, want to leave feedback, get in touch with us, or offer suggestions please post to the Support forum here.


sambrown
-
Content Count
25 -
Joined
-
Last visited
Posts posted by sambrown
-
-
I'm not entirely certain you have the Order of Events correct once one sees R2R 2B or B2B 2R. Please review what you must see once the market has shown itself to have reached Point Three. Everything else looked fine. With respect to your 'Big Picture' gaussians, did you arrive at a Point Two in the big picture?Remember, when a dominant channel begins at its Point One, a traverse and a tape also begin at their Point One.
- Spydertrader
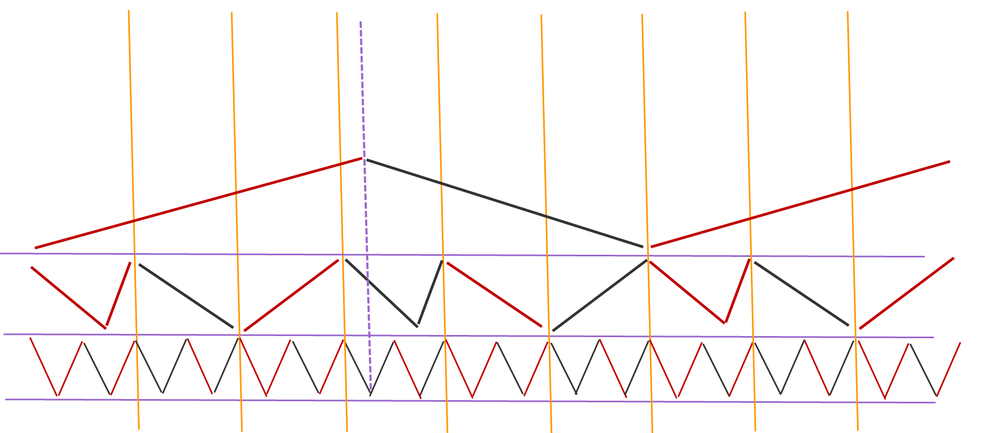
Here's my hand drawing of a point 1, 2 and 3 of a channel with their sub fractals.
Based on this drawing, my "Big Picture" just completed the first 3 segments and point 2 of the channel has not been arrived yet.
-
This chart from Spyder, may be helpful to understand the fractal nature of Gaussians.http://www.elitetrader.com/vb/attachment.php?s=&postid=2205173
Also see the discussion for the context : pages 1630-1636.
Spyder, I guess you would allow.
Gucci,
Thanks for the links.
How can you pick out a particular discussion from such a large thread? You must have some kind of indexing into that thread?
-
Spydertrader,
Thank you for your patience and taking your time explaining to me how to recognize my errors. Either my understanding of the nesting of different levels of Gaussians is incorrect OR my translation of this understanding to the actual drawing is wrong.
So let me make sure my understanding of the nesting is correct by answering your questions without looking at any chart first.
If your Gaussians show you R2R, where are you with respect to the order of events?I have a new order of events and point 1 and 2 have been developed for this new sequence.
If your Gaussians show you R2R 2B, where are you with respect to the order of events?This is a retrace from point2 to point3 of the new sequence.
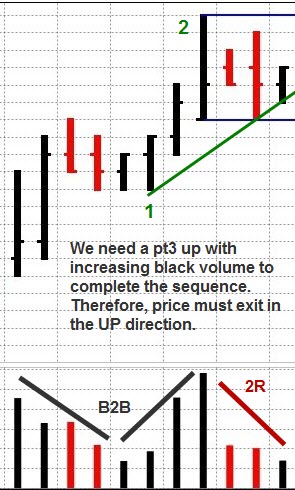
If your Gaussians show you R2R 2B 2R, where are you with respect to the order of events (and what then do you want to see to tell you this order of events has ended)?I have point 3 of the new sequence and I need a 2B 2B (decreasing black and then increasing black) to know this sequence has been ended. If I see 2B2R instead, the market is signaling this sequence will continue.
What else do we know? Our Order of Events marks the minimum requirement needed to complete a given fractal. While no maximum exists, each component of the order of events must develop in the exact same fashion as the minimum level required.Please correct me if I misunderstood this statement.
For minimum, I need B2B2R2B to complete a sequence. But this sequence can continue with 2R2B2R2B...?
Begin with the slowest fractal (channel) and move faster.
If I zoom out and look at the bigger picture, I see this.
I will zoom into each line if this is correct.
-
Thanks for all your advices.
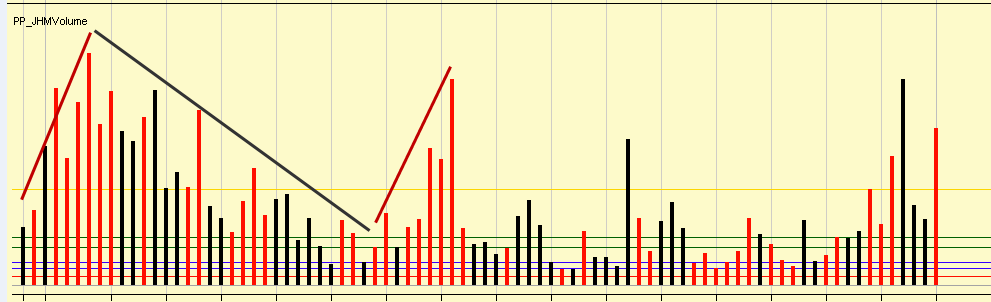
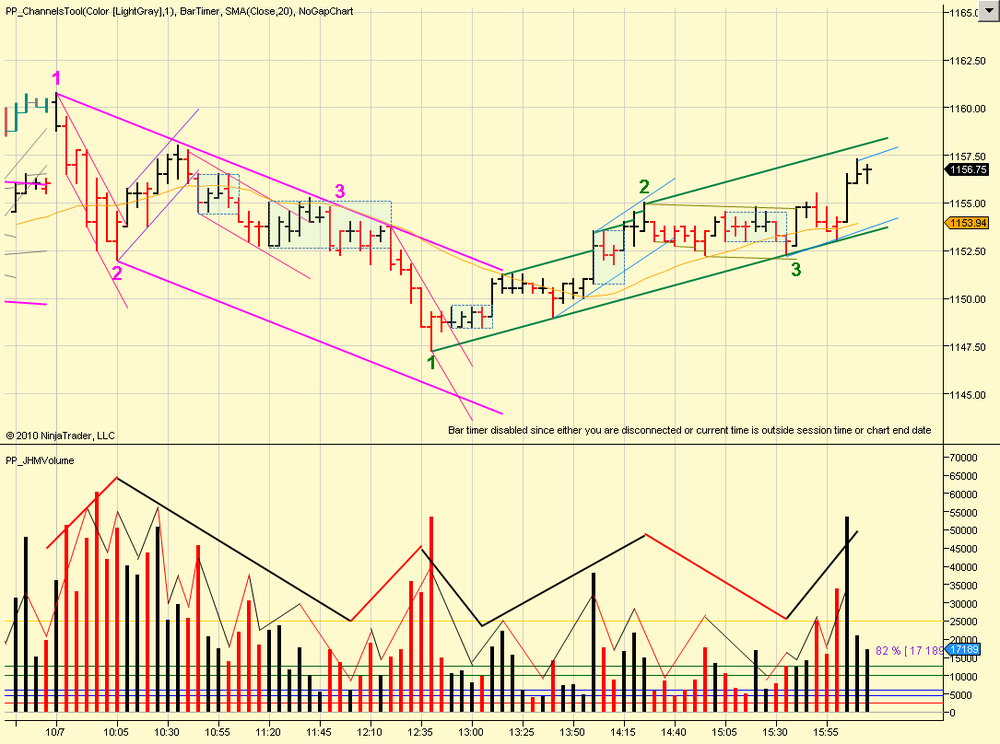
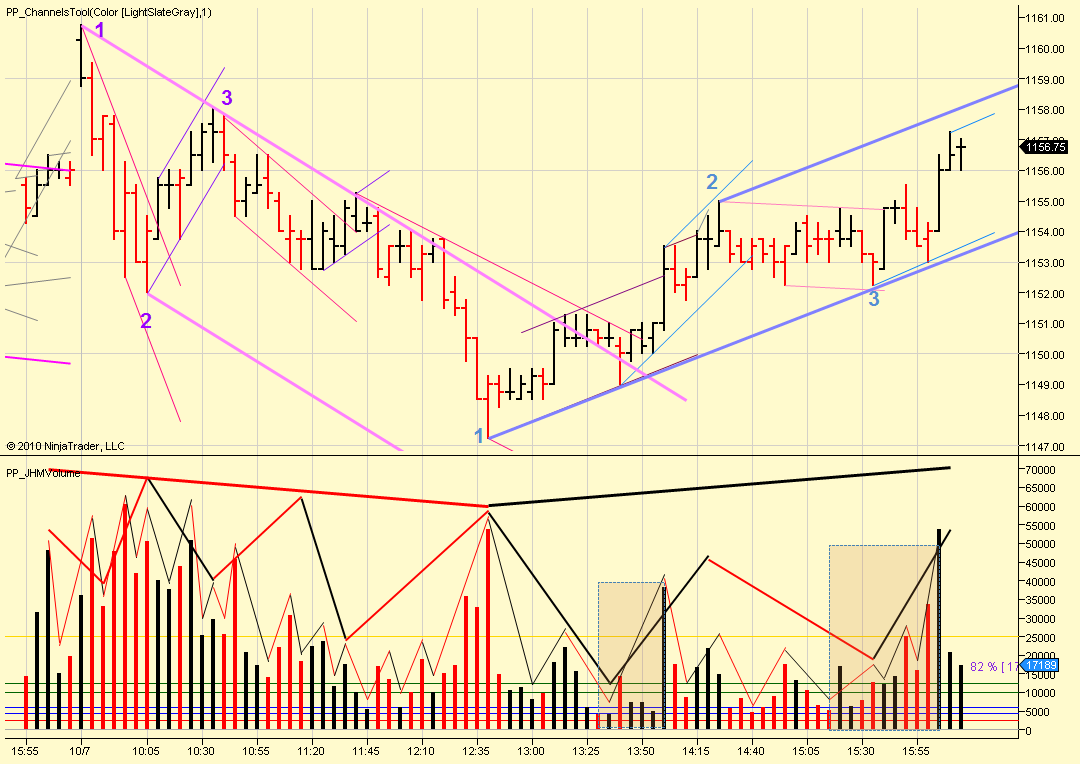
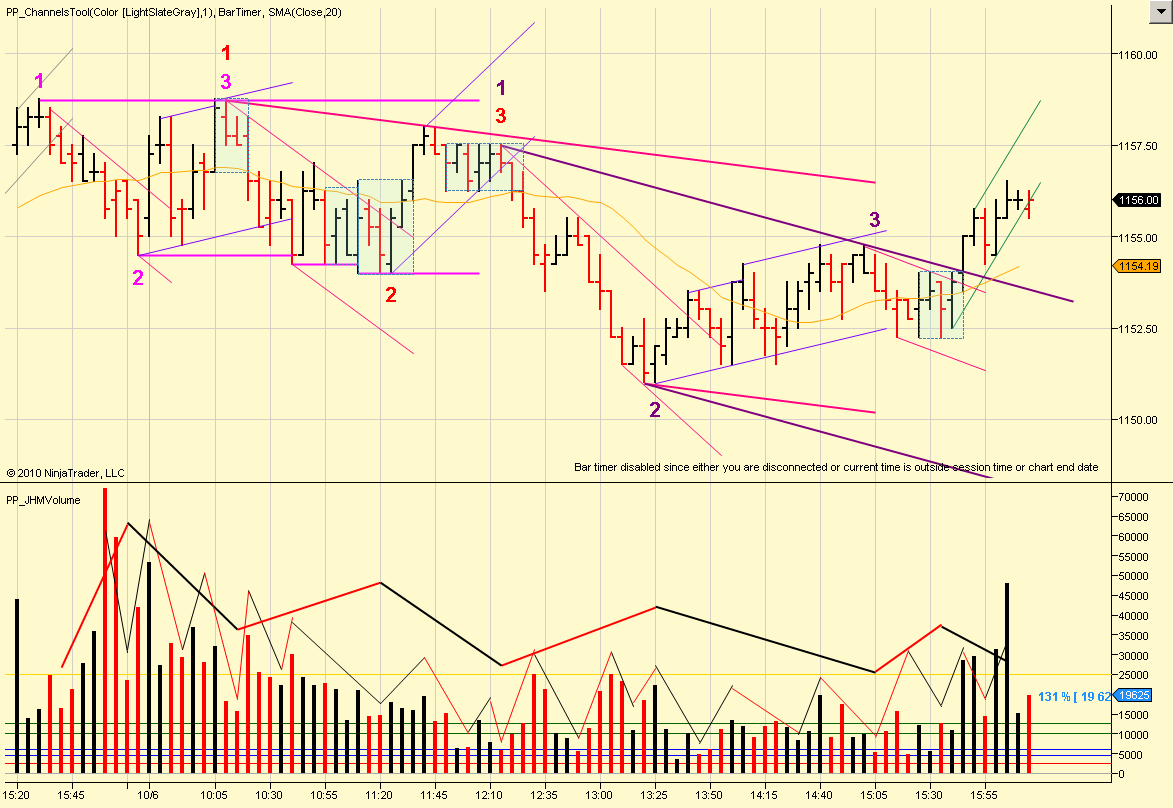
Here's my redraw of the Thursday 10/7/2010 chart.
There are two areas with brown boxes on the volume pane which I am not sure drawn correctly.
Any feed back would be greatly appreciated.
-
You might want to stay focused on yesterday's chart (first with the morning portion) before moving onto more complex examples.Crawl. Walk. Run. Then, Fly.
- Spydertrader
Thanks for the advice.
That is what I've planned for my weekend homework a long with studying other people's charts.
-
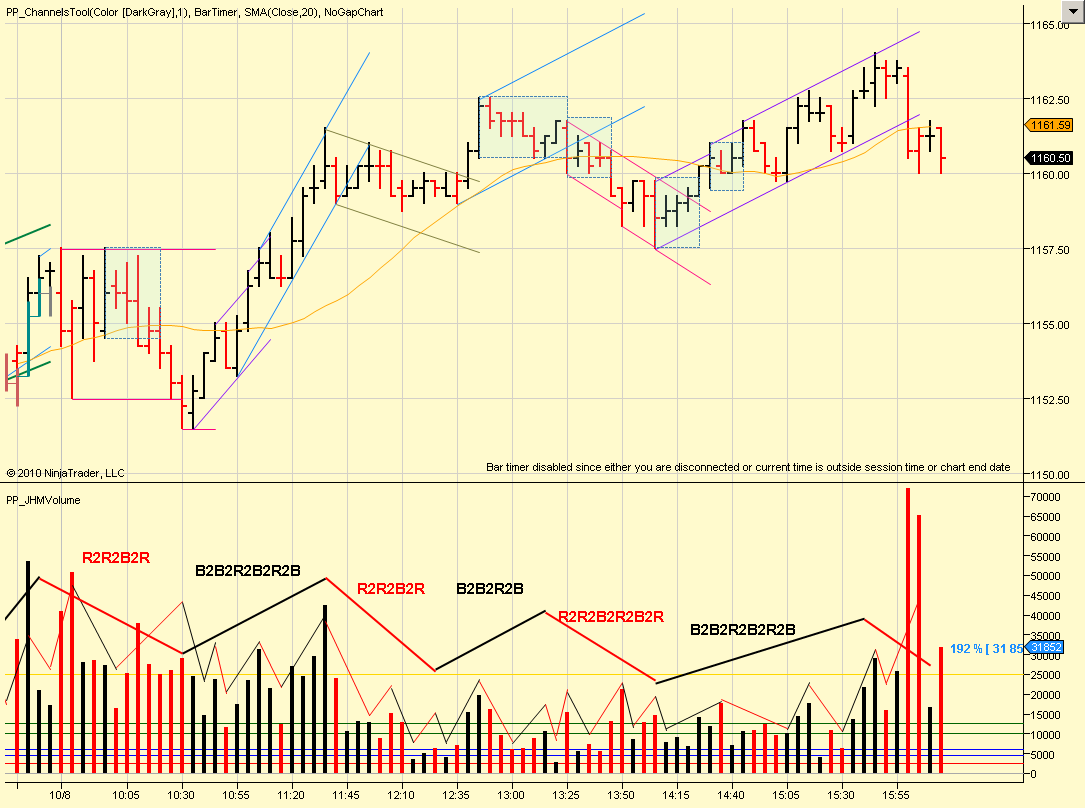
Taking one step at the time and trying to draw Gaussians to match with trend lines for 10/8/2010.
Thanks for your generous help.

-
Incorrect. see attachedThank you for the drawing. Now I know my initial understanding of Gaussians was wrong
I will have to review other people's charts over the weekend to learn to draw my charts correctly.
-
Forget the chart for a moment.
Start at the 'fine' level.
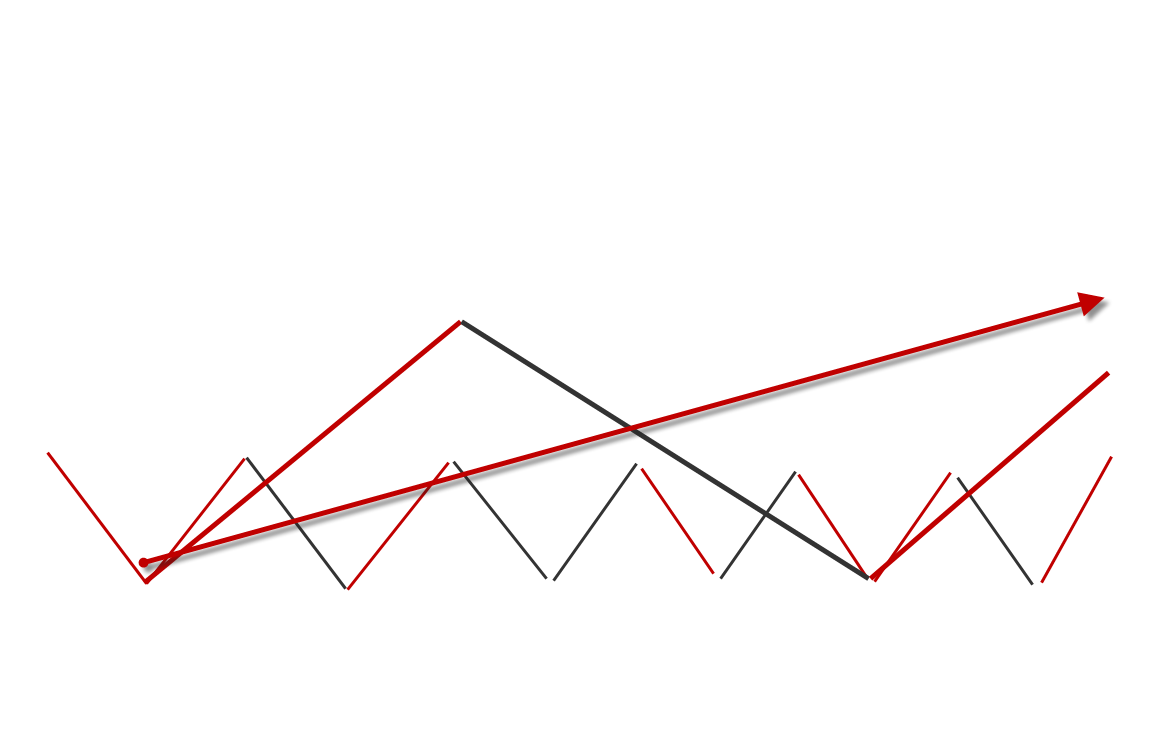
Pull out some blank sheets of paper, and focus on drawing volume gaussians - without any charts around. Move from Point One to Point Two to Point Three and onto the completion of the order of events. Now, do the non-dominant container. Do the dominant container again.
Here's my Gaussians drawing on the paper.
Please let me know if it's incorrect.
Thanks.

-
Before going back to the chart, let me answer your questions.
How do you get to 'Point Two' of something that moves down?How did YOU arrive at point Two?
Spydertrader
Point 2 is at the peak/highest volume of R2R.
Now. The 'Points' of one container find themselves created by some 'thing' formed by a faster level container.What is that thing?
Points 1, 2 and 3 of a faster level container creates the slower level container.
For down move, faster level R2R2B2R is needed to create the slower level container.
-
Look at your chart at the beginning of your annotations. In a previous post, you indicated how to arrive at Point Two. Do your annotations reflect this same assertion? Review your Point Three Annotations. Do your Gaussians show how you answered my previous post?Now go to the thin lines.
What 'thing' forms the various 'points' on the medium lines? How does one arrive at this 'thing' through Volume? Do your lines reflect this?
Sloppy annotation (irrespective of intent) serves no purpose in an environment of purposeful learning.
- Spydertrader
Spydertrader,
Thanks for your feedback.
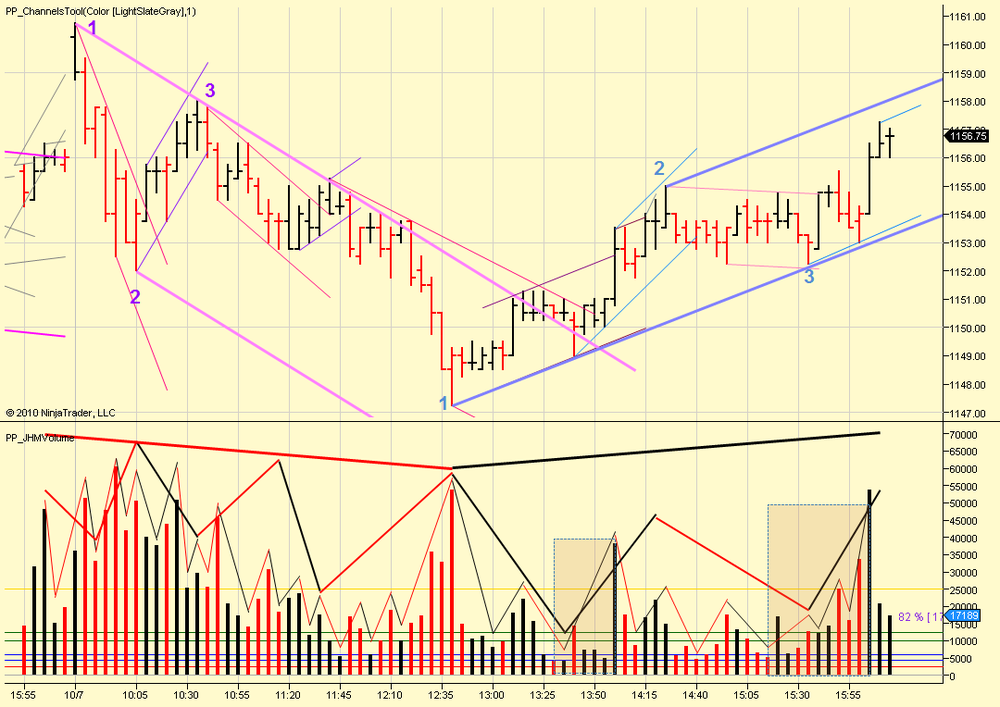
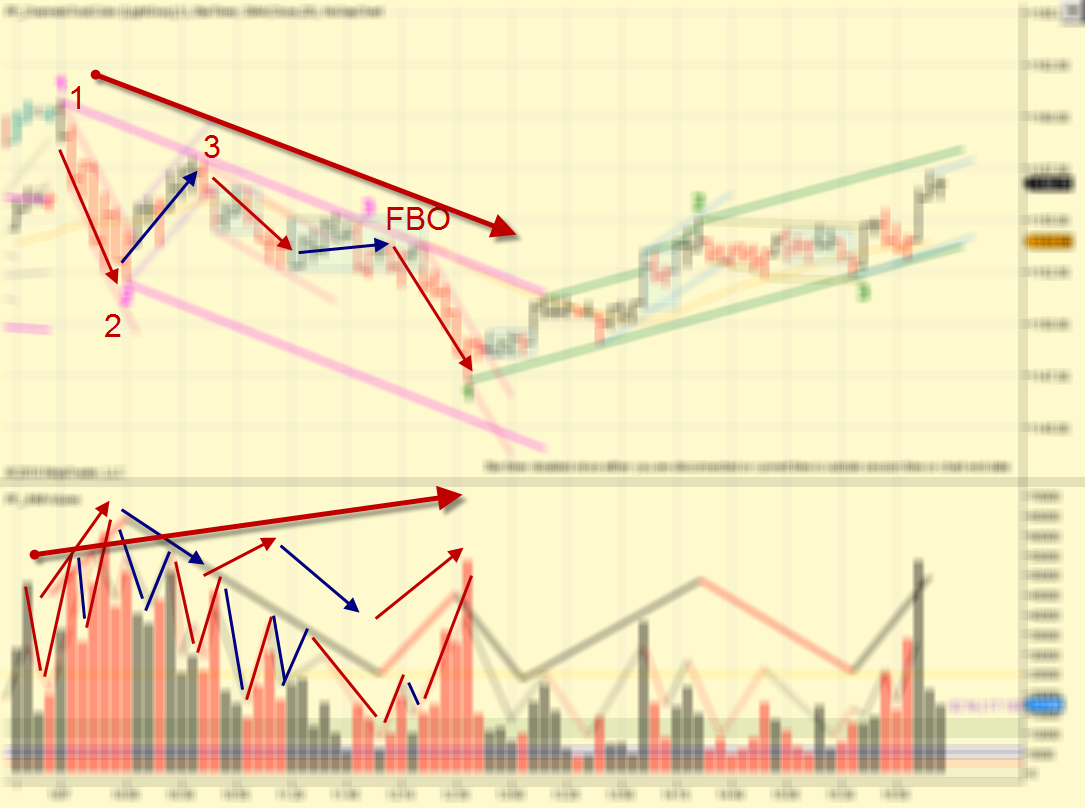
I redrew the annotations and Gaussians lines the way I understood should be done from your questions. I redo only the first part so that if there is still mistakes, I have less chart info to figure out where the mistakes are located.
Please let me know if I am on the right track.
-
My chart for 10/7/2010.
Thanks for viewing my charts, pointing out mistakes and steering me to the right direction.
-
Your Gaussian construction does not match your trend line construction.If the market shows you B2B 2R, where are you?
The market has been reversed it course and the trend line should be up.
If the market shows you R2R, where are you?Down move is dominant and the trend line should be down.
Thanks for your feedback. I'll review my charts.
-
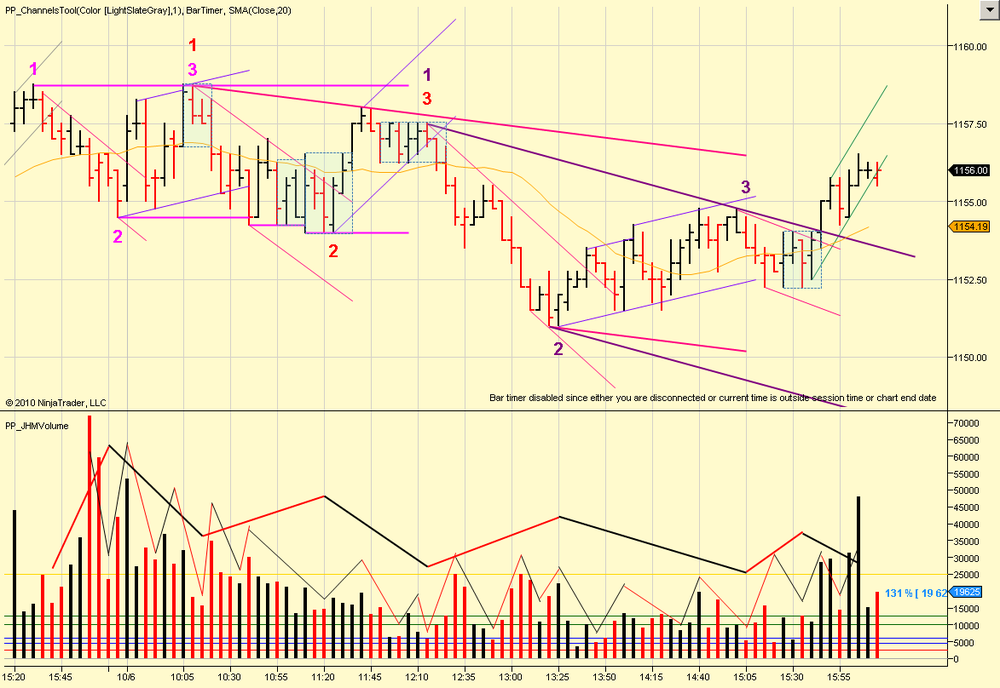
My monitoring of Wednesday 10/6/2010 ES.
Any feed back would be appreciated.
-
Her's my chart for Tuesday 10/05/2010.
I would appreciate it if some one comment on my fractals question and Gaussians drawing.
Thanks.
-
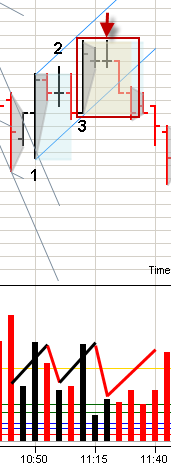
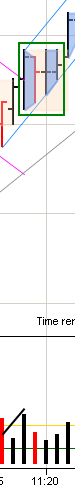
Another lateral at 11:10AM today.
-
Later today I will post the complete days the two laterals were chosen from.Thanks for the drills TIKI.
I will take a shot at the first lateral.
-
One more lateral that meets current topic.Differentiation
Context
Order of events
I would say more bars are needed before the laterals to know which direction both of these laterals will exit.
If the first bar (bar before the lateral) of both laterals are PT1s, then you know the laterals are retraces from PT2 to PT3 and the price will exit in the same direction as PT3.
But if the first bar of the laterals are after PT3 and hence the up cycle is complete, the direction of price will be depending on the order of events inside the laterals.
-
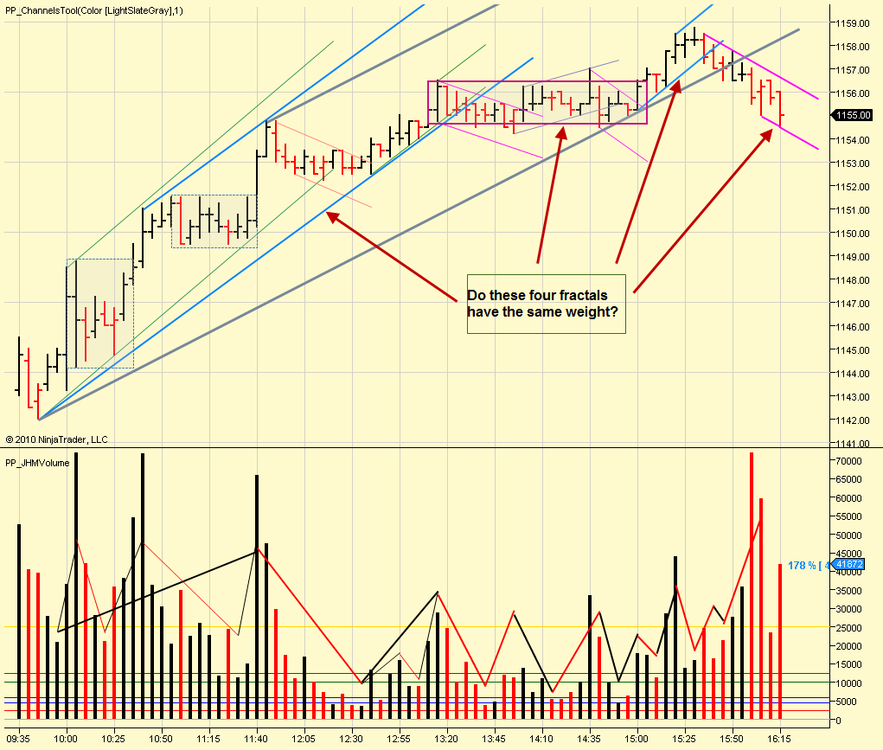
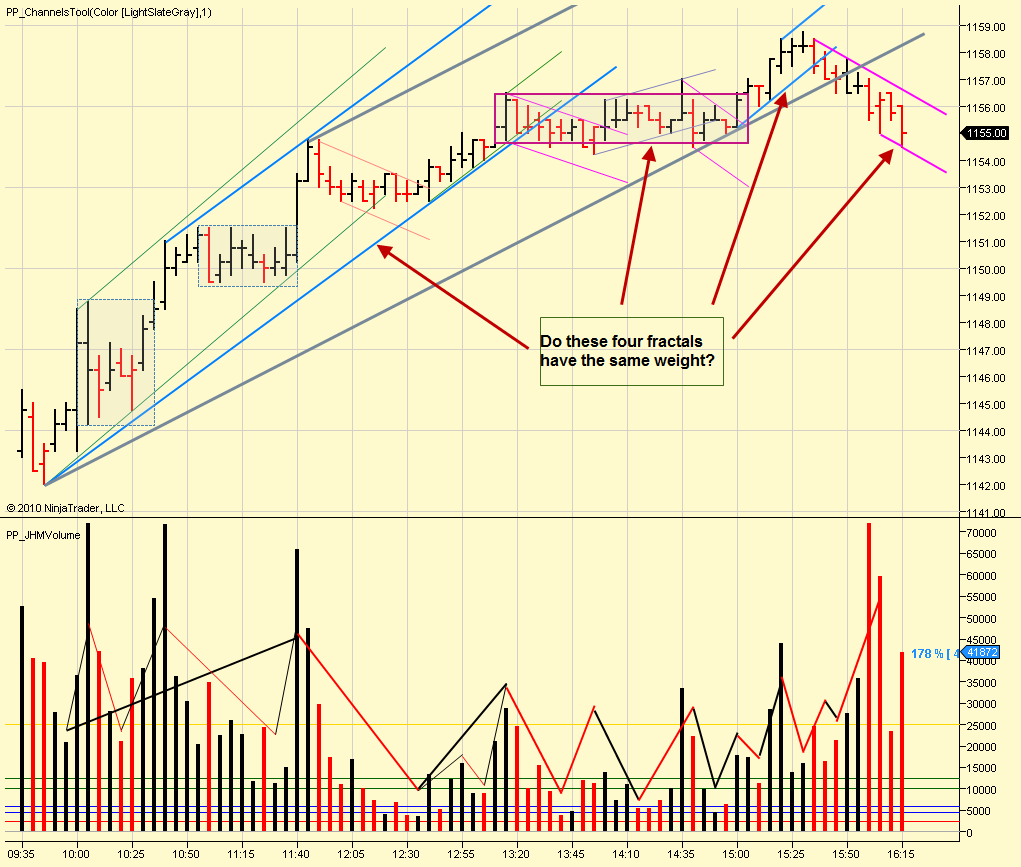
Haven't we ween this before?
-
Can we conclude there for the following differentiations:1. A dominant lateral who's first bar is on decreasing volume that "creates, with" the upper boundary will exit in the opposite direction from which it entered?
2. A dominant lateral who's first bar is on increasing volume that "creates, with" the upper boundary will exit in the same direction from which it entered?
I have not gotten to a point of making these conclusions yet.
I am following Spyder's advise on analyzing the context and order of events.
-
FilterTip and dmk,
Please compare Tiki's yesterday's lateral post with today's 11:10am lateral. Today lateral boundary was created by 11:20 and 11:25 bars. Did you see the same in Tiki's post?
The differences between the two are the way the first bar was formed and the direction the price exited. I hope this help.
-
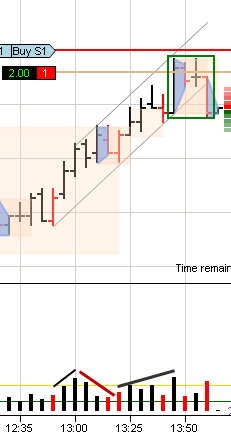
We had the same lateral we are discussing today at 11:10. It was created by a dom pt2 bar and exited the same direction as in WMCN.
-
SpyderTrader,
Thanks for your pointers. I will look deeper into the drills to do more analysis.
Looking at the volume from end of last Friday, today started with decreasing volume going into the lateral which was a non-dom retrace going from PT2 to PT3. There must be a increasing down volume to complete the cycle. This is what happened when the price broke downward with increasing red volume.
-
Today's 9:45 lateral boundary was created by 9:55 bar with a decreasing volume. 10:05 bar tried to break the boundary but failed and price exited the other direction.
-
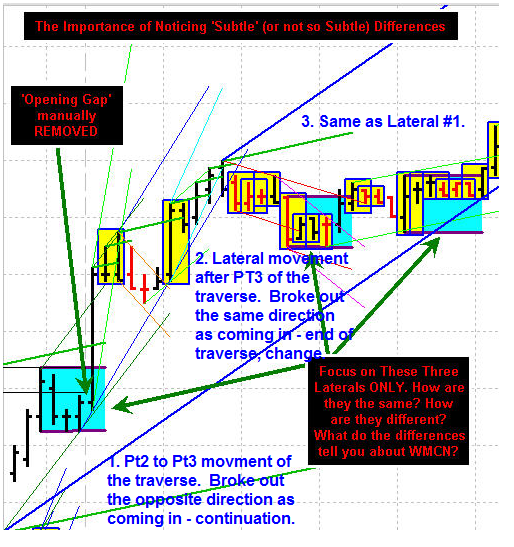
My take on the lateral drill.
#1. Pt2 to Pt3 lateral movement. Broke out the opposite direction as coming in - continuation as PT3.
#2. Lateral movement after Pt3. Broke out the same direction as coming in - end of traverse and change.
#3. Same as #1.


The Price / Volume Relationship
in Technical Analysis
Posted
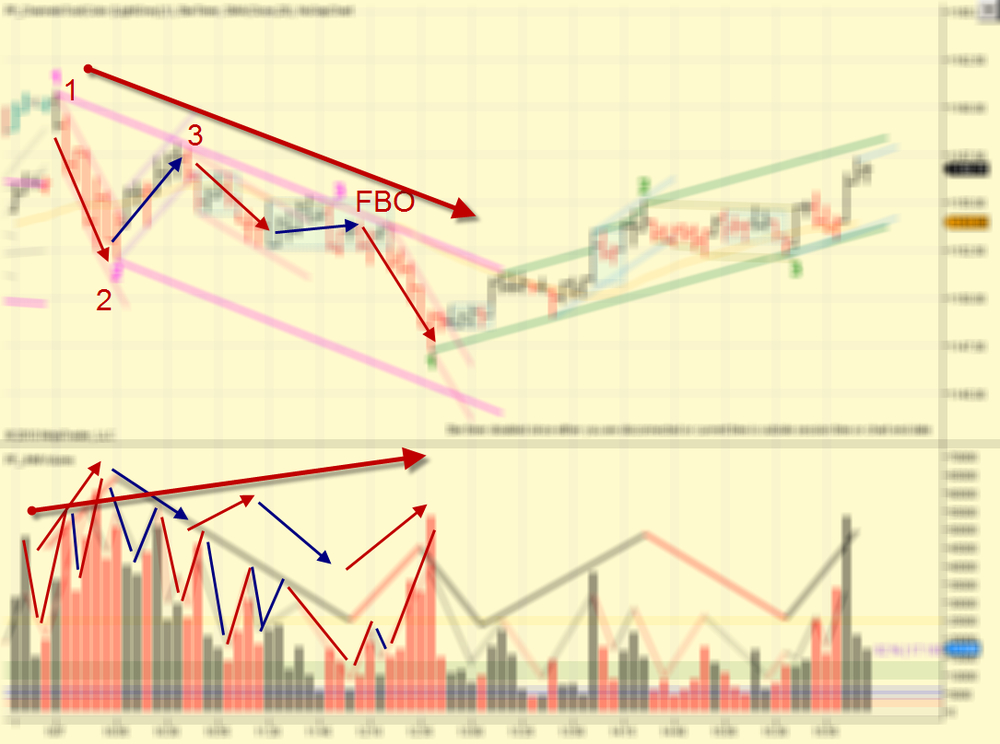
I needto get this drawing correct. Here's another attempt.
Each higher level container is built by 3 lower level containers.