
Welcome to the new Traders Laboratory! Please bear with us as we finish the migration over the next few days. If you find any issues, want to leave feedback, get in touch with us, or offer suggestions please post to the Support forum here.


Ranger
-
Content Count
62 -
Joined
-
Last visited
Posts posted by Ranger
-
-
I queried MC about a week ago regarding global variables - I didn't know about ADE. MC sent me zip file containing much of the same information posted by Tams(nice work!!!).
Anyway, printed the documentation; followed it step by step; followed additional instructions provided on TSSupport forum and here regarding deleting the stock GV from MC and placing the dlls in the MC directory.
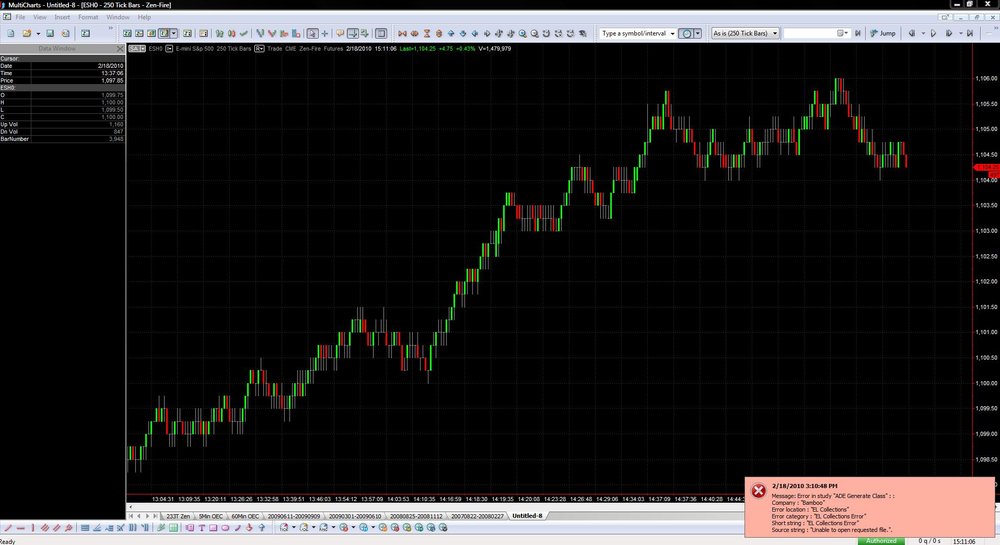
When I followed the instructions on page 9 of "ALL DATA EVERYWHERE", "Creating the Functions and Indicator Manually". I got the error message attached.
MC tried to help but didn't want to spend the time on 3rd party supplied code.
Anyway ... not looking for others to do the thinking for me, however if someone has encountered this error before or might have a lead .... that would be sweet!!!
Ranger
-
Sunshine
I read the posts; I reviewed the links as indicated; I downloaded Tams indicator; (it didn't work on the initial configuration; the code looked sound(Tams does awesome work).
Anyway, other fish to fry ...
any ideas on scalper exits or do we accept what others tell us - use a 4pt stoploss on e-minis.
-
@ Blow Fish “Tact is the art of making a point without making an enemy.” Sir Isaac Newton.
@ Chloe - awesome that StatSign made that mod .... that should work.
@ Tams - Nice work on all your contributions ...
-
Statsign
thanks for the modifications - glad you were able to help chloe.
Ranger
added inputs for session times{plots previous day hi/low/close - open {x} out below} {plots camarilla lines} {rev date 07aug09} input: Sessstart(1803),sessend(1615); variables: Var0( 0 ) , var1( 0 ) , var2( 0 ) , var3( 0 ) , var4( 0 ) , var5( 0 ) , var6( 0 ) , var7( 0 ) , var8( 0 ) , sessreset( false ) , camarillareset( false ) ; sessreset = t = sessend; camarillareset = t = sessstart; if sessreset then begin var0 = var0 + 1 ; var1 = var2 ; var3 = var4 ; var5 = var6 ; var7 = close; end; if camarillareset then begin var2 = open ; var4 = high ; var6 = low ; end else begin if high > var4 then var4 = high ; if low < var6 then var6 = low ; end ; condition1 = var0 >= 2 and bartype < 3 ; value10 = ((var3 - var5)*(1.1/2)) + var7 ; {h4} value20 = ((var3 - var5)*(1.1/4)) + var7 ; {h3} value30 = ((var3 - var5)*(1.1/6)) + var7 ; {h2} value40 = ((var3 - var5)*(1.1/12)) + var7 ; {h1} value50 = var7 - ((var3 - var5)*(1.1/12)) ;{l1} value60 = var7 - ((var3 - var5)*(1.1/6)) ;{l2} value70 = var7 - ((var3 - var5)*(1.1/4)) ;{l3} value80 = var7 - ((var3 - var5)*(1.1/2)) ; {l4} if condition1 then begin plot1( var1, "y-o" ) ; plot2( var3, "y-h" ) ; plot3( var5, "y-l" ) ; plot4( var7, "y-c" ) ; plot10( value10, "h4" ) ; plot20( value20, "h3" ) ; plot30( value30, "h2" ) ; plot40( value40, "h1" ) ; plot50( value50, "l1" ) ; plot60( value60, "l2" ) ; plot70( value70, "l3" ) ; plot80( value80, "l4" ) ; end ; -
this is funnyreally funny
i am not trying to be sarcastic,
i am not a programmer, i know the pain you are going through.
but if you would just stop banging your head... and R-E-A-D,
you will find that the 2 really nice regular contributors here
have already given you the answer to your problem in post #2 and post #3.
(or should I say, pointed you to the right direction)
in case you still don't understand what they are talking about,
let me paraphrase...
Your request is not unique, nor was it asked the first time.
Various methods have been discussed.
The solution to your quest has already been DONE.
The code is posted in the "thread".
You can adjust it to meet your need.
The name of the thread is called "plotting globex highs and lows" or something like that...
Furthermore, there are several interesting approach to solve the problem,
and they are all presented in the thread.
hope the above helps
Tams
Gone through allot of your programming solutions and excellent tips.
You do nice work!
-
Chloe I think the reason people are reticent is that you are expecting them to spend time to help but you are "too busy" to try to help yourself. I guess you can see how this might look lazy? If you are too busy to devote any time to this then perhaps you should wait until you have half an hour or so to spare?The thread has the answers you seek. If you have difficulty understanding them then I am sure people will help you. They are unlikely to help if you have not done anything to help yourself. Actually strike that, looks like you have got ranger to waste there time re-inventing the wheel for you.
Blow Fish
Actually Blow Fish, if I consider it time well spent, how can you judge from me that it's a waste of my time? If I can help Chloe, I will and thanks for mentioning the link again... I'll check it.
Anyway, I know that you're a good contributor as are the others and thanks for the comments.
And it's Ranger not ranger.
-
Hi Chloe
Oh Boy ... you may need to renew your fan base. Perhaps send them chocolate chip cookies or hemlock ;o)
OK, I understand the issue more clearly .... let me see, if I can help you.
Cheers!!! michael
-
Hi Chloe
Take a look at this simple code. It plots Camarilla Lines and Yesterdays OHLC(Open rem out)
Perhaps put this on your other contracts and if it works for you then you can modify the arithmetic to account for your pivots.
If you need some additional help - check me back!
{Plots previous day Hi/Low/Close - Open {x} Out below}
{Plots Camarilla Lines}
{Rev date 07Aug09}
variables:
var0( 0 ) ,
var1( 0 ) ,
var2( 0 ) ,
var3( 0 ) ,
var4( 0 ) ,
var5( 0 ) ,
var6( 0 ) ,
var7( 0 ) ,
var8( 0 ) ;
if Date <> Date[1] then
begin
var0 = var0 + 1 ;
var1 = var2 ;
var3 = var4 ;
var5 = var6 ;
var7 = Close[1] ;
var2 = Open ;
var4 = High ;
var6 = Low ;
end
else
begin
if High > var4 then
var4 = High ;
if Low < var6 then
var6 = Low ;
end ;
condition1 = var0 >= 2 and BarType < 3 ;
value10 = ((var3 - var5)*(1.1/2)) + var7 ; {H4}
value20 = ((var3 - var5)*(1.1/4)) + var7 ; {H3}
value30 = ((var3 - var5)*(1.1/6)) + var7 ; {H2}
value40 = ((var3 - var5)*(1.1/12)) + var7 ; {H1}
value50 = var7 - ((var3 - var5)*(1.1/12)) ;{L1}
value60 = var7 - ((var3 - var5)*(1.1/6)) ;{L2}
value70 = var7 - ((var3 - var5)*(1.1/4)) ;{L3}
value80 = var7 - ((var3 - var5)*(1.1/2)) ; {L4}
if condition1 then
begin
Plot1( var1, "Y-O" ) ;
Plot2( var3, "Y-H" ) ;
Plot3( var5, "Y-L" ) ;
Plot4( var7, "Y-C" ) ;
Plot10( value10, "H4" ) ;
Plot20( value20, "H3" ) ;
Plot30( value30, "H2" ) ;
Plot40( value40, "H1" ) ;
Plot50( value50, "L1" ) ;
Plot60( value60, "L2" ) ;
Plot70( value70, "L3" ) ;
Plot80( value80, "L4" ) ;
end ;
-
Hi all,Managed to obtain a MC license for myself. Im particulary interested in seeking help converting this indicator Blu-Ray created in a seperate forum. It is similar to TradeFlow provided by CQG. If anyone can help convert this to MC format it would be appreciated. Im still new to MC so will take some time getting used to. Thanks.
James
Ditto - I tried to import using my MC editor. There are no function; indicators or signals. Perhaps you provide some screen shots or simply provide a text version of the indicator code.
-
Any deadline / EPA for fixing this issue? 1 month / 2 months / 3 months / 6 months / 12 months?I used to be an OEC customer. When their datafeed started costing me trades, I queried them. In fact, I was so pissed that I contacted their CEO and VP of operations via e-mail to express my opinion of them rolling-out a new product without sufficiently validating its reliability. I got a response from both but the problems continue.
Their datafeed is simply a deal breaker. I love OECs platform; it's more stable than NT in my opinion and their DOM is great but if you can't get reliable information or their servers are down, it's useless.
I received the same answers as posted here previously but that was back in Oct-Dec09.
Here's what they put on their website - it seems partially untrue based on my experience.
I have a Zen Fire connection now .... it's awesome. Unfiltered and reliable.
Active Traders
Active traders know their success is built on a foundation of Technology and Service. OEC was built on these principles. The OEC Trader was built by active traders for active traders.
OEC offers the keys to unlocking your successful trading strategy:
Speed – Our Direct Connections to the exchanges and cutting edge technology ensure the fastest executions and confirmations. We understand that for active traders, milliseconds matter.
Reliability – Our investment in our data center and infrastructure means you never have to worry about down-time and broken connections.
Functionality – The OEC Trader is the market leader in cutting edge functionality that gives you an edge in your trading with no software fees.
Support – OEC offers professional, efficient 24 Software Support and a 24 Hour Trade Desk to answer any questions you may have.
Technical Highlights
The OEC Trader provides a rich set of functionality not commonly found in one trading platform today. Learn more about our Electronic Trading System – OEC Trader
-
I purchased and use the ATO method. I programmed the indicator in Easy Language and backtested it over a few years. My partner programmed the same in Ninja Trader(he also purchased ATO), and he backtested it too. We compared results and found them similiar. We both trade the method and relating specifically to ATO, that's all I feel comfortable posting.
Having said that, I can share:
1) some general comments on Breakout Systems;
2) a good breakout method here in PDF, the 15Min Opening Range Scalp;
3) associated indicator and signals in EL for your use. Both can be modified and stepped over different time frames to find the best entry time frame. The exit signal may require a little love and attention.
Note **********:
a) Backtest results on the Breakout System outlined in the attached document and the ATO demonstrate that the systems make winning trades but filtering the trades prior to entry improves their results substantially. See below for filtering.
b) Filtering: Breakout systems require a confirmation of a breakout(not a market head fake). How one confirms this is a matter of trading style and experience.
c) Filtering: I recommended a review of Price Levels that could work as RESISTANCE to the breakout ie OHLC and Intra-day(previous) Price Levels. I don't typically take the trade, if PRICE LEVELS OHLC fall too close 1-2 points from the intended direction of my trade because of the risk of reversal.
d) Filtering: I also don't take the trade, if there's huge movement from one level to the other because of the risk of reversal (6-8pts).
e) Filtering: I rarely enter the trade unless, I have a confirmation of trend using the 250T. In many cases using the Breakout method, price will have to retrace to pick-up your price, make sure it's trending in your direction first before entering.
f) I also recommend identifying placement points for averaging-in or Stop Loss. If price moves against you the choices are few. (1) average-in with hope of bailing on a retracement; (2) Stop-Out; (3) stay in the trade and hope for good results. Having a disciplined approach will improve performance.
g) I find that unless PRICE breaks-out as intended or if the trade starts to work against me, I typically quickly adjust my Profit Target and bail at a tick profit ... re-entering is cheap insurance, if I was wrong.
h) I follow the Price Levels on a 5 Min Chart but track every tick and trend on the 250T, when in the trade. I have AutoTrend Lines; Volume(looking for high volume to indicate potential reversal).
Watch for PRICE CONFIRMATION on the Breakout; Don't be afraid to enter 2 Ticks above the levels following trend confirmation; don't be afraid to bail on a trade that's questionable to you; if price continues to tick and tick at a certain Price Level ... hmmm - you're probably not the only one thinking about what to do next - follow volume.
If you reference the attached document, (15) Minute Open Range Scalp Method, you will have a comparable system OR Breakout Method. EL indicator and signals attached for reference. Perhaps you can improve on the performance following backtest.
Hope this was helpful.

Global Variable V2.2
in Trading Indicators
Posted
Thanks Tams - tried that without much luck. Based on other postings, I think that I'll stick with the use of global variables for now. I'm essentially transfering variable data (permissives for entry signals) to my signals using other time frames.
Thanks for taking time to provide input ...... your comment about posting in the appropriate thread led me answer my own question ... ;o)
Ranger