
Welcome to the new Traders Laboratory! Please bear with us as we finish the migration over the next few days. If you find any issues, want to leave feedback, get in touch with us, or offer suggestions please post to the Support forum here.


Ranger
-
Content Count
62 -
Joined
-
Last visited
Posts posted by Ranger
-
-
Hi UB
Thanks for sharing the Haar ELD, that was nice of you and thanks for your valuable insight.
We locked our Haar file to constrain our strategy. In our posting, it's clear that we want other contibutors to join our team with the objective of producing good trading strategies because without a good trading strategy, traders are doomed to failure.
We have shared a couple strategies that can be easily modified; optimized and further used in conjunction with the trader's other methods or for educational purposes. The code is open source and simple. That's our contribution - strategies.
Can you help the forum by sharing a strategy that you developed?
Regards,
RANGER
-
Hi Forum Members
MC has been unable to resolve the issue with our last strategy. They worked on my computer for a couple of hours ... reported that they understood the issue but as of yesterday, they said they had nothing new to report. All posted strategies work in TS 8.
We pulled together this simple strategy for use in TS and MC. We also included txt files with code for functions etc, so those of you that may want to recode the strategy in another platform can do it.
We give credit to those who provided functions; indicators and other code fragments which helped us complete this strategy.
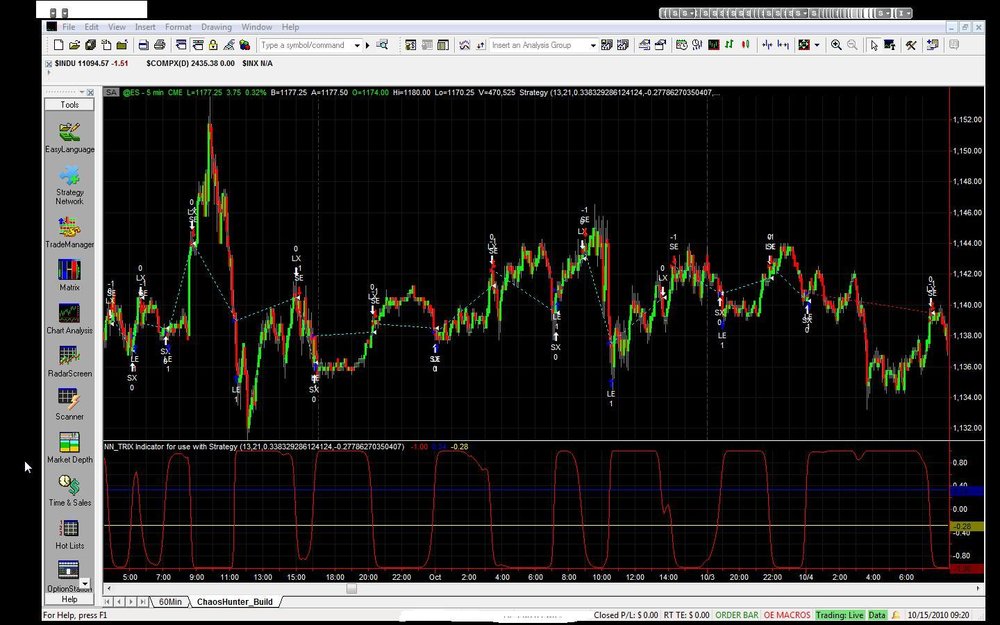
Note:
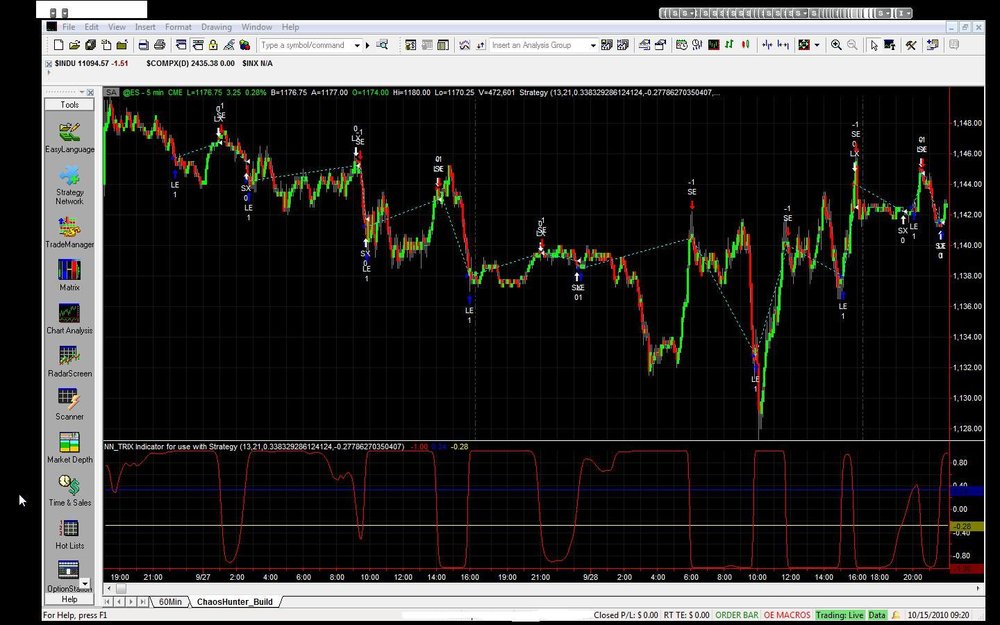
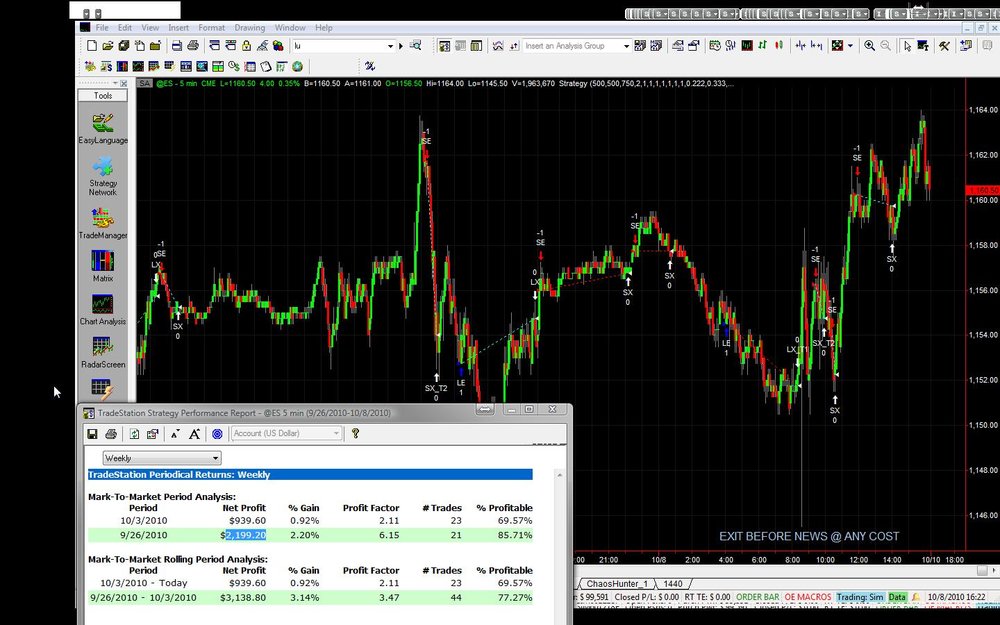
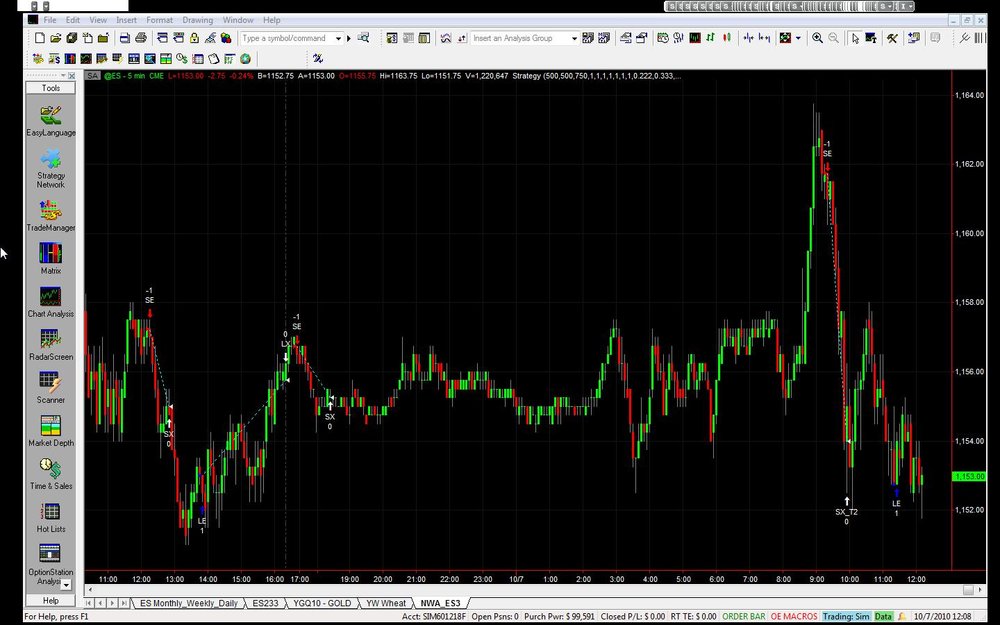
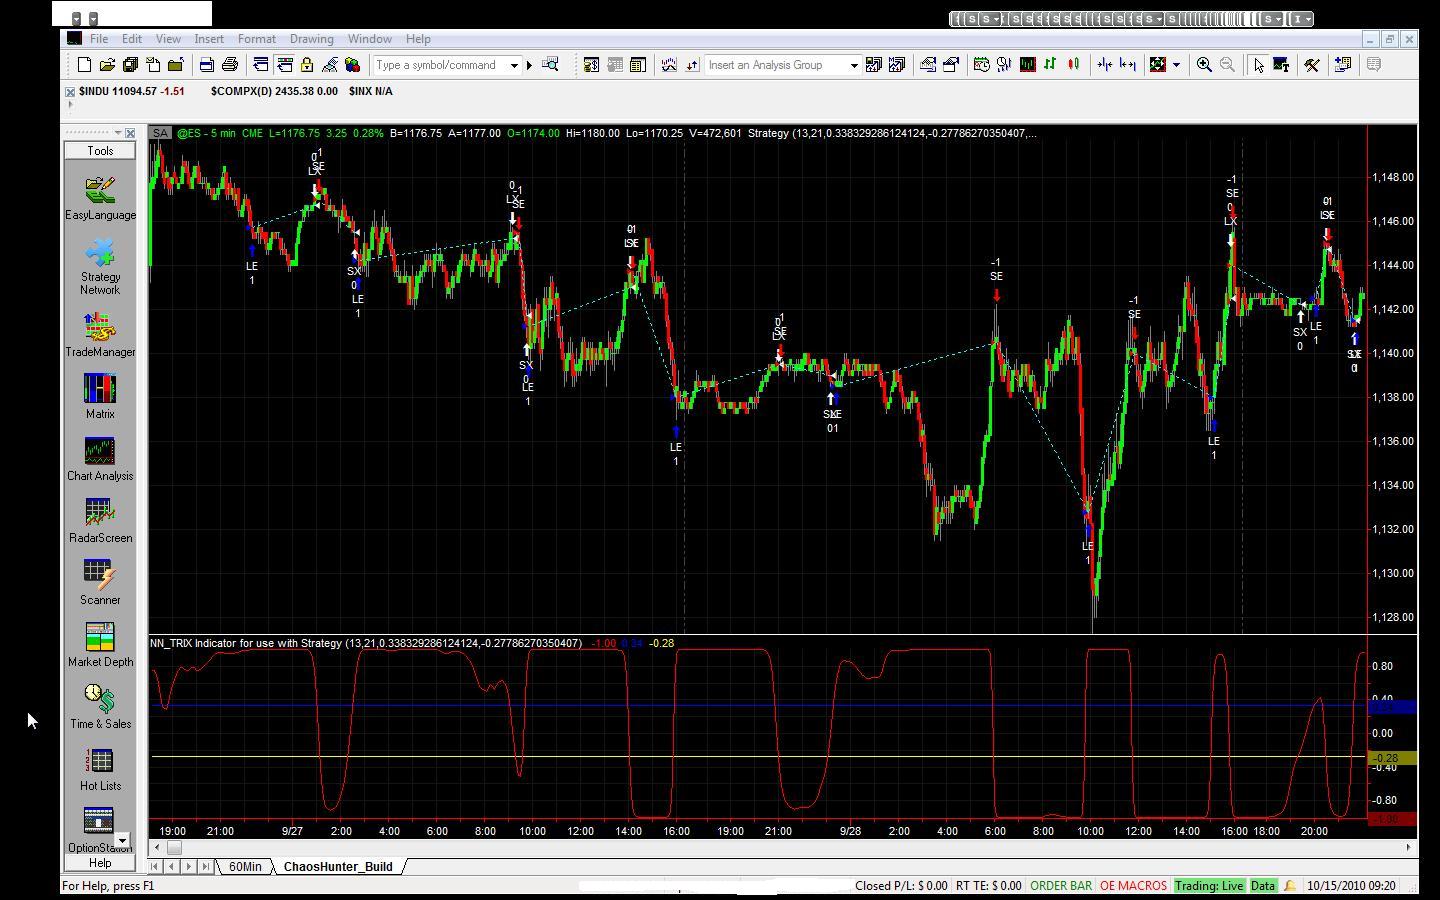
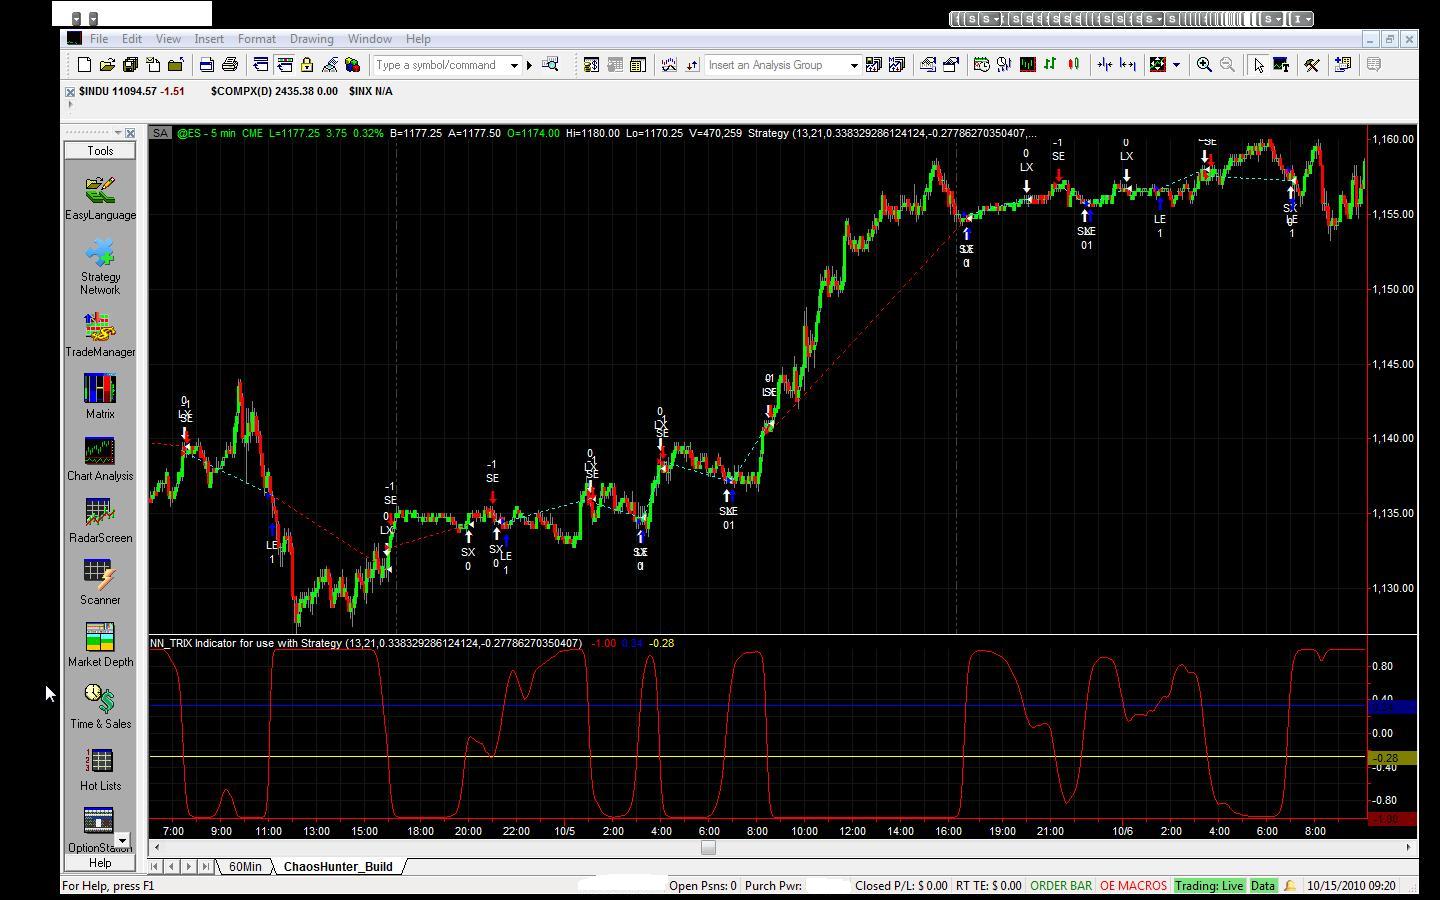
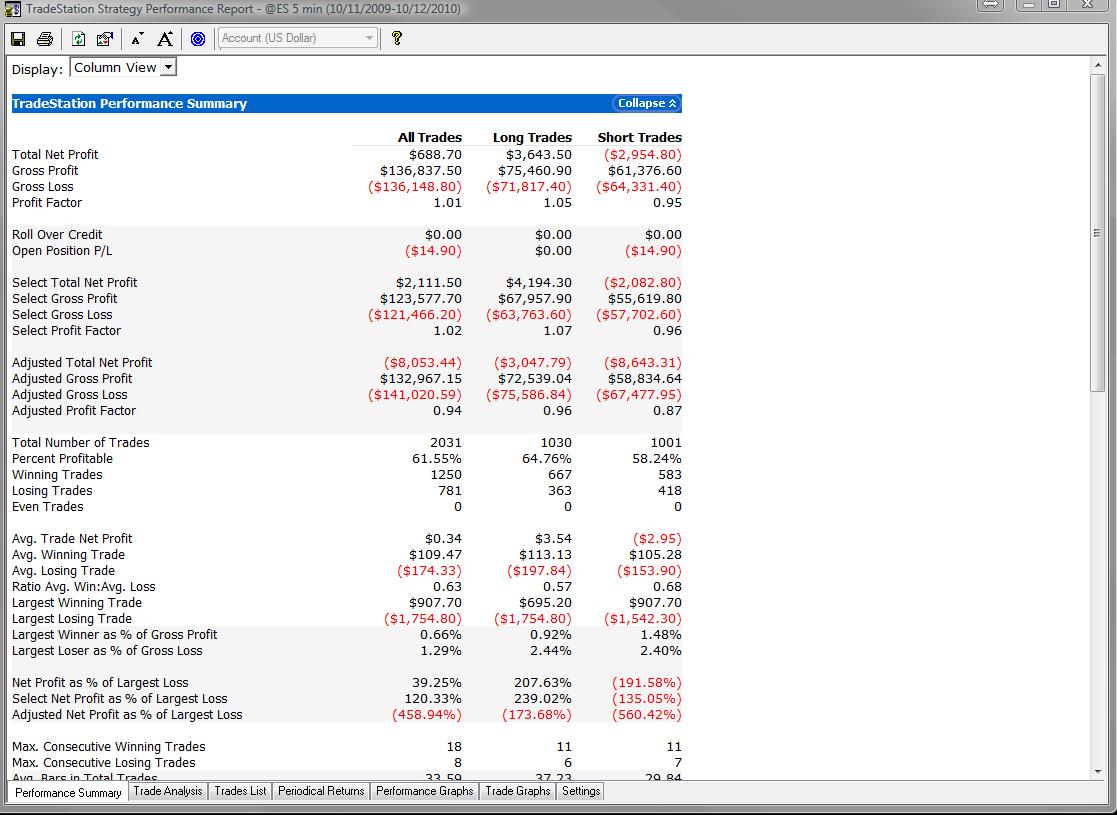
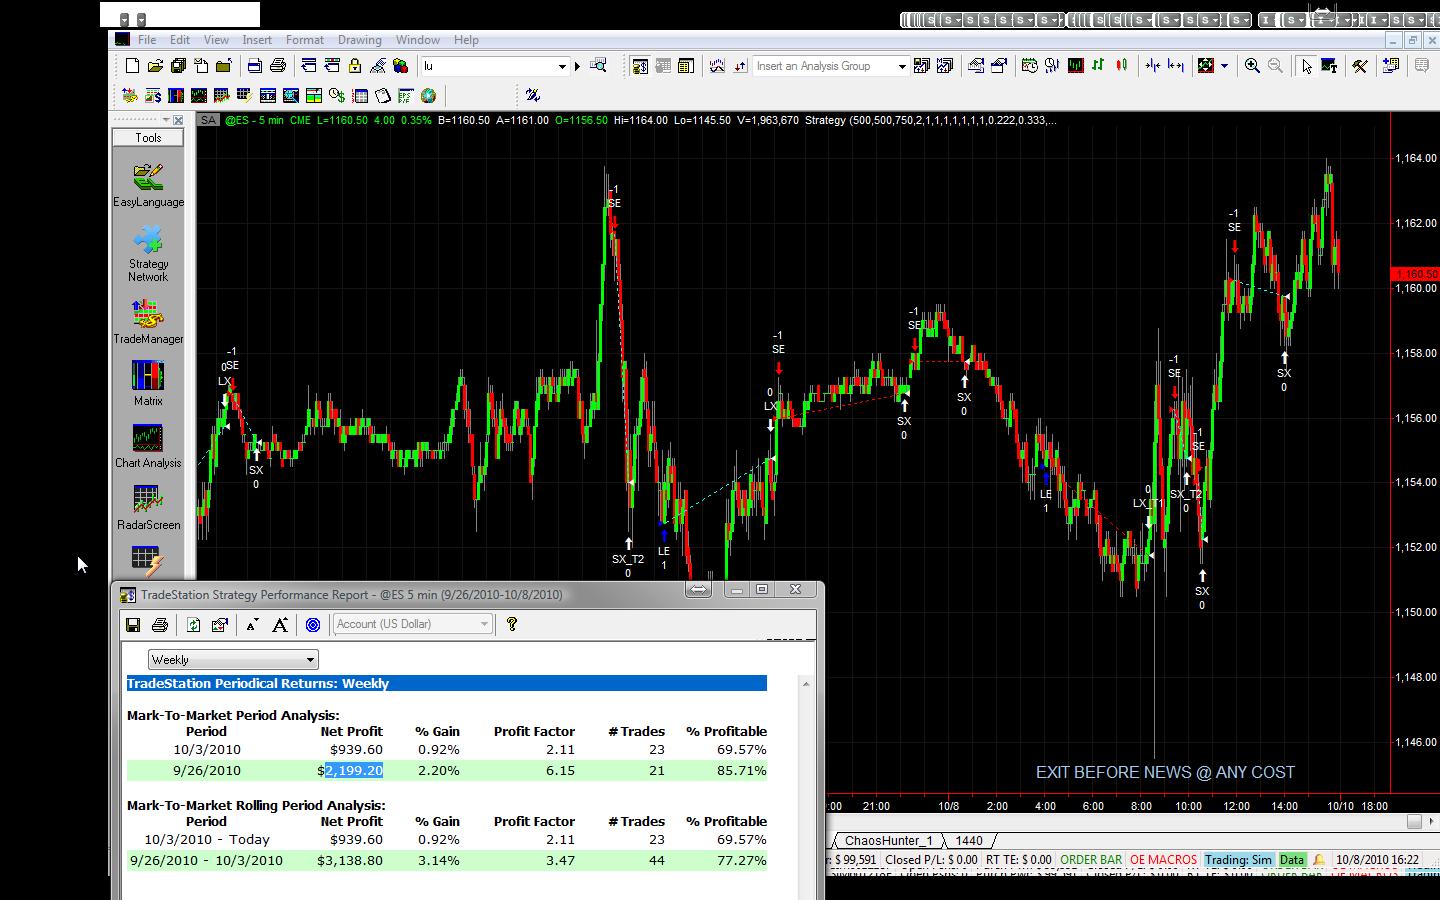
a) Employ on 5Min ES Chart.
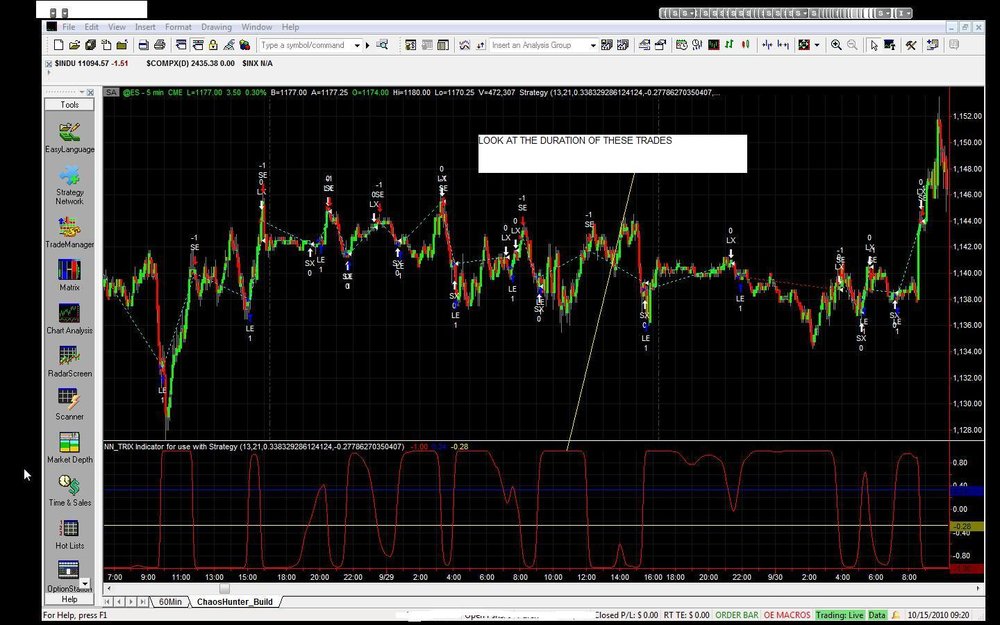
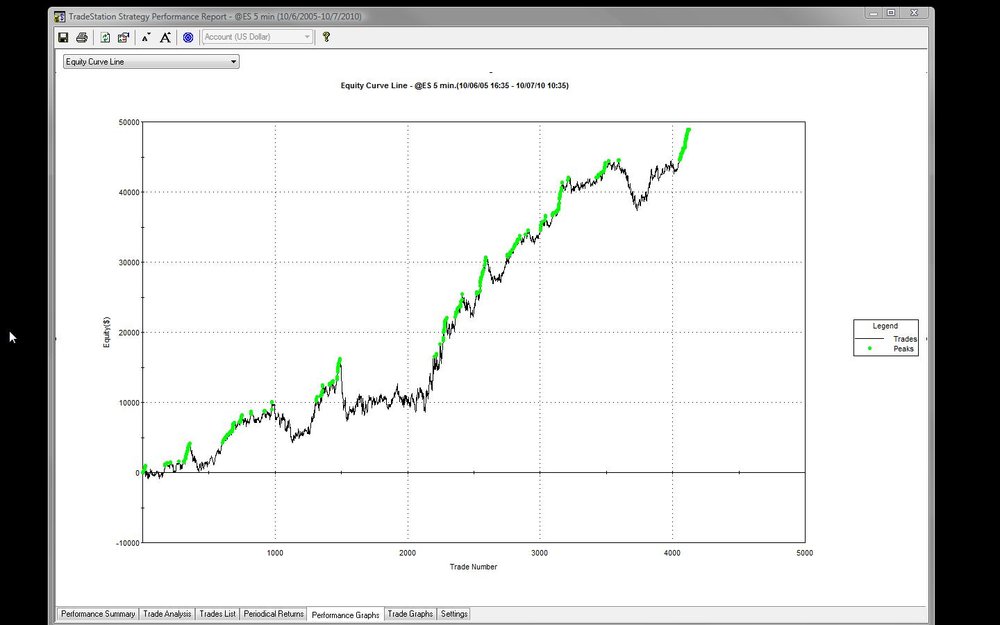
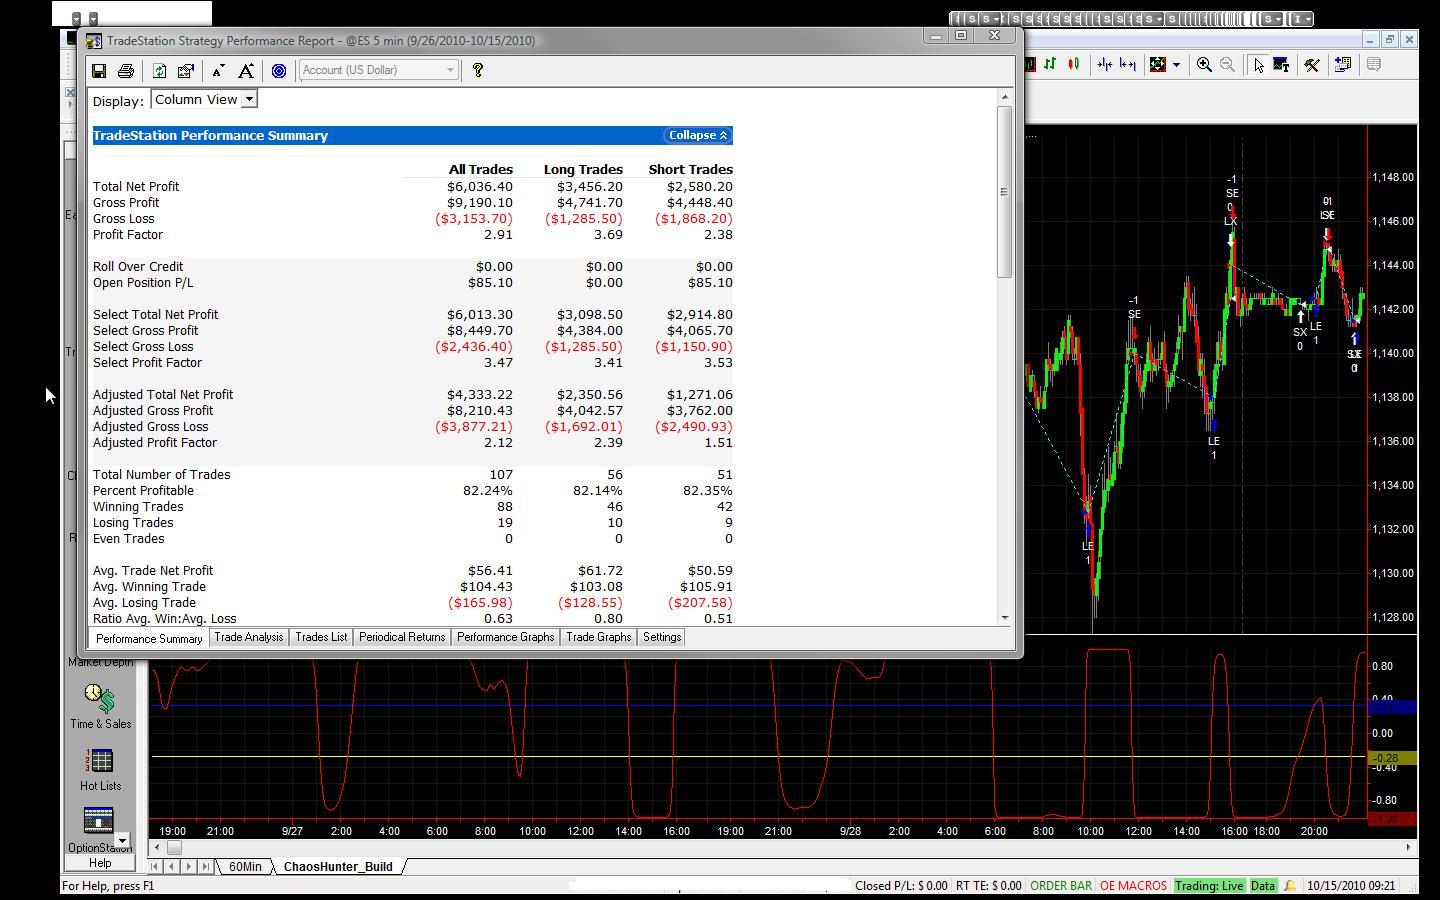
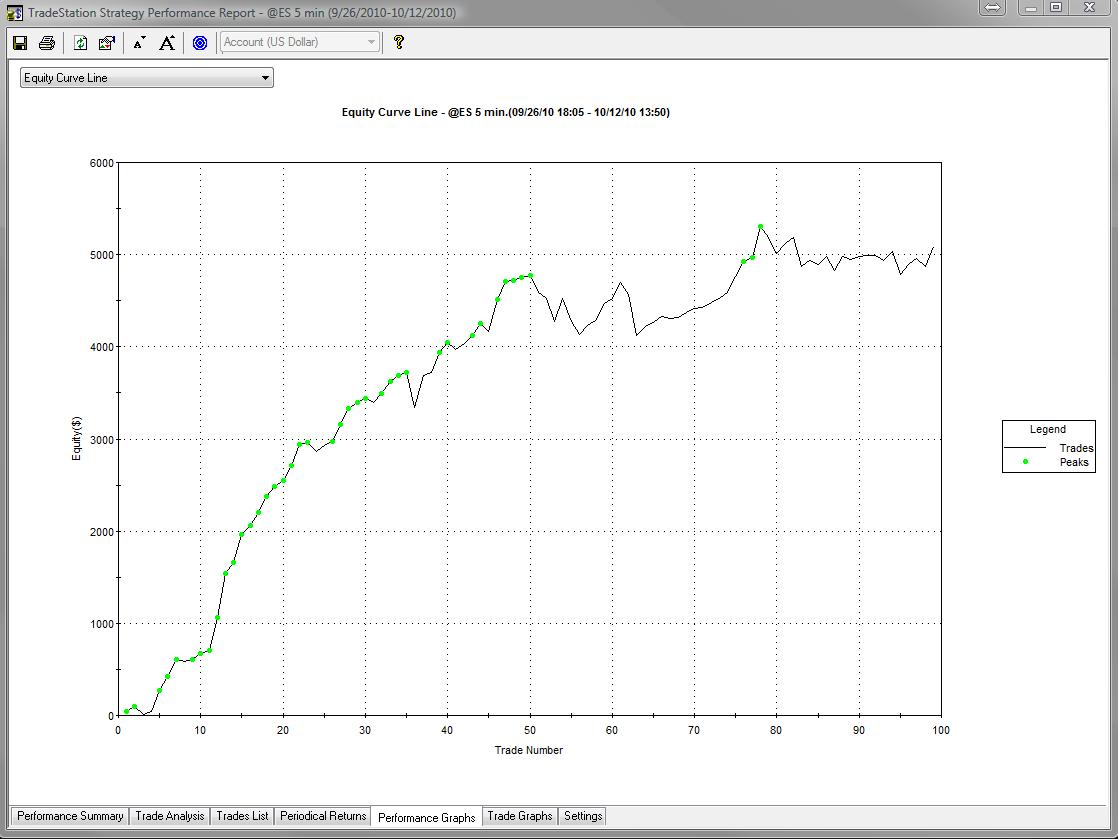
b) 5 yr back testing doesn't look particularly hot but short term duration optimization makes this little strategy hot.
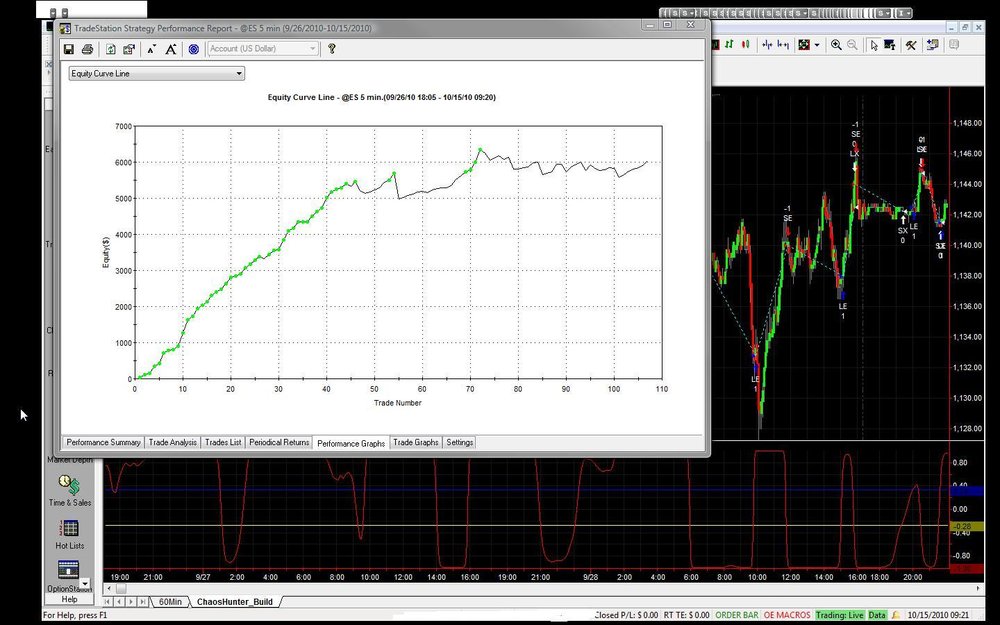
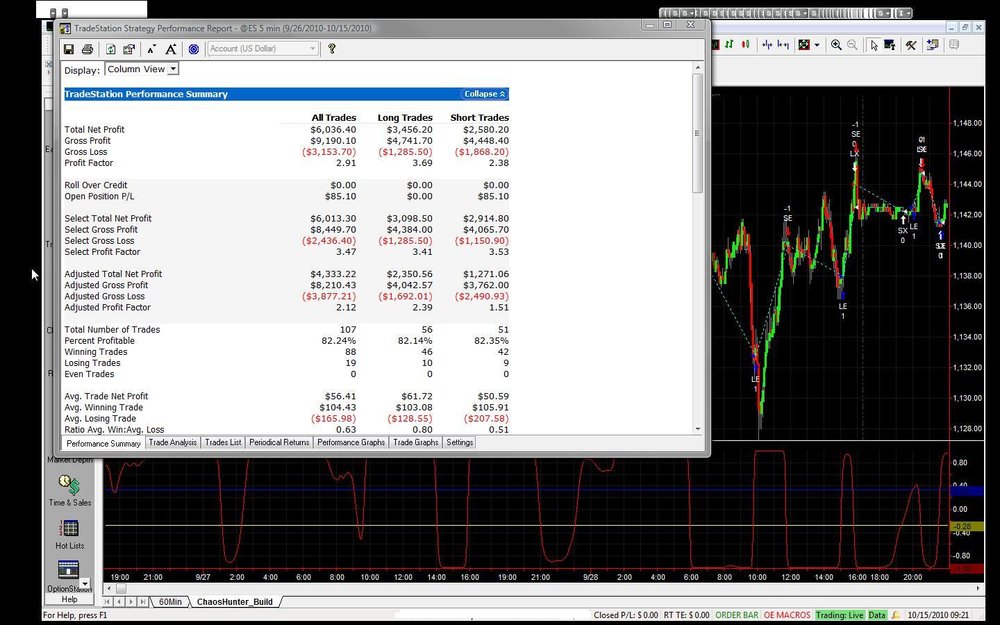
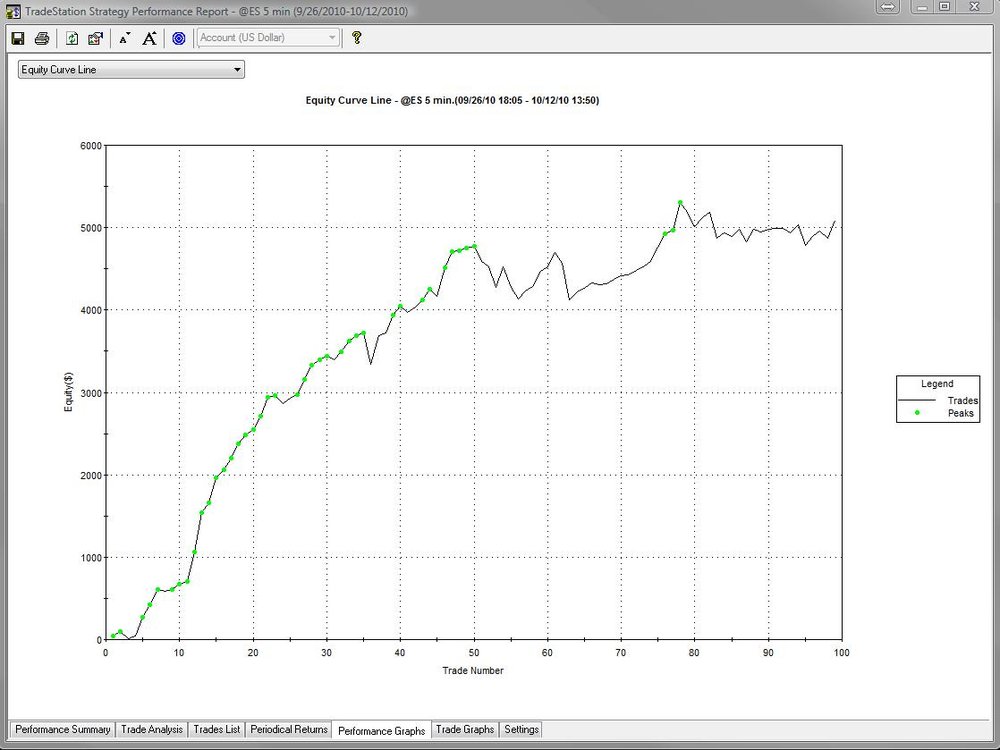
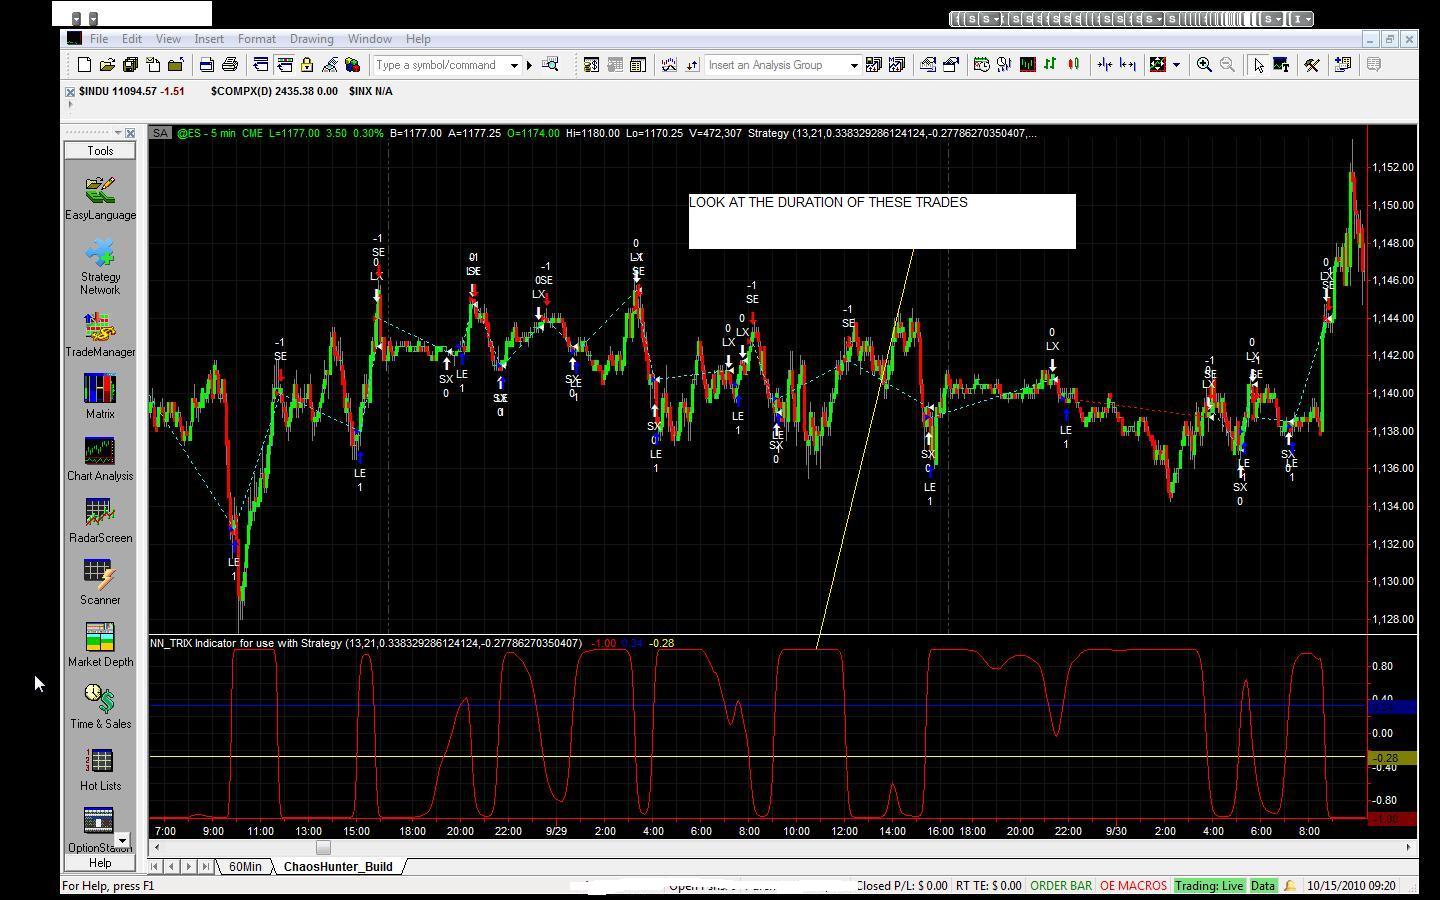
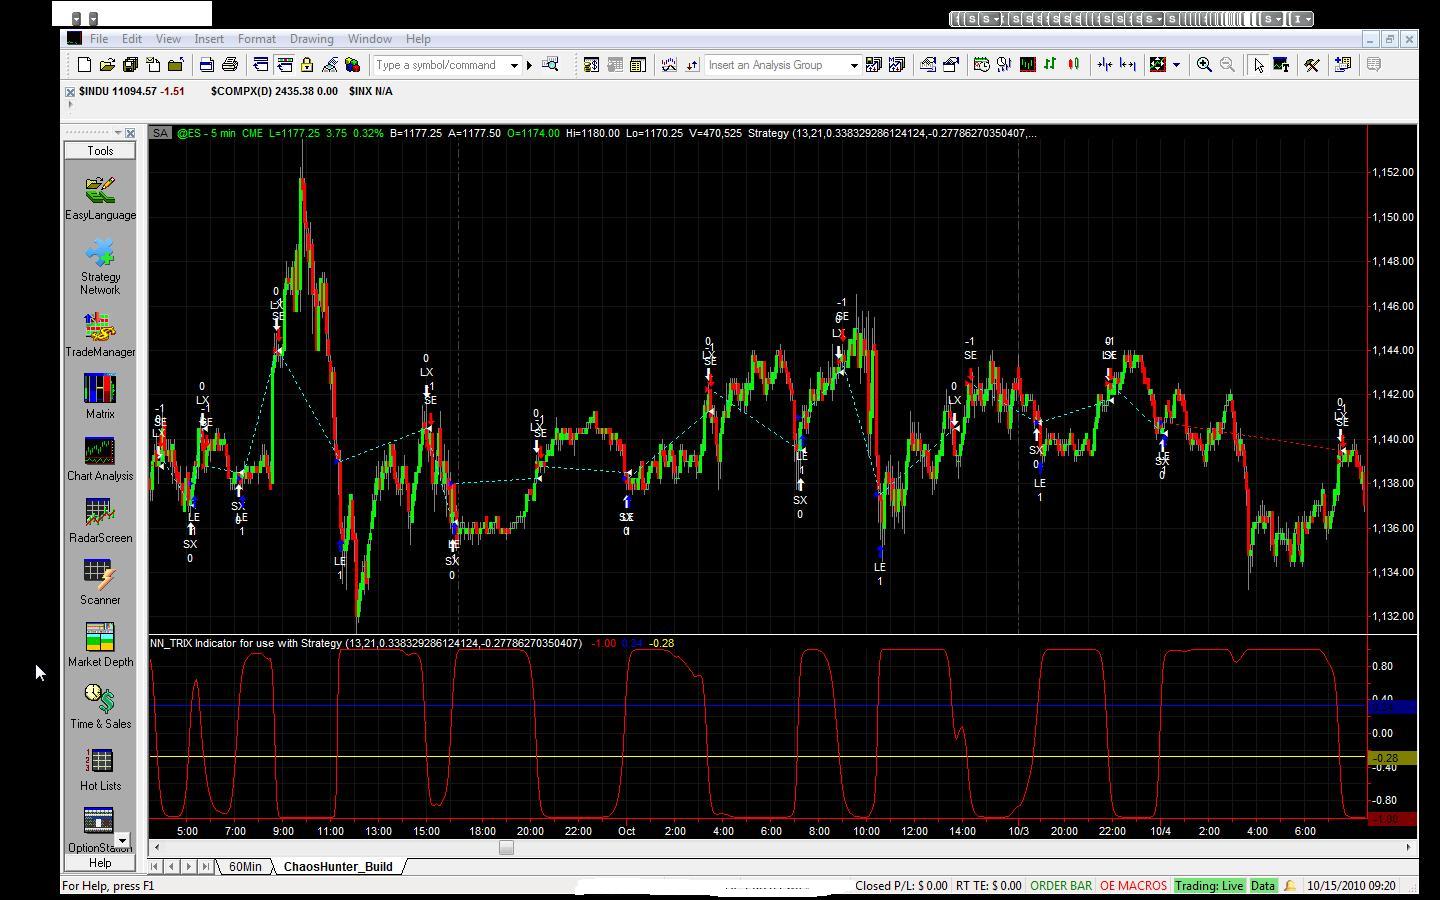
Give it shot, don't be afraid to backtest and optimize and improve. The TRIX values have been optimize these past two weeks on Fast13/Slow21 and you can see the performance. It's hit rate is awesome and it makes money and allot of trades. Exciting to watch.
This strategy is free to forum members; we are not advertising or marketing or selling anything. Use at your own discretion.
RANGER
.thumb.jpg.914f9eb6d7b587606fa6d21c9620326c.jpg)
-
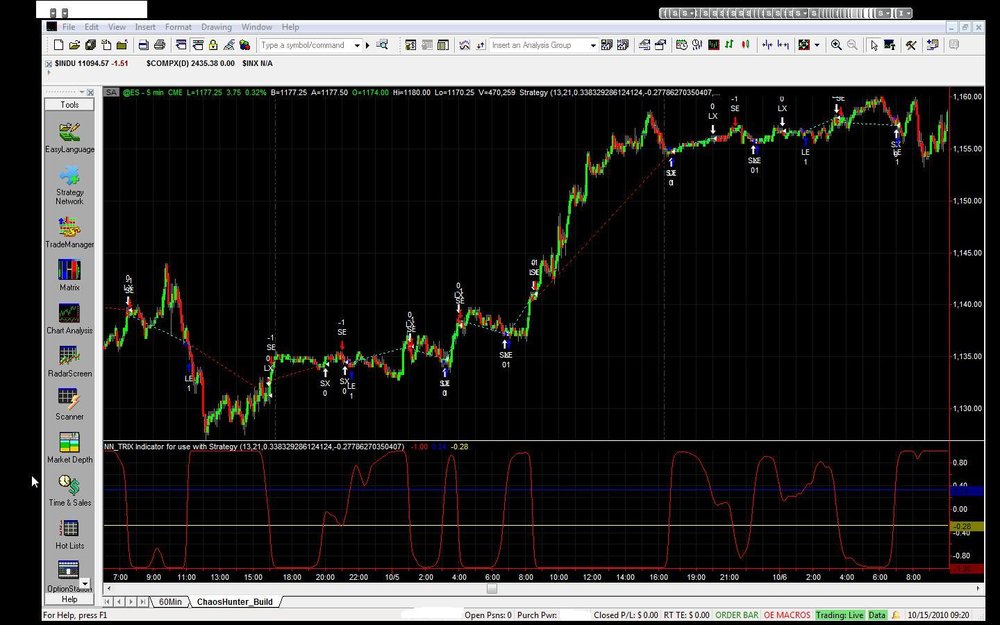
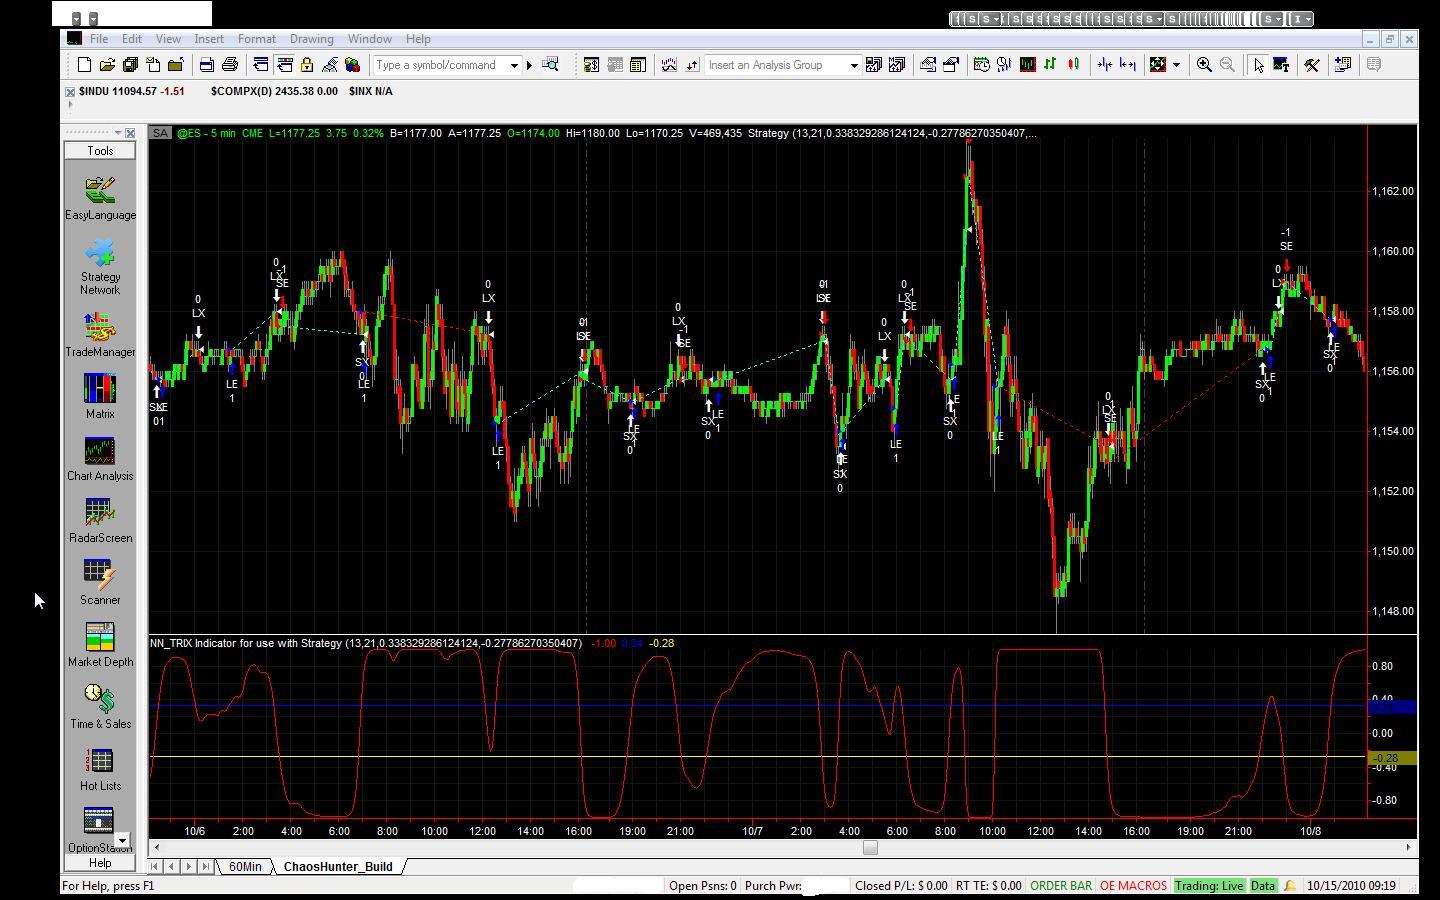
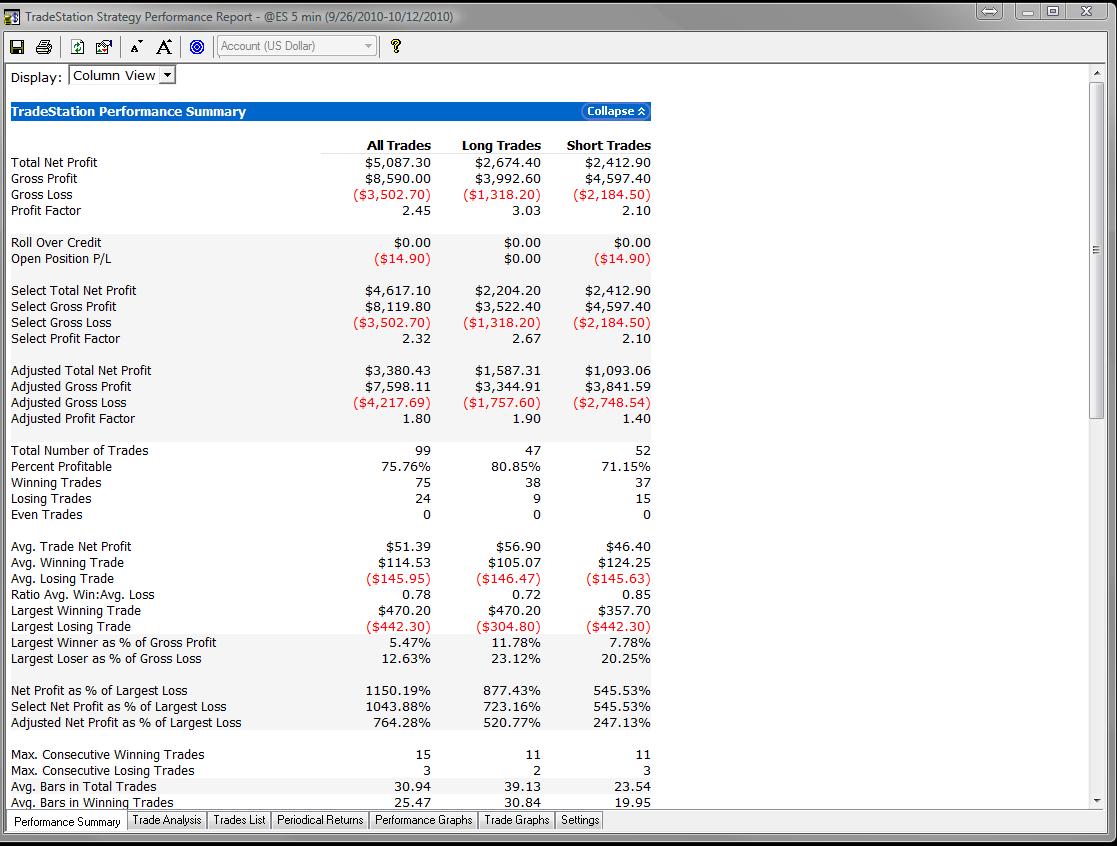
We pulled together this simple multi-model neural strategy so we could further demonstrate our work. Unlike our previous posting, it's all open source and we verified functionality in MC and TS; there are two separate files.
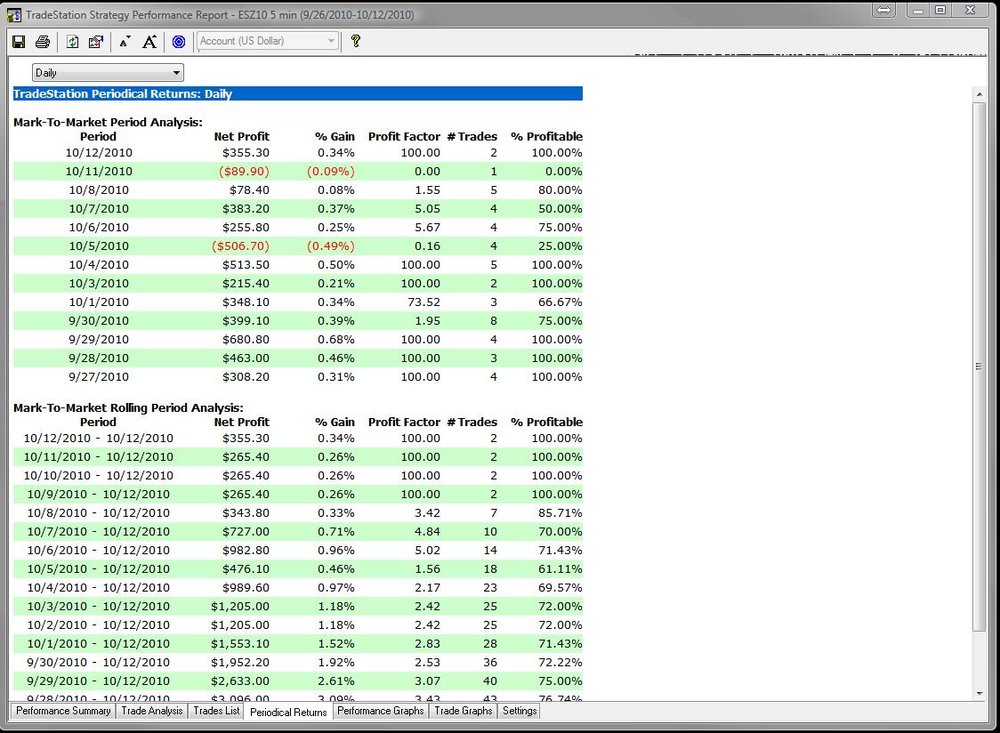
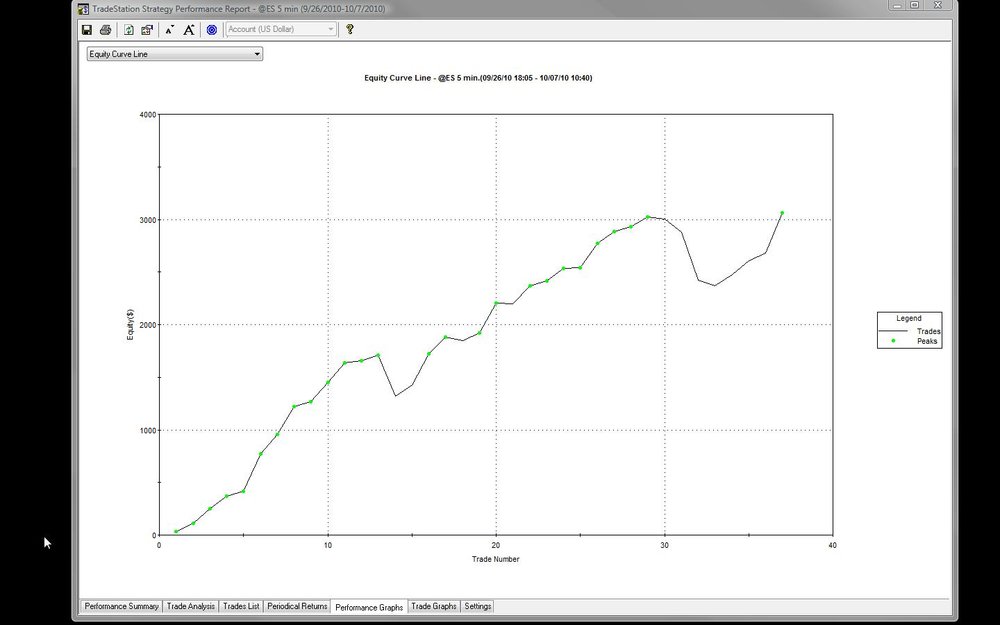
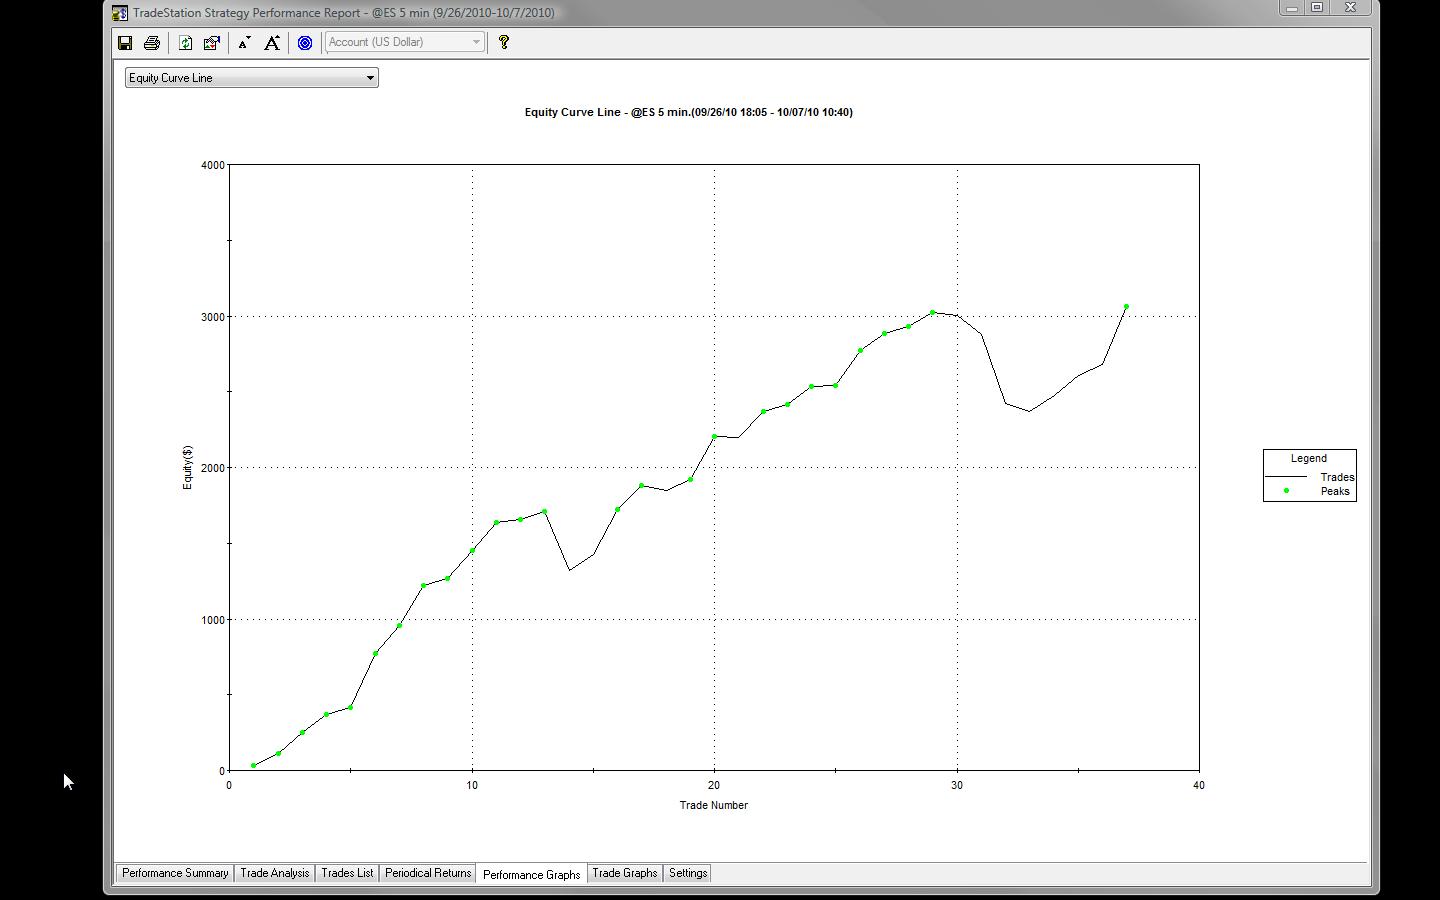
Please note the initialization instructions in the notes section of the strategy. The ChaosVars on 9/26/10 @ 1805. From within MC you can set the start date 9/26/10 and from within TS 9/27/10.
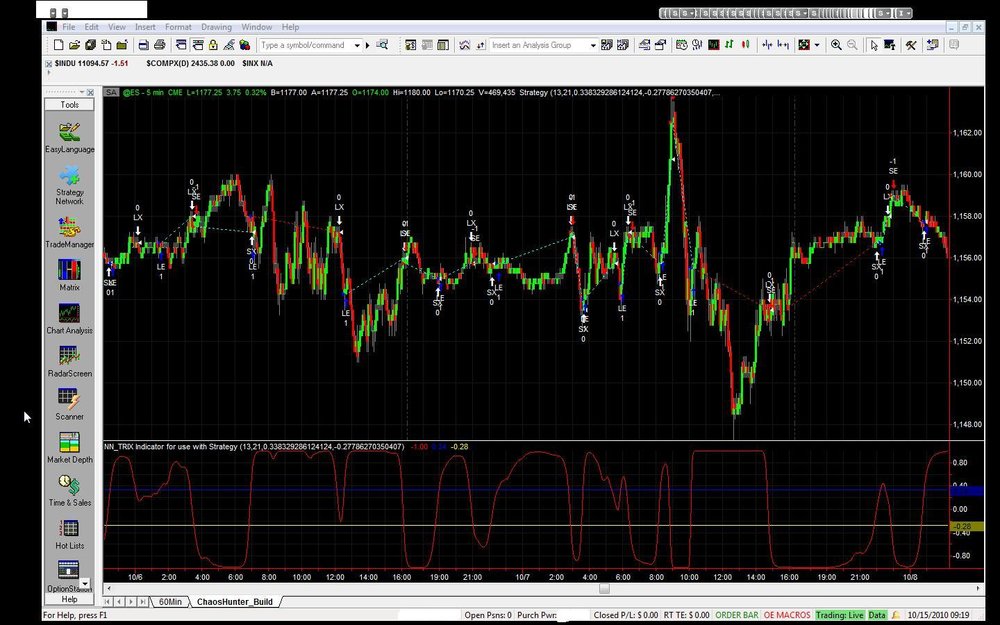
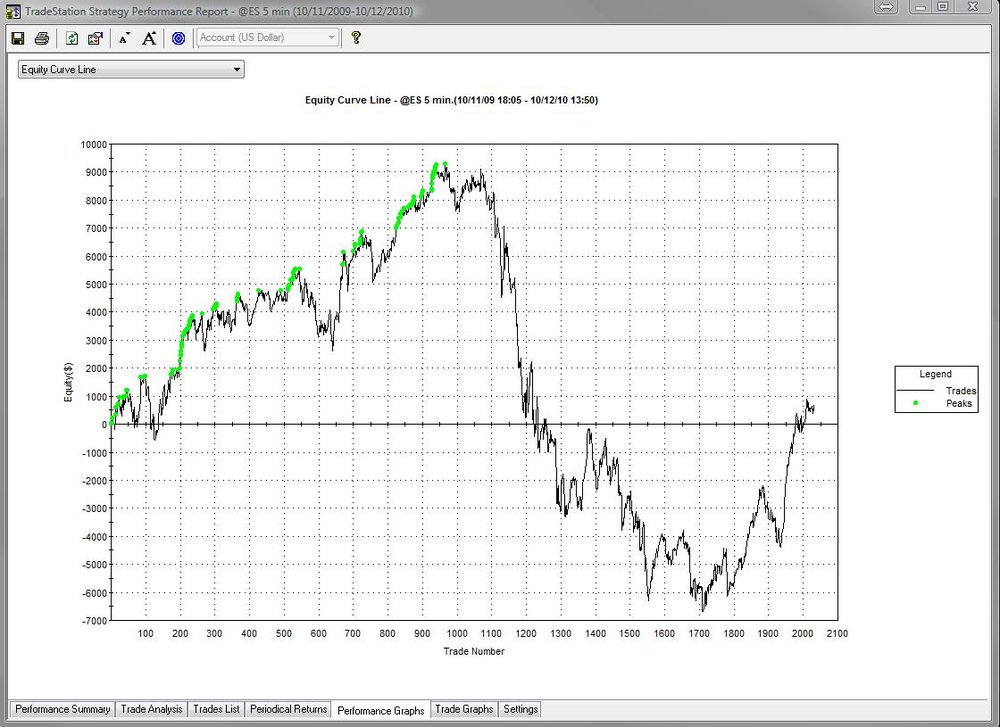
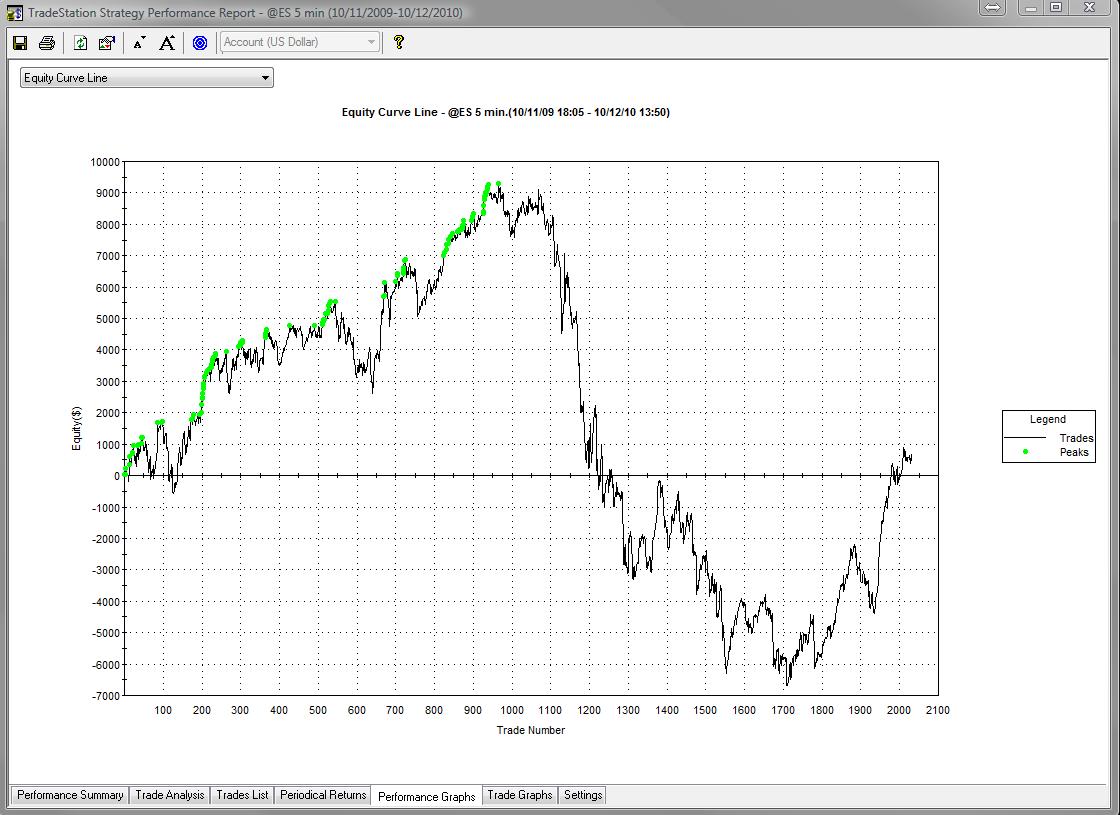
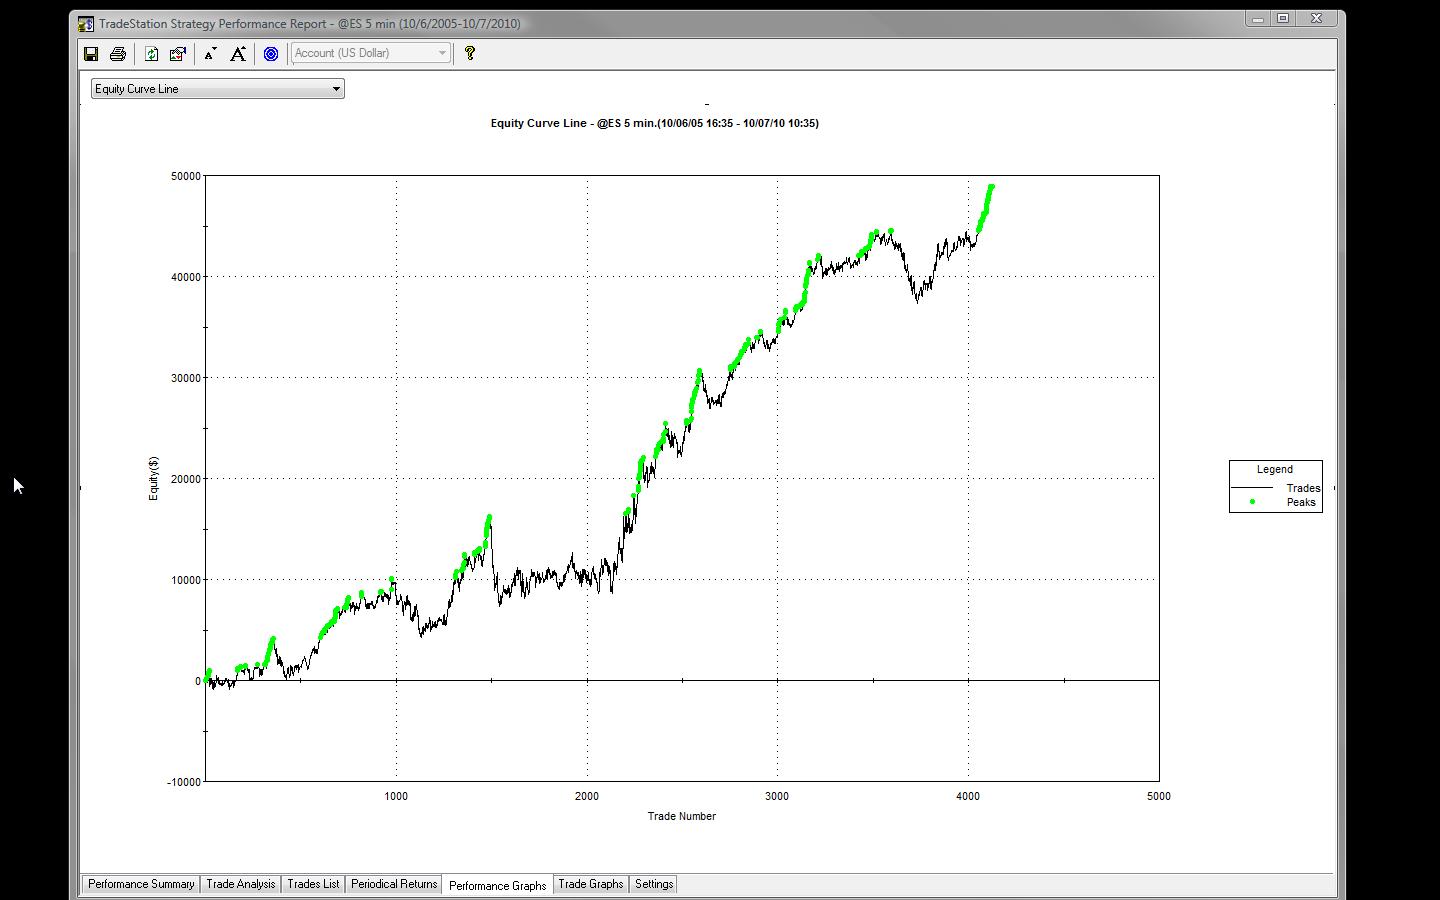
Over the long haul this strategy looks ugly but you'll notice that it also has good periods. So, how can we turn an ugly strategy into a working strategy? Here's a few ideas if anyone is interested:
a) Because the strategy consists of 2 models, it has 4 x 2 threshold conditions. We could optimize for the best entry/exit combination by toggling the inputs between 0 and 1. For example, model 1 may give the best LE whereas model 2 may only harm the strategy - you get the idea. If you find a good combination, make sure you edit the Entry/Exit flag conditions. You can probably just set them to <=1 before you start; remember there are (4) and after optimization if you find two model conditions work best, you change Entry or Exit flag to take that into account = 2.
b) We could optimize for a stop/profit target in connection with (a) or after we identify the Entry/Exit combinations. Maybe the model will eliminate this requirement.
So, if you have a spare I7 sitting around and some free time, perhaps you can give it a try.
If we botched anything let us know and we'll do our best to correct it.
RANGER

-
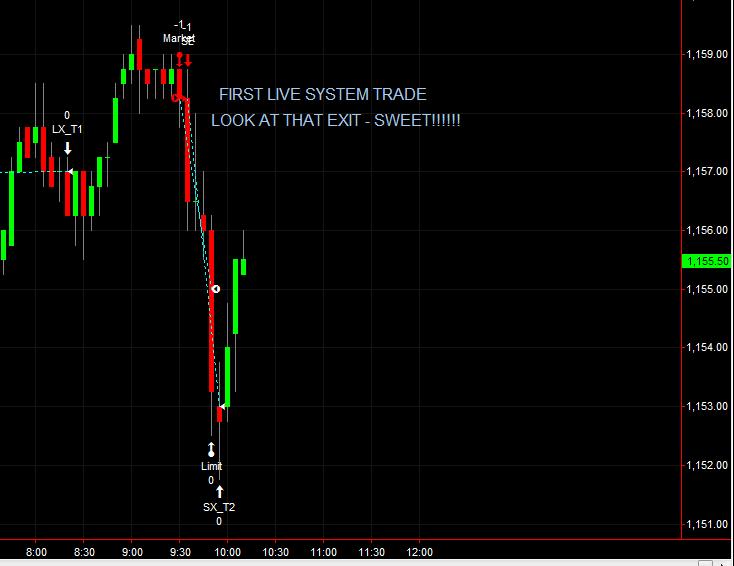
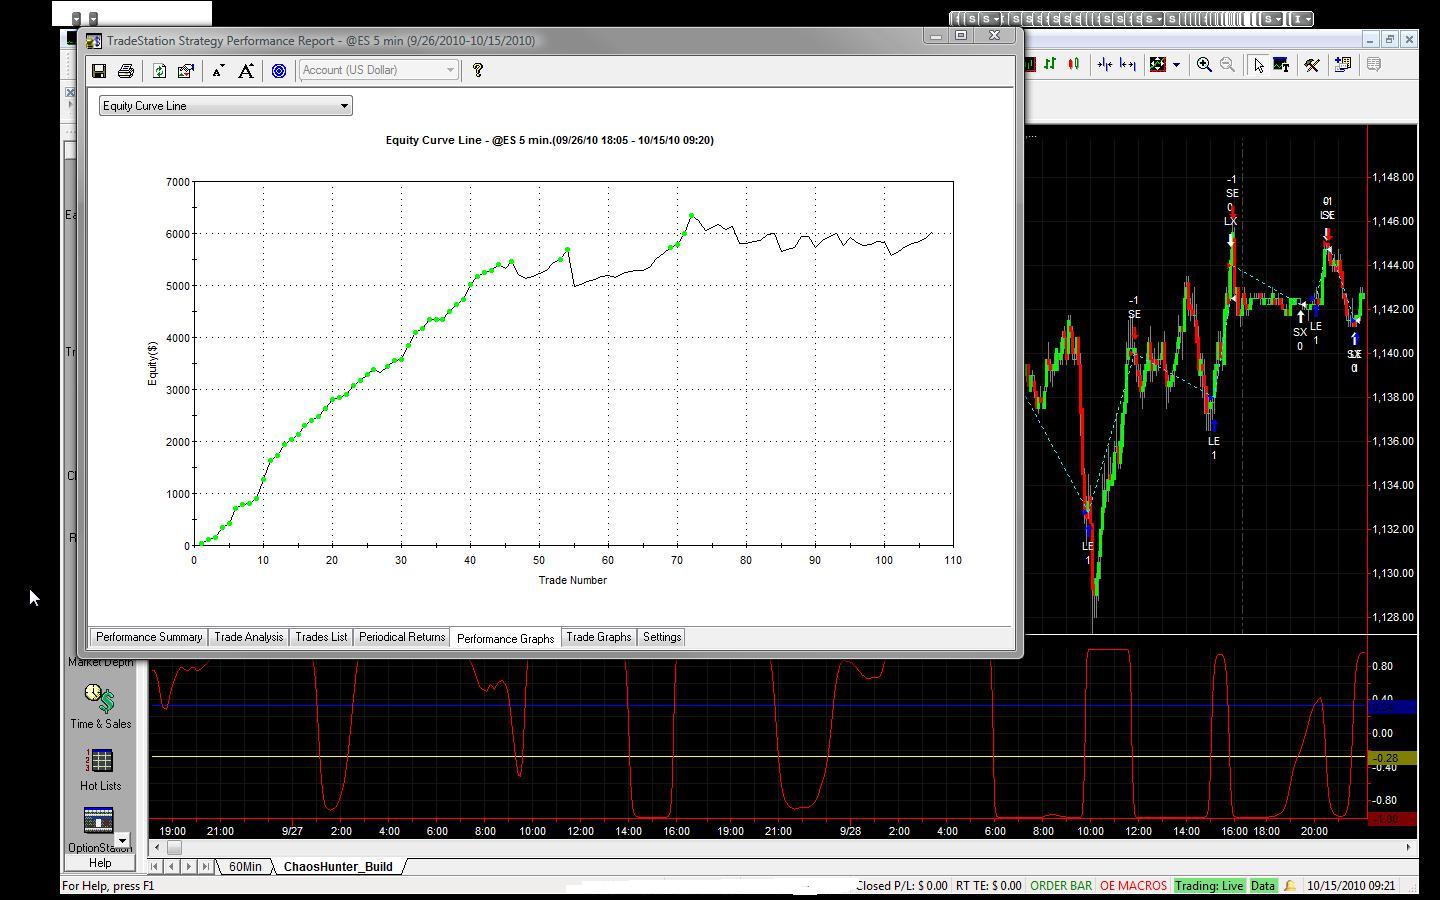
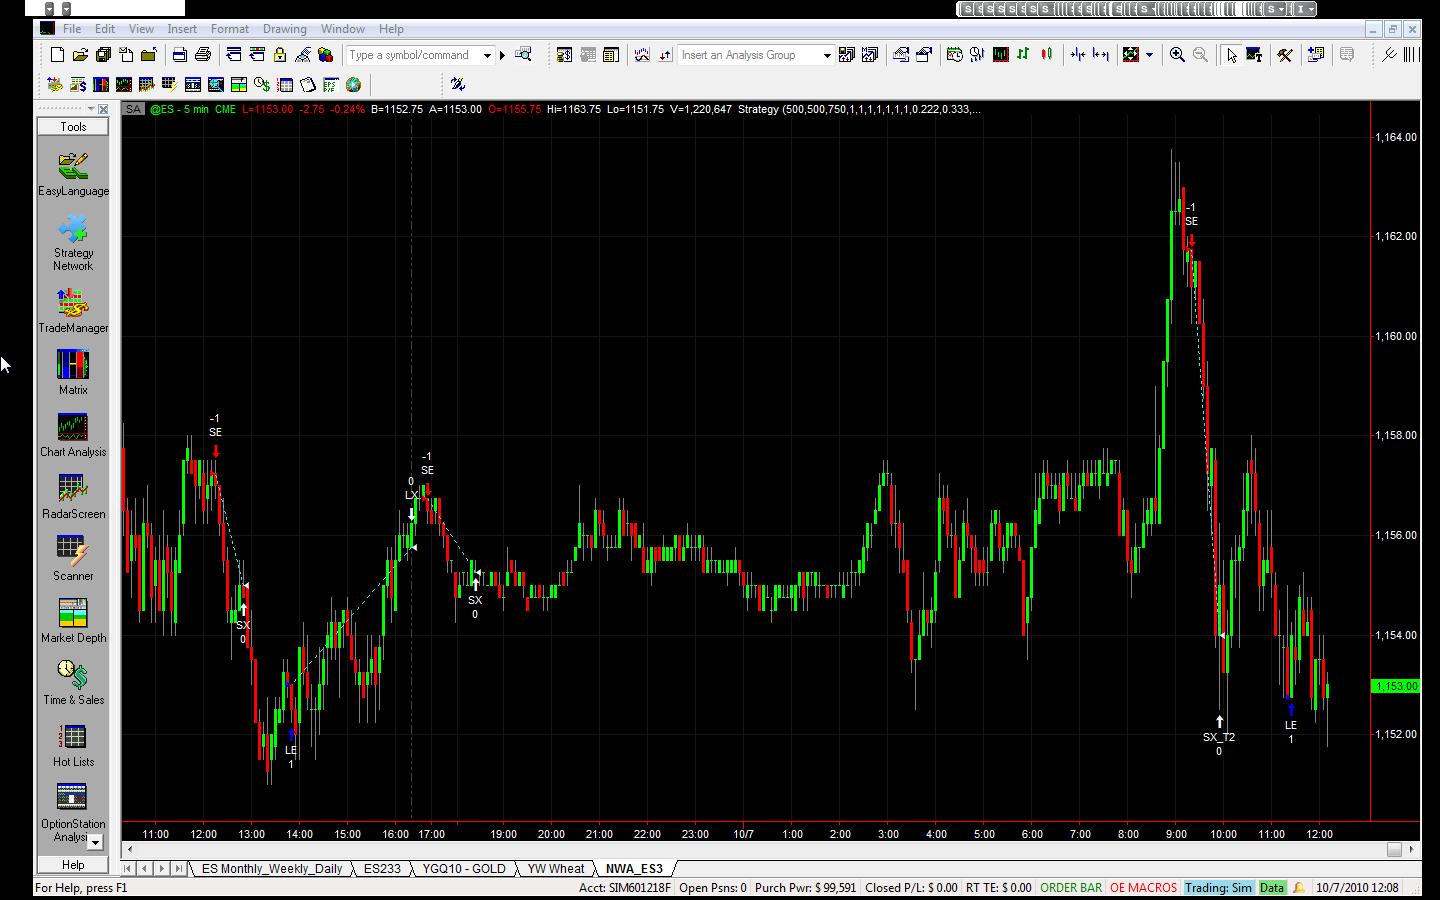
We never made a live system trade using our own money but today, we elected to go live with an Entry.
Within seconds the strategy jumped short at 1158.25. Having never used strategy generated orders, I wanted to understand the functionality. So, I disabled the strategy after it entered and verified that TS accepted our working stop. After confirmation, I cancelled the stop and placed a bracket order so I could watch the strategy.
I bailed at 1155/3.25 and the strategy bailed at 1153/5.25pts.
Some limited testing but it was fun to watch a computer make a trade.
RANGER

-
Hi Shrike
Sorry!!!
The strategy was built in TS. When we put it into MC and compiled the strategy, it checked.
We just learned yesterday that it was erroring on a function "sqrt". We need to sort this with MC on Monday. Also, mengelbrecht mentioned a failure on a function likely related to JtHMA that TS didn't include in the export ELD and we failed to verify.
Anyway, sorry for the problems. We'll sort the issue with MC; recompile the entire package and repost.
Happy to see your interest.
RANGER
-
Can you tell me which Platform you're using.
The strategy runs fine in TS, but while attempting to load the strategy in MC we got a "sqrt" function error. We checked the related functions and they appear correct. We need to sort this issue with MC tomorrow.
Pertaining to your error it's likely related to the JtHMA. Can you kindly check to see if you have this function and advise. For whatever reason, it did not export from TS, and TS doesn't permit users to see exported functions like MC. Ooops.
Anyway, we'll sort both of these issues shortly and repost.
Thanks for your posting!!!!!
RANGER
HiI followed your instructions and wanted to try out your system
When I compile your strategy i get an error when I get to this place in the strategy
//////START CALCULATION FOR SCALED HAAR
_HWT = (HaarWT(jtHMA(Close,3),4,2,FALSE)/10);
_HWT3 = (HaarWT(jtHMA(Close,3),4,3,FALSE)/10);
I get this error:
------ Compiled with error(s): ------
Invalid number of parameters. 0 parameter(s) expected
errLine 136, errColumn 10, errLineEnd 136, errColumnEnd 10
causal study: (Function)
All the functions is imported and compiled without any errors
pls advice
rgds
mengelbrecht
-
No mate ... it was written in EL for Tradestation and MC. Sorry about that .... RANGER
-
I guess that I don't understand the question. The code posted by me does not contain the same formula. The constants are different than the ones posted by you. The two charts that you show are also different, the bottom one being smoothed - compare the redline to the slow line in the chart above. Can you post the formula for both subcharts, and the input settings?
-
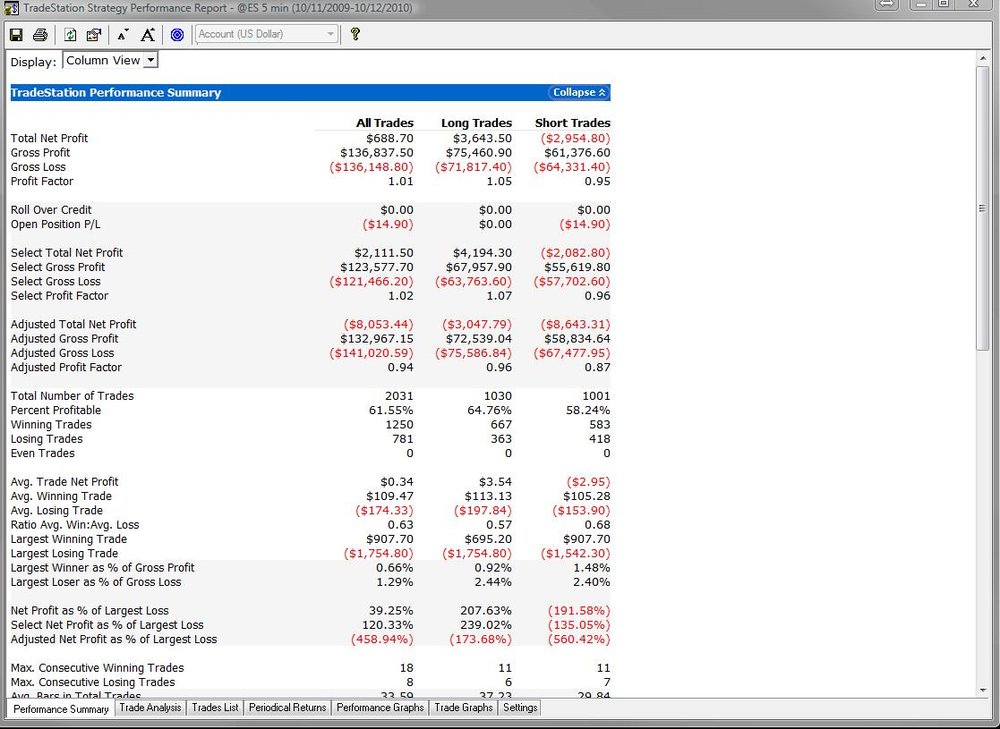
We neglected to put full credits in our code for the contributions of unknown authors for their code snippets; indicators and functions. The new revision attached here contains those credits.
We also removed the daily/profit and loss because it's unnecessary for testing purposes. We will add that functionality after the risk management question is better addressed.
Fairly good past 2 weeks sim trading 1 x ES; today was an impossible day or so it seemed but we still finished up.
Any questions or comments are appreciated.
RANGER
-
This piece of code came without any credits. You can see the constant values are different. You may want to investigate the calculation method for each.
[LegacyColorValue = TRUE];
Inputs: Price (( H + L )/2), Len (10);
Vars: MaxH(0), MinL(0), Fish(0);
MaxH = Highest (Price, Len);
MinL = Lowest (Price, Len);
Value1 = .33*2*((Price - MinL)/(MaxH - MinL) - 0.5) + 0.67*Value1[1];
If value1 > .99 then value1 = .999;
If value1 < - .99 then value1 = -.999;
Fish = .5*Log((1+Value1)/(1-Value1)) + .5*Fish[1];
Plot1(Fish, "Fisher");
Plot2(Fish[1], "Trigger");
-
Seems like OEC doesn't like "insideask". Perhaps check with them.
-
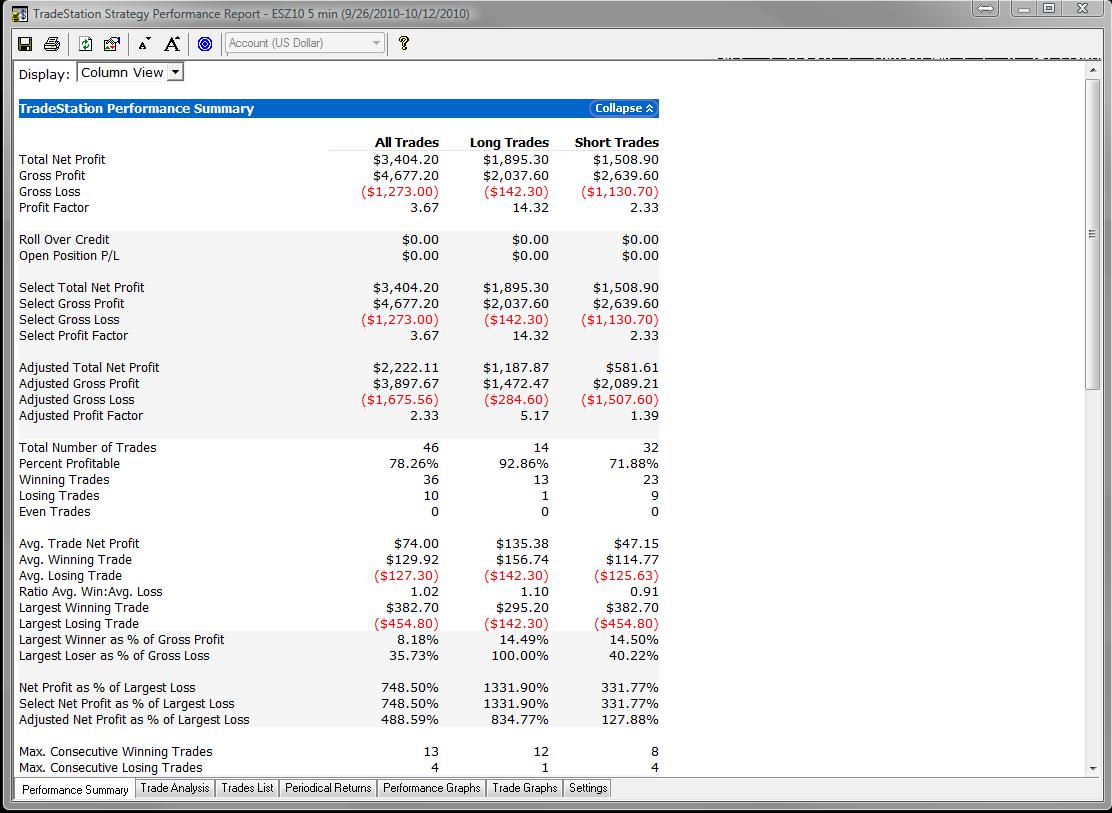
The purpose of this posting is as follows:
a) demonstrate our use of Chaos Hunter as we apply it to an intra-day scalping strategy for the ES;
b) generate interest and possibly gain support from other forum members;
c) collaboration with the objective of designing a better predictive algorithms; better money management & risk rules.
Notes:
d) BEFORE YOU LOAD THE ELD files, please view the screen shots for the ELD Files. If you have Functions with the same names, importing the file may lead to over-writing.
e) Before you try to demo the strategy, please open the Strategy txt file and read our notes.
f) We encourage forum members to trade this strategy only in simulation mode.
Loading instructions:
g) Import functions. The Locked function is the Haar Wavelet and it will expire on 12/25/10 rendering itself and the strategy unusable. {If we collaborate, we're happy to extend this time frame or we may elect to give you the indicator.}
h) Cut and Paste the strategy into a new strategy. Please use NWA_ES_R3.(Thanks)
i) From the screen shots, please follow the setup with particular attention to the DATE RANGE for the data set. The date range is important because variables are initialized in the strategy by a start bar. First bar = 09/26/2010 18:05 EST.
We hope you enjoy the strategy; we'll endeavor to post more in the future.
We would appreciate your comments and questions.
RANGER & ZACHARYDW00
-
Hi Urma
Perhaps my questions was unclear. Do you smooth your price and volume data prior to regression modeling?
I compared JMA a version of Hull and found them comparable. My partner and I compared JMA; Hull and Haar Wavelet MAs and found Wavelet more responsive. The Wavelet MA seems to make the curves with little under/overshoot.
Thanks
RANGER
-
Hi Ranger,This a trading non-related issue. A buddy of mine is making a quiz portal. He wanted me to come up with algorithims for calculating numerous activites on this forum, e.g. a ranking of questions based on question's average time of response, % of correct answers, etc.
A person from another trading forum has offered a solution to my previous post: 1.0001^(-x), which tends to work well.
Now I am looking for a formula for the following function:
You might try the excel forum at MS; this forum typically deals with coding issues. If that function meets your needs, and you supply it variable "x", and have it calculate "y". Seems like your all set!
-
Urma
I think that in one of your posts you mentioned that you use JMA for smoothing. Do you use this MA to filter the data of your indicators before modeling ie volume or others for your regression models?
Also, do you have an opinion on the use of wavelet algorithms for smoothing data sets for use in NN?
Trust all is well
RANGER
-
Do you have any additional information on how the data points were plotted. It looks like a simple data series.
Exponential Decay functions look similar however Y > 1 at some point on cyour curve right?
You may be able to approximate the function with a first degree polynomial curve fit.
Sorry, I don't have much time to spend on this because I don't know the purpse of your question.
RANGER
-
Hi BB
Glad your broker was able to help you.
-
Hi Minetoo
I downloaded the indicator and review it against what I pasted together, note:
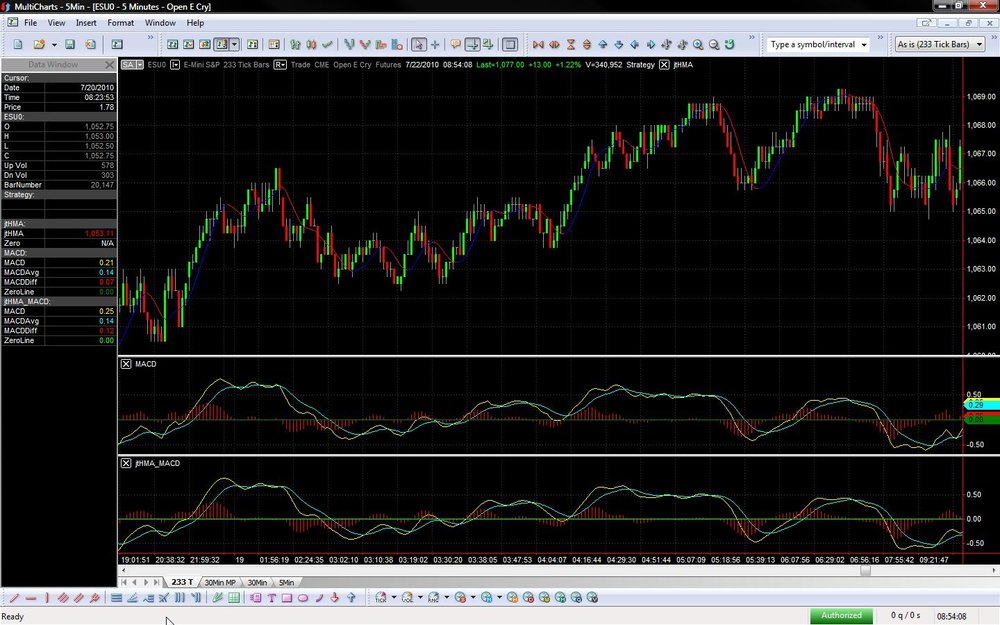
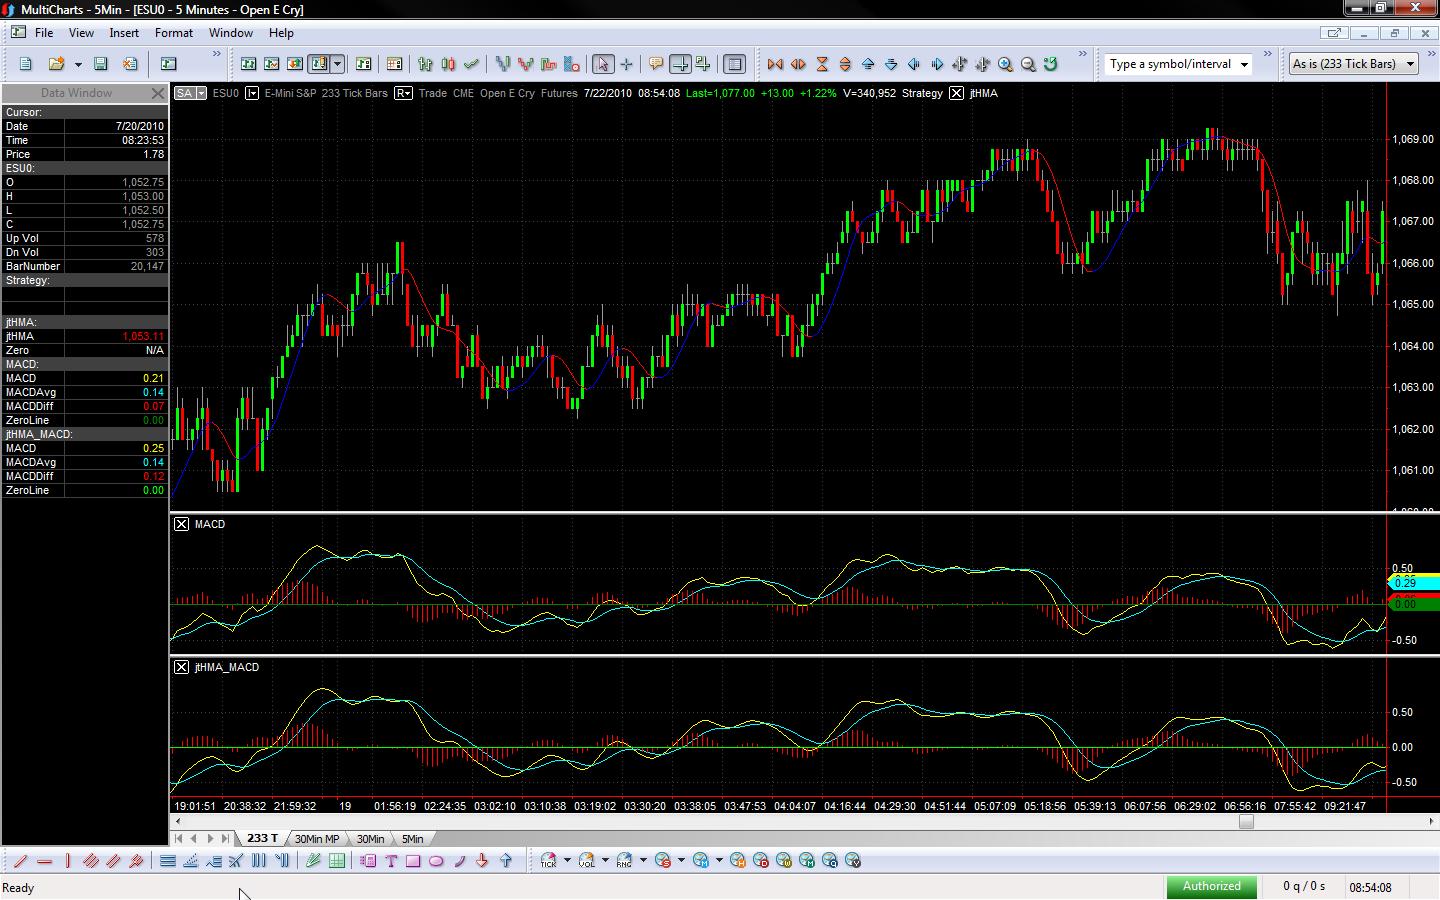
a) The other indicator doesn't really make sense to me. The MACD is jagged because the input for the MACD is Price. Price is jagged; the MACD is jagged.
b) In the version posted by me, I smooth Price and use it as an input to the MACD. Take my version; the version that you provided in the link and a Std MACD and compare the three.
c) The signal for the MACD is typically a crossover of the two moving averages or Zero line. The other indicator takes the difference of the MACD and the Smoothed MACD and creates a signal. Not sure what that does but create a little more noise in an already noisy signal.
That's my conclusion. Happy Trading and Thanks!
-
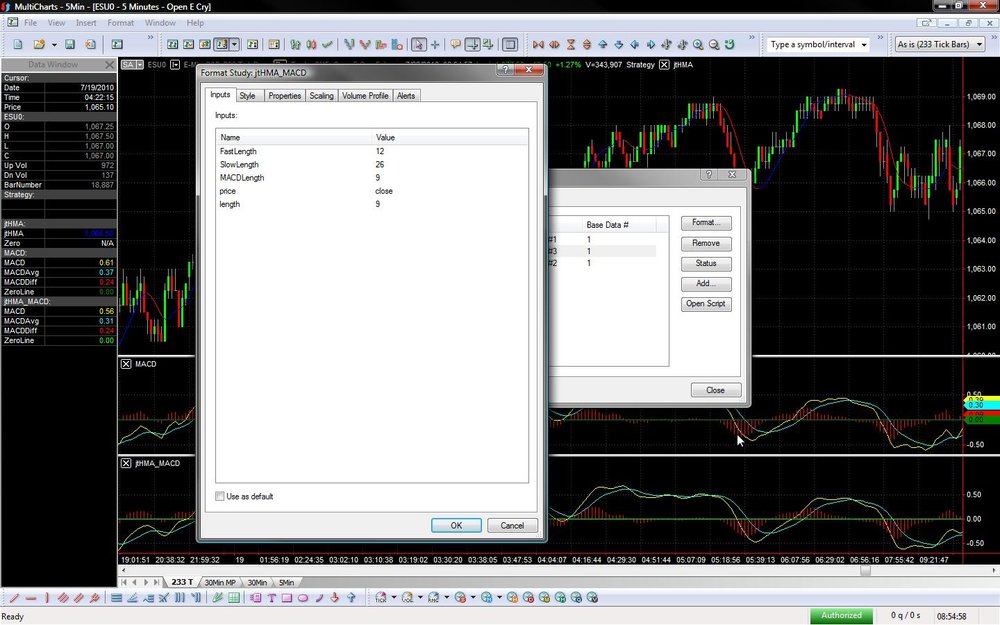
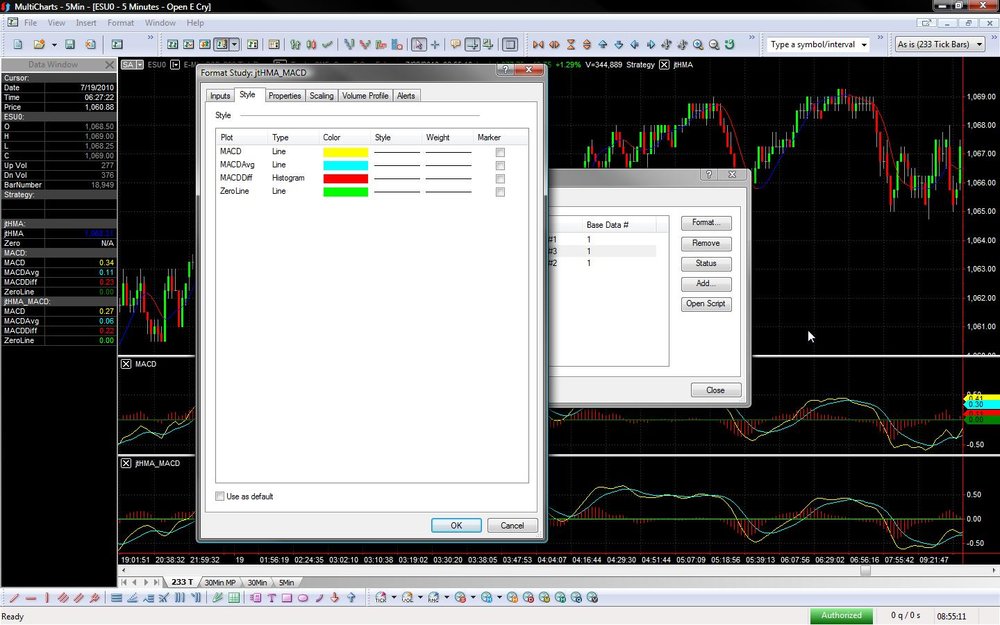
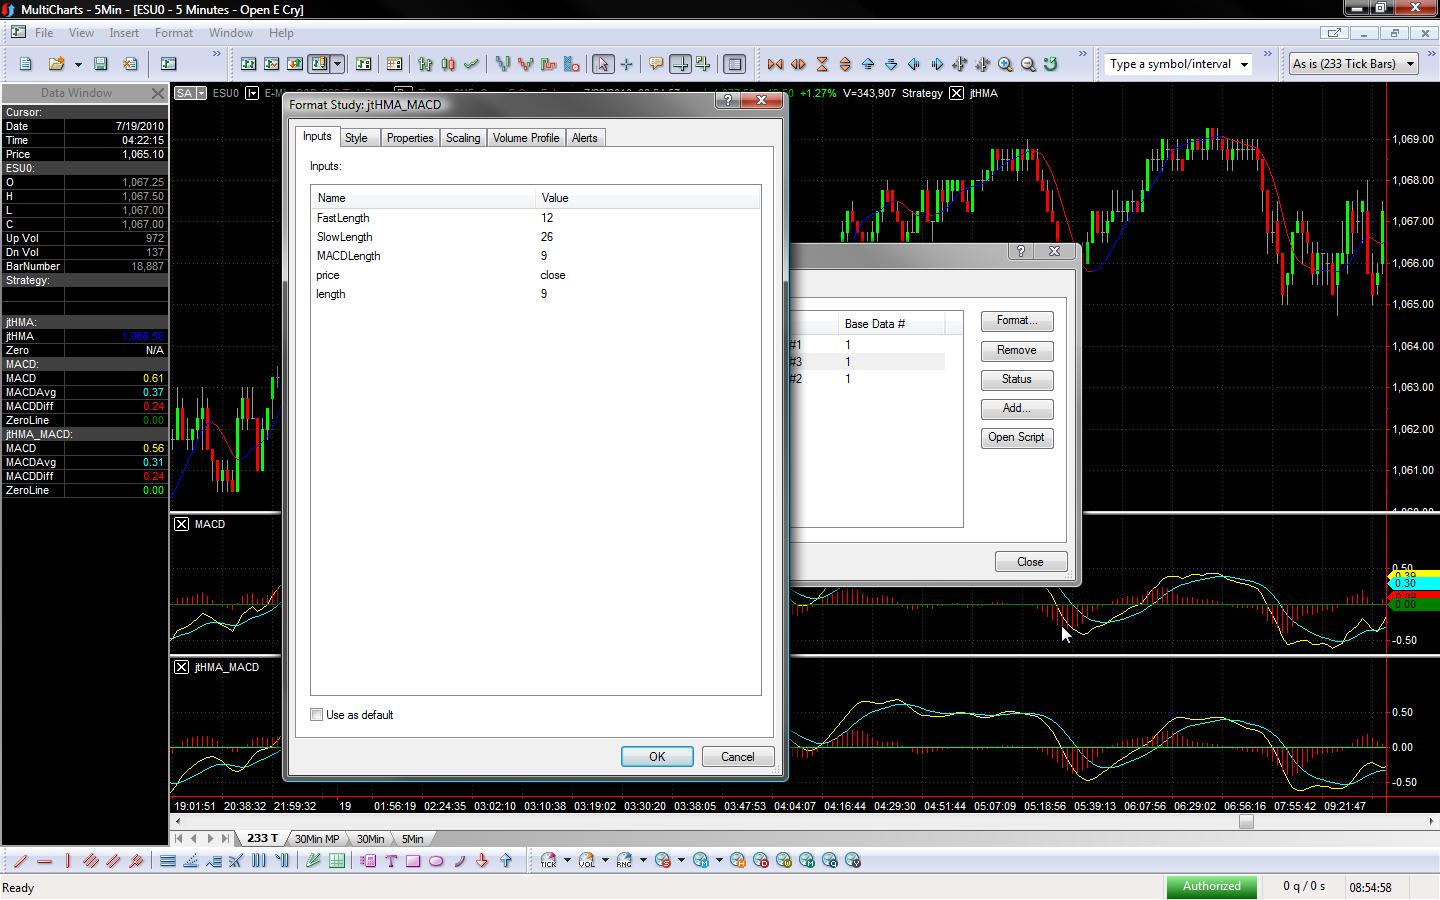
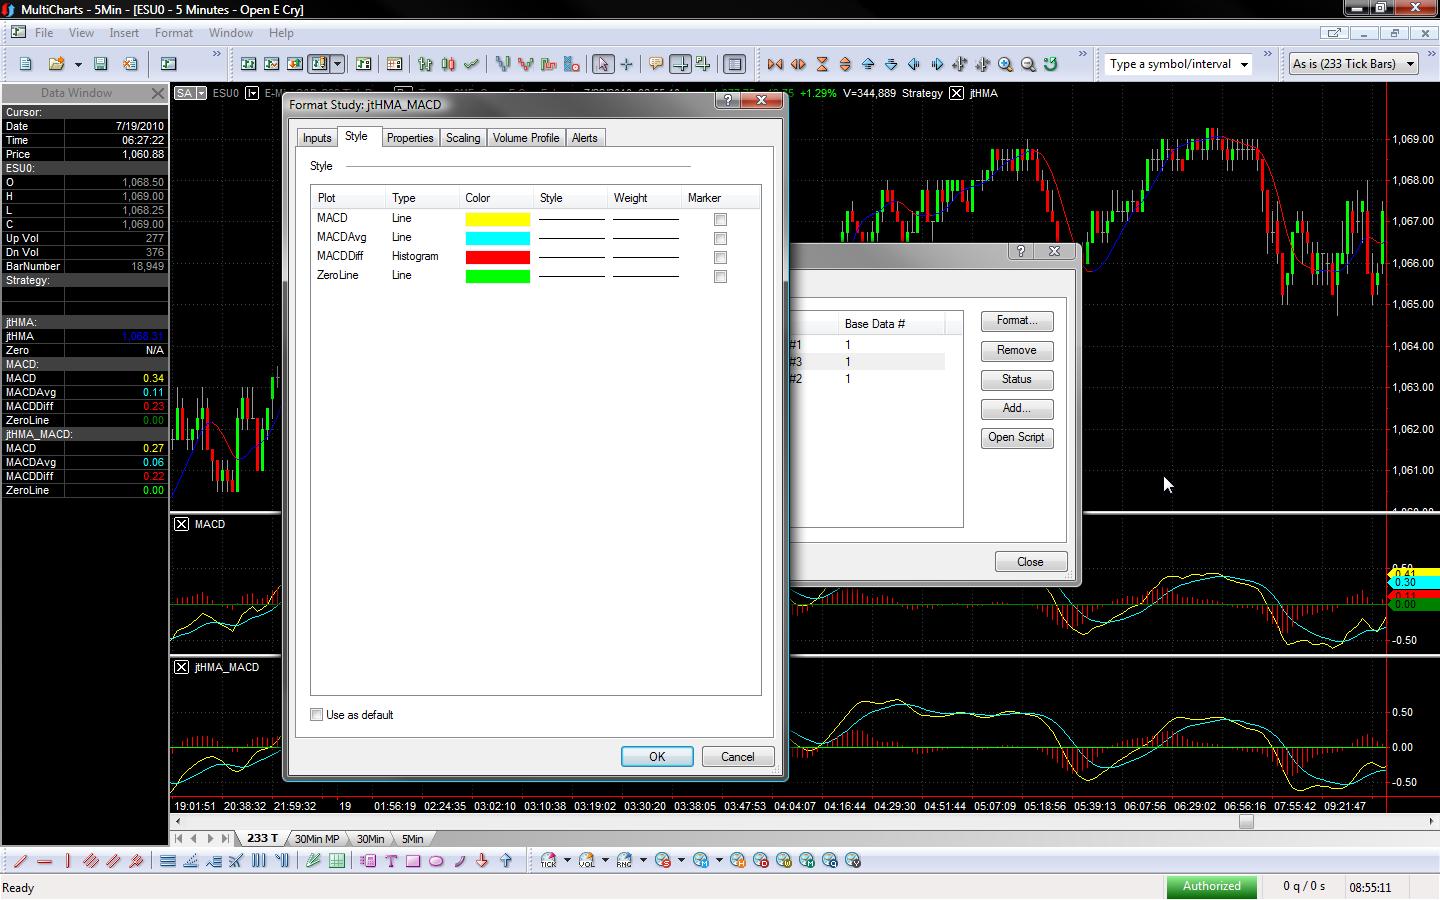
This compiles and runs in Multicharts; didn't test it in TS but I don't anticipate any issues; screenshots attached for settings.
RANGER
////MACD BASED ON JTHMA CREDIT TO THE ORIGINAL AUTHOR.
{jtHMA - Hull Moving Average Indicator}
{Author: Atavachron}
{May 2005}
{
Inputs:
-------
price: the time series being smoothed, usually Close, High, etc,
but could be RSI(Close, 25) for example.
length: the length of the MA, pretty meaningless in the normal sense
of moving averages, as this quantity is heavily modified
in the code. You need to experiment, do not just use a setting
of 20 because that is what works for you with Simple Moving Averages.
zeroLine: if you are using this in an indicator pane, you might
want to display a centre line of some sort, ths allows
one to set its value
zeroVisible: boolean variable, determines whether the centre line
(zeroLine) is plotted.
upColour: If you wish to differentiate upward movements by colour coding.
downColour: If you wish to differentiate downward movements by colour coding.
colourDeltaBar: Set this to 1 if you wish the colour change to be effective on
the actual bar where the direction change occurred.
Set this to 0 for default behaviour. All other values
are pretty meaningless.
}
Inputs:
FastLength( 12 ),
SlowLength( 26 ),
MACDLength( 9 ),
price(Close),
length(21);
Variables:
_MACD(0),
_MACD_Avg(0),
_MACD_Delta(0);
Value1 = jtHMA(price, length);
_MACD = MACD( Value1, FastLength, SlowLength ) ;
_MACD_Avg = XAverage( _MACD, MACDLength ) ;
_MACD_Delta = _MACD - _MACD_Avg;
Plot1( _MACD, "MACD" ) ;
Plot2( _MACD_Avg , "MACDAvg" ) ;
Plot3( _MACD_Delta, "MACDDiff" ) ;
Plot4( 0, "ZeroLine" ) ;
-
Actually there is another intervening (crucial) step and that is to concider how you might take potential trades based on what the forecast MACD is. The output from this would presumably go into your equity net?Thanks BlowFish ...
I've heard of MACD strategies but I don't have one that works so I intend to use this as a permissive that I'll poll as part of an overall autoexecution strategy.
I started modeling a Stochastic using similar inputs but the results are partly heinous and partly unbelievable. I queried Tradecision on the matter and hope to hear back today.
One of things that I'd like to do is filter the noise found in intraday price data and use the output for the neural models. I've been reading some research papers; investigating websites etc and found some resources but I haven't found a starting point for easy language. I seems like I might have to generate my own wavelet filter .... talk about inventing the wheel on some of this stuff .... :crap:
-
so the "test data range results" are out of sample?Correct Waveslider!
RANGER
-
Attached find a predictive MACD developed using Tradecision. For the most part the MACD is triggering approximately 1-3 intervals before the standard MACD(can post the full time series).
Directional accuracy and error of model shown.
RANGER
-
-
I attached a zip file with screenshots showing how I setup a model for CAT using 60 Minute data. I made some notes so that interested forum members can follow along.
Note:
a) I didn't include any other timeseries in this model. That will be the next step ie a SMA model for S&P; DJI etc.
b) I checked with Tradecision and they said that pre-processing on minute data is probably unnecessary. I need to check my data set and make sure that it's statistically sound but I'll leave that as a future excercise following review of model output.
c) Tradecision has implemented a filter for outliers that will help normalize data but the beta version has crashed on me a couple of times ... in all fairness to Tradecision, I got this hot off the press. I sent them error reports.
d) The screenshots show a henious estimated time for completion. The estimated time at posting is now 1.5 hrs and I'm on stage 2. If it completes soon I'll post the results.
e) I'll likely need to improve the directional accuracy .... let's see what happens.
Any comments especially on the inputs would be really helpful.
RANGER
.jpg.9af8bddf954474662ace8a08d5ba402d.jpg)
Profitable Neural Network Strategy
in Automated Trading
Posted
Hi UB
It’s always an honor to have you comment on my post.
After reading your posts, it’s clear that our modeling techniques are different than yours, respectfully note:
We do pay particular attention to our input selection; perhaps different from your technique, our preprocessing consists of selecting representative data for our model(s). We do filter data, hence our use of the Haar Wavelet but we consistently strive for selecting a balanced diet for our children.
We think it’s unnecessary to compare the model outputs to any form of linear regression using our modeling techniques. We understand your technical basis but because our strategy formation and are optimization techniques are different, we see this as unnecessary.
In connection with optimization and strategy development, note:
Sometimes, we build a model using several or many inputs. We then re-run this model with varying initialization values because we want to generalize it, then we:
a) form a model committee; each committee member has the right to vote on Entry/Exit - Consensus polling or;
b) we average the optimized output values and then optimize for Entry/Exit and;
c) Sometimes, we make model contests – i.e. if longs are even with shorts we remain flat, go consensus voting;
d) We also create ideal input groups based on factors consistent with their strengths, then form model committees; contests.
We agree that the task of modeling can be complex but the task of understand strength and weakness is equally challenging and it’s well within the technical grasps of our forum members.
Thank for contributing to this posting UB.
RANGER