
Welcome to the new Traders Laboratory! Please bear with us as we finish the migration over the next few days. If you find any issues, want to leave feedback, get in touch with us, or offer suggestions please post to the Support forum here.


btrader2
-
Content Count
53 -
Joined
-
Last visited
Posts posted by btrader2
-
-
add more too it or modify it for you own purpuses.Great tool mong! Turns out it's a pretty good tutorial as well. I see how I can add previous day MP value areas. At a later date I can add developing VA much like you have your 60 min data set up. Then let your spreadsheet check those for confluence.

P.S. I modified your 1.23% fib to 78.6% which is a level I prefer.
-
Thanks for the update Clym. Cool little sym.
-
Also some months back there were Laptop battery recalls in the news. Certain battery models became fire hazards. Don't recall any more details but you could news search it down.
-
moneymarkets,
It appears that a .pla file is not accepted for uploading in this forum. Do you know that the squeeze indicator requires the jtHMA function to work? Could that be your problem?
Regards
-
I compiled it as is using MC 3.0. Not familiar with the indicator tho.
-
Nice bit of coding Szymon. Thanks!
-
Excellent work Blu-Ray!
-
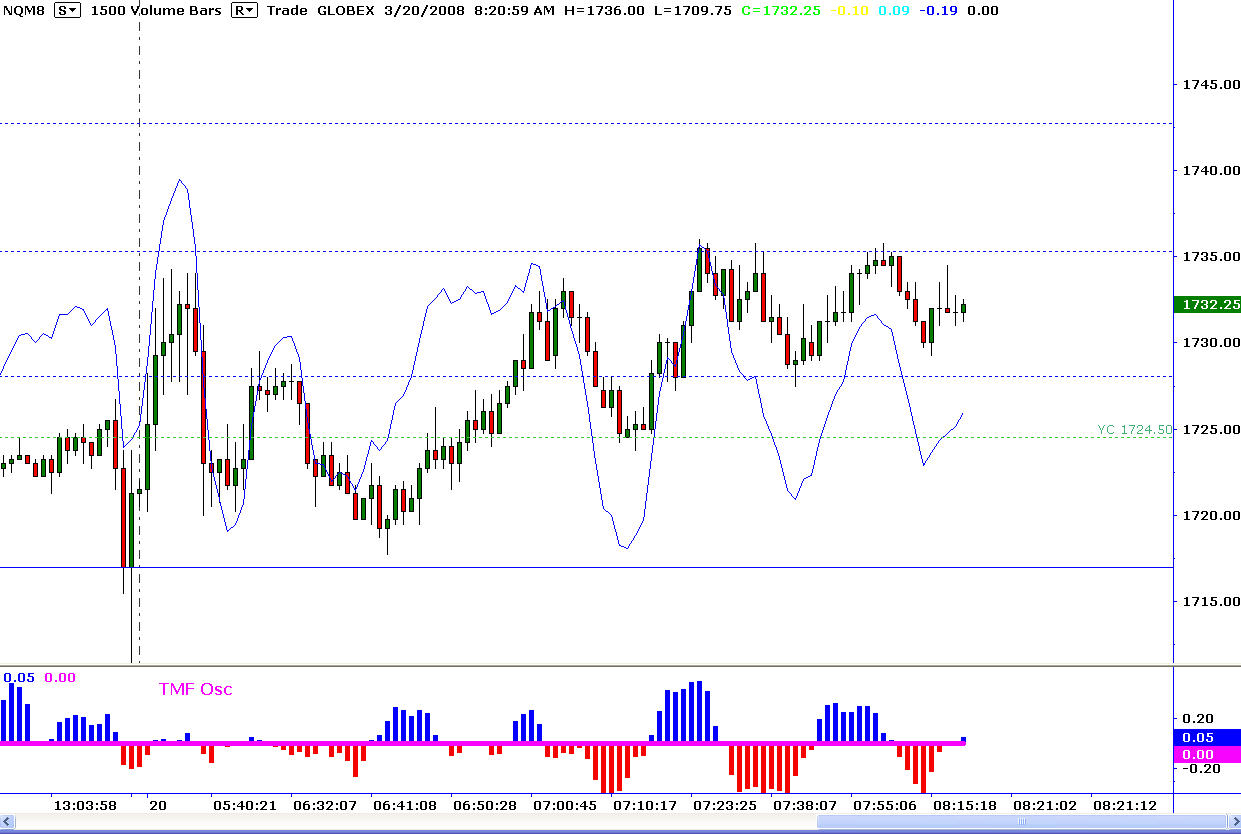
Thanks James and Brownsfan for your observations. I wanted to know how you guys from the Candlestick Corner felt about these. Candle "type" identification is not yet a written part of my strategy but I may set up a 15 min as another HTF and see how it goes. My LTF (e.g. 1500V for NQ) stays a VBC as I feel I have a niche.
-
Using VBC's with candlestick analysis is another animal. I used VBC's for a very long time and while they can be profitable, I just got tired of trading so much in one day. I literally had days over 50 trades in a day with VBC's. Just too much strain by the time 4pm rolled around.VBC's with candlestick analysis can be very profitable but it does take time to find your niche with them.
I agree and thanks for the input. Used with a proper filter like Higher TF S/R.
-
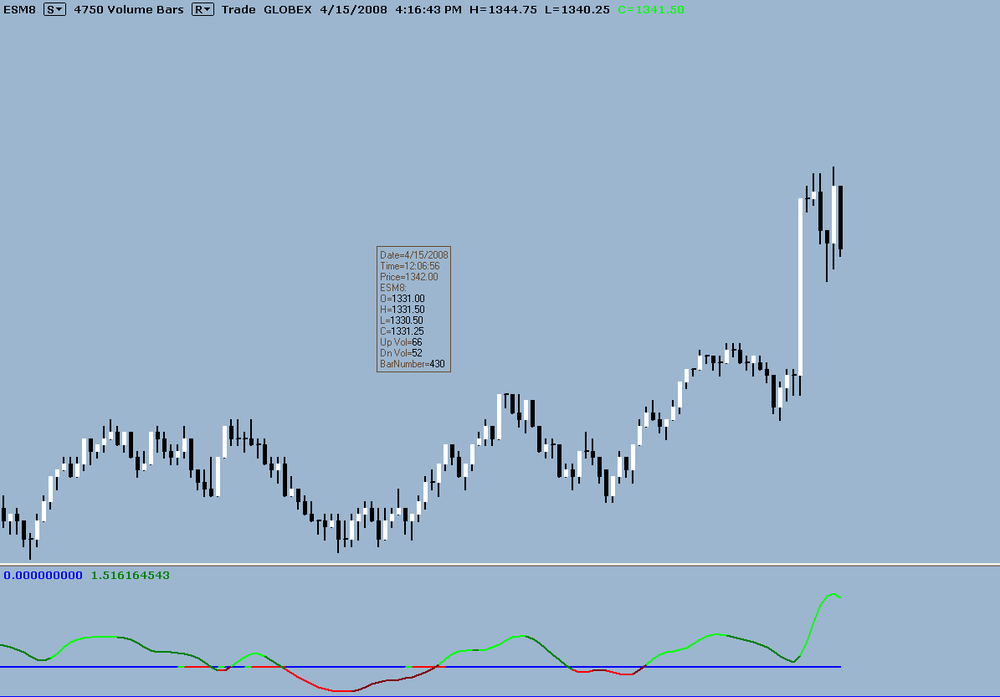
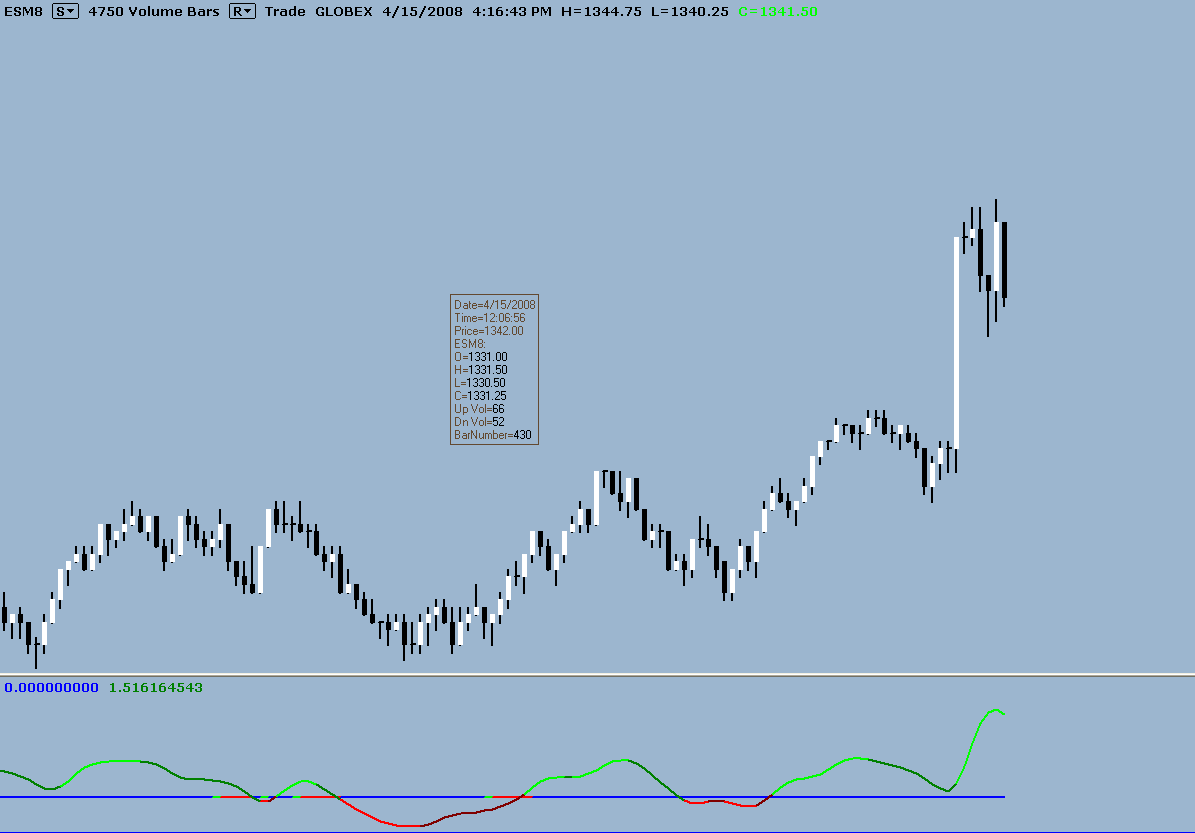
Overall, I was just trying to show the basics of candles and how the body tends to get smaller at the end of trends.James, I agree with time based charts but with VBC candles, isn't it true that a series of smaller candles (volume increase) can indicate a different type move may be under way?
-
Thanks for the update.
-
I'll be there too. Looking forward to it.
-
Thank You cosmic for the eld. Looks very good at showing divergences. Compiled fine on Multicharts.
btrader2
-
Hi Walter,
Great thread! Please continue with these videos. This is the area of Price Action we work on in an Ensign Windows Echat room I occasionally visit. Tests of the the last highs/lows and high/low failures (usually on a HTF setup chart). Then look for turns at those levels on the smaller tick chart.
-
bronxterp, I should have included that my main software for MP is Multicharts and Excel is mainly for testing and backup.
-
Hi bronxterp,
For currency futures I have my symbols set to GLOBEX for FX futures which is 17:00 to 16:00 Central. The calculations for VAH, VAL, and POC is done by the MP software I have for the MultiCharts charting package I use. You may want to look at a charting package that has MP included since you are looking at 10 currencies daily for MP analysis.
-
My software squawks about being more than 24 hrs when I try to set London open through US close. I also have a spreadsheet so I may set it up there for comparison. Since I only look at the Euro and Pound futures, London close (as mentioned early on in the thread) might be a setup too because of the London/Euro/US overlap. BTW, there was a nice pullback trade off the 24Hr VAH in the EUR today.
-
Thanks Reaver for your input. I'm using an MP EasyLanguage "plug-in" to my MultiCharts software. Early on in this thread there was discussion on what was best to use as a base timeframe. I think it drilled down to London or 24Hr. I think MP with Currencies (Forex or Futures) is an interesting discussion which could be expanded.
-
I would like to apply MP to currency futures (EUR, GBP) which I'm starting to study. I see discussion started on whether the 24hr or a specific time zone is the preferred profile setup. I chose to start with the 24hr format but segment the profile to reflect my time zone (PDT start of RTH with capital 'A' period). Asian and London has already completed and are lower case. This setup "isolates" my time frame part of the profile. This is just a start of my observation but it appears 24hr POCs get respect. Has anyone else continued to study MP and currencies?
-
Thanks Traderlu, I'm going to try it out.
-
Thank You for the update!
-
FOMC Minutes due now!
-
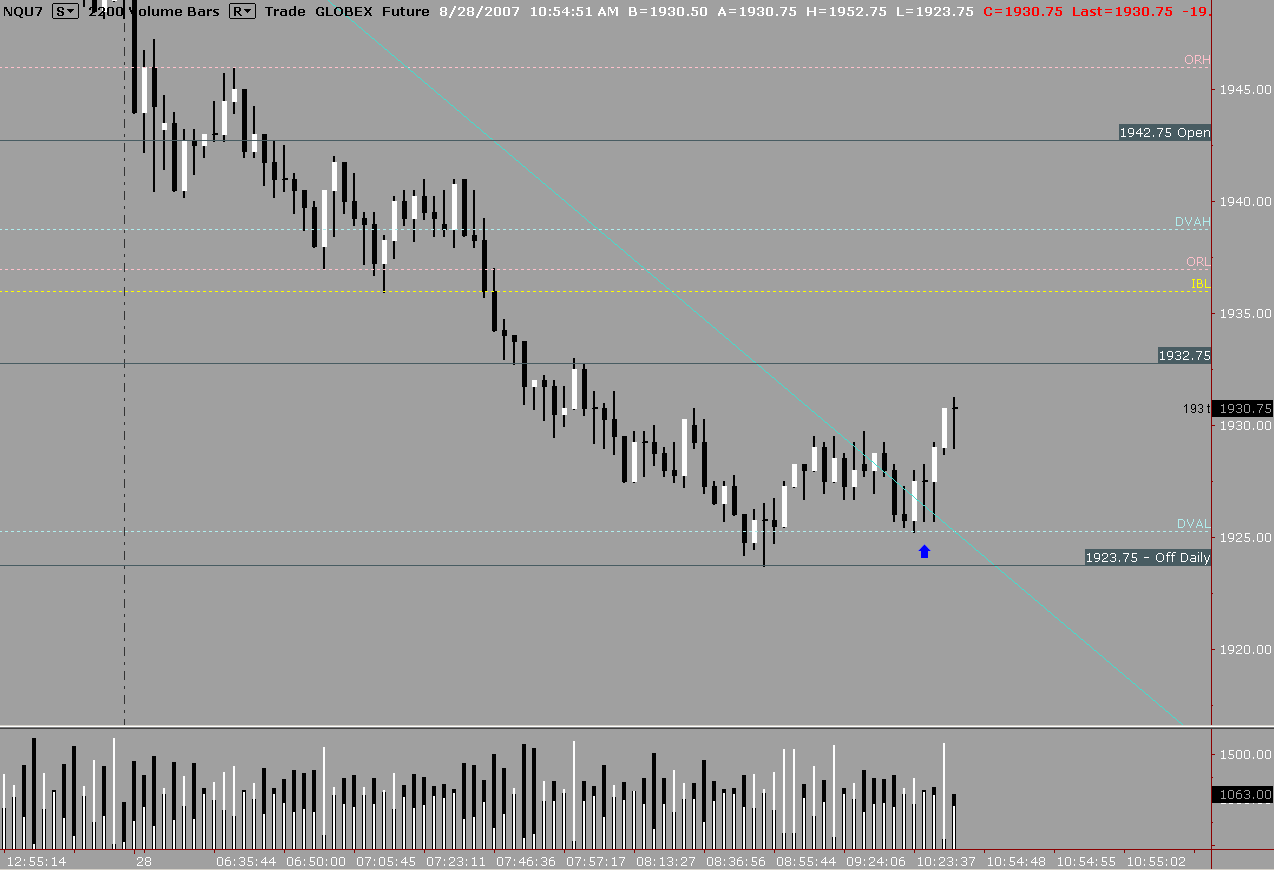
Hi,
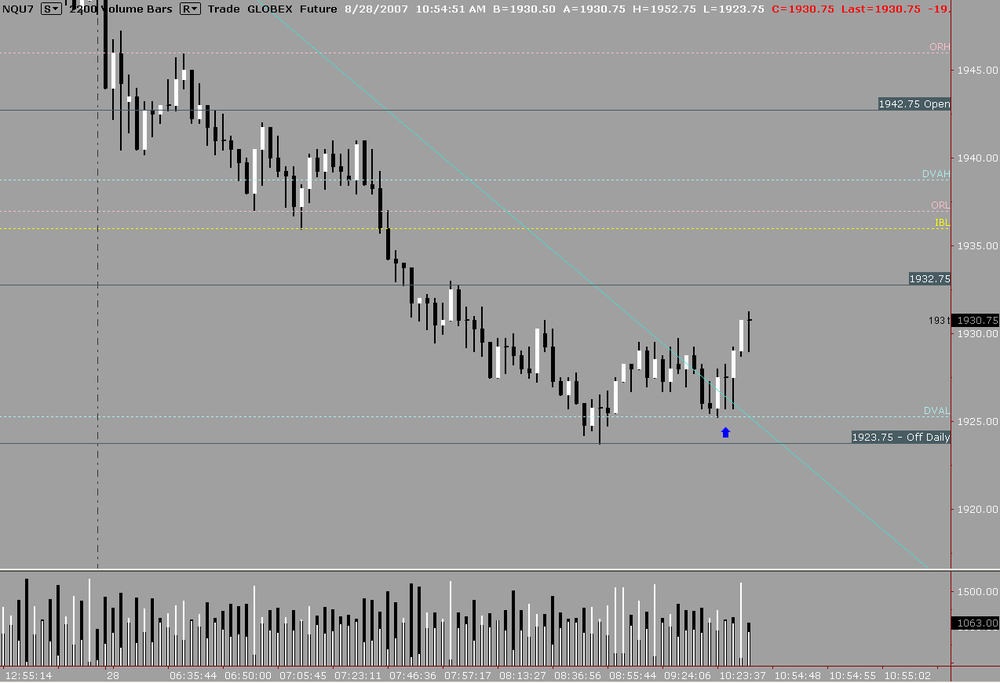
Posting a setup of NQ of a long off Developing VA Low. after a key test of a level off the daily chart.
-
Good Morning Abe, Good trading today!
GPS Trading
in General Discussion
Posted
After you have that lowest time frame precision....Send the drone.