
Welcome to the new Traders Laboratory! Please bear with us as we finish the migration over the next few days. If you find any issues, want to leave feedback, get in touch with us, or offer suggestions please post to the Support forum here.


sscott
-
Content Count
26 -
Joined
-
Last visited
Posts posted by sscott
-
-
Gucci, what do you think?
-
The explanation is actually much simpler than you think.
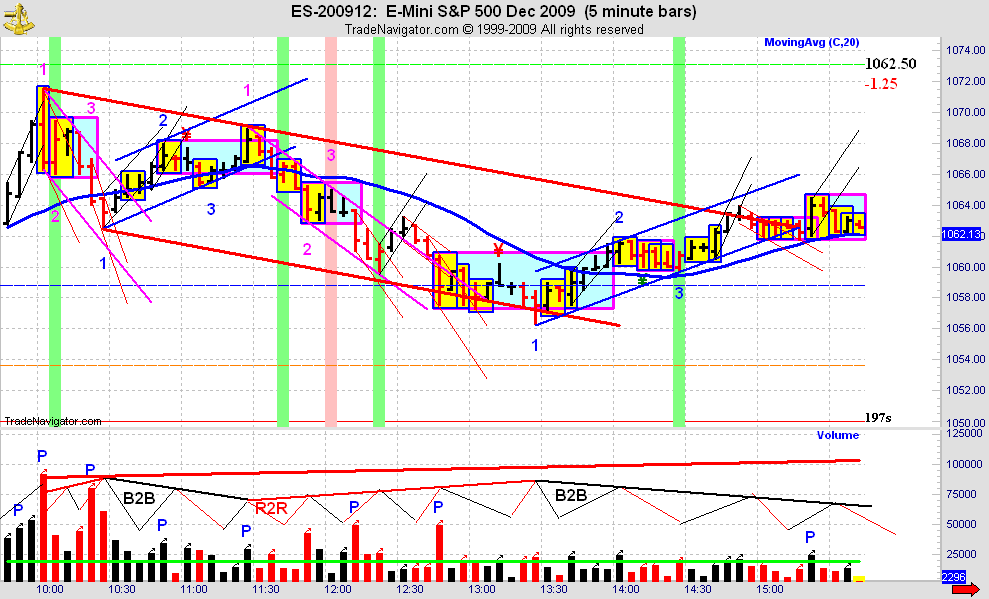
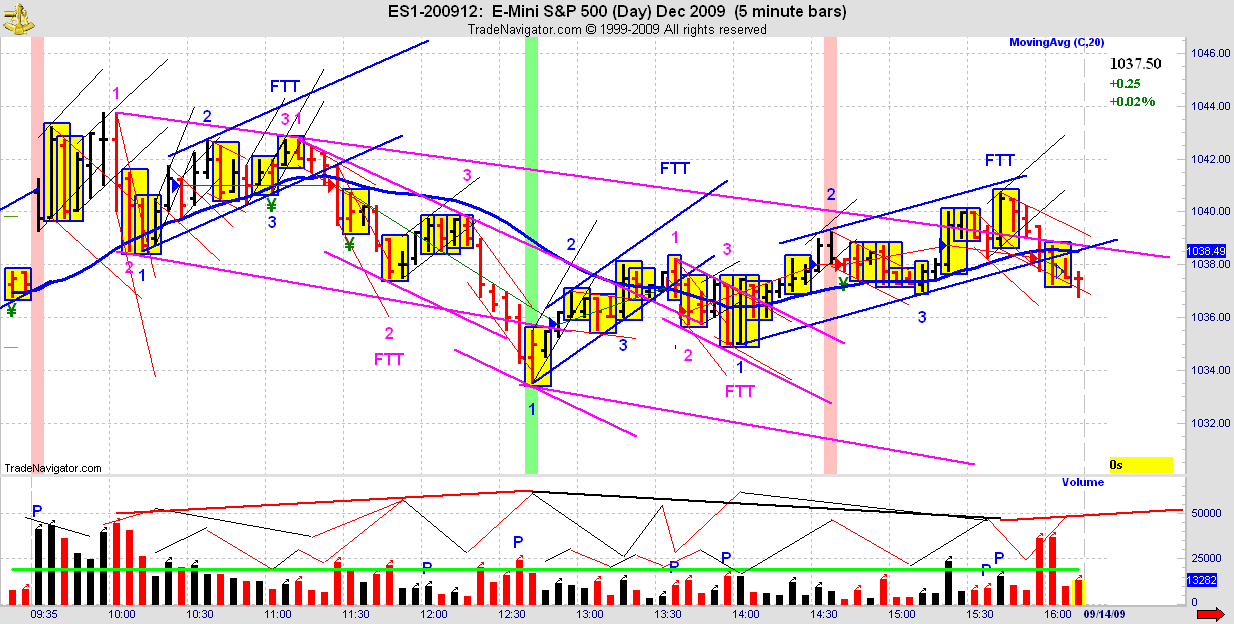
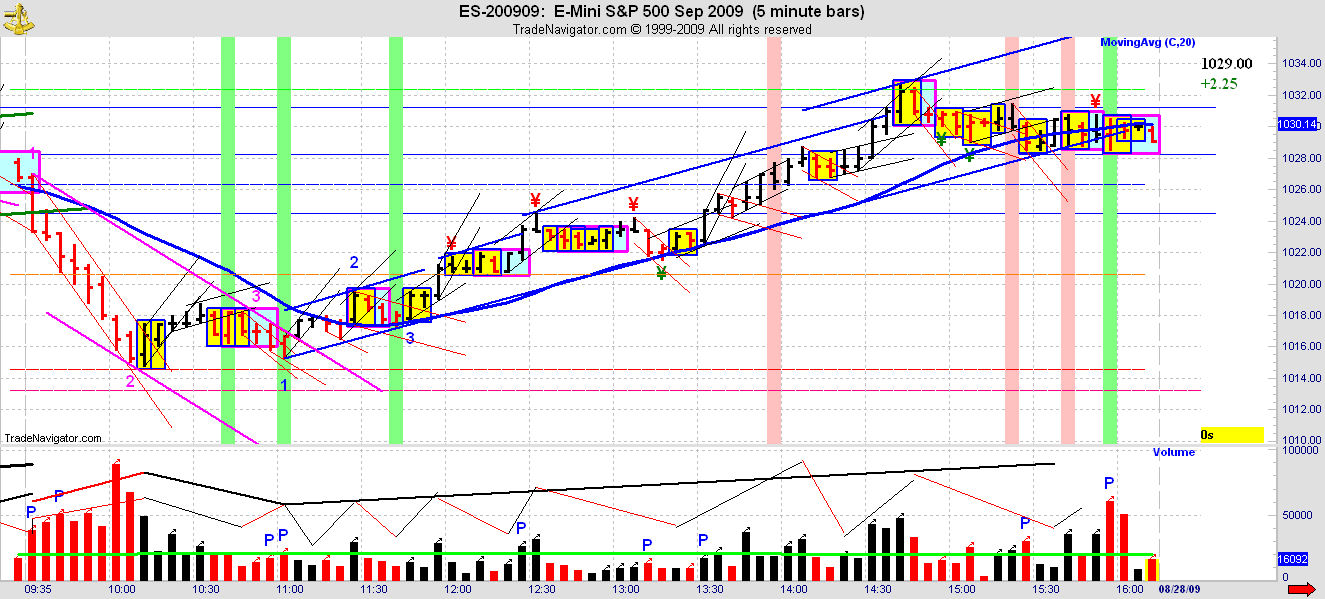
In the attached chart for instance, at what point in time can you be absolutely sure that the thing confined by deep pink lines is over?
Thanks gucci for the reply and the question. If you want to know absolutely that the thing in the deep pink lines is over, you must go to the 1610 bar for the completion of the B2B and the increasing black volume of the dominant bar. However, I see that there were clues prior to that, at 1545, increasing red vol completing the sequence of the pink thing, at 1550 an OB on increasing black Vol which breaks the RTL of the pink thing and signals to anticipate change. I also wonder why the B2B doesn't end at the 1610 bar which is also the pt2, because everything after that is non-dominant to the pt 3 at 1705, confirmed by the increasing black volume at 1720.
Thanks again, sscott
-
"The market tells you where the right side is. Spyder explained how to be absolutely sure about whether or not the market has changed direction. "
Where can that explaination be found? I would like to add that to my notes.
TIA
-
Just parked my entire 401k in cash today. Gonna wait out next month and see what happens....
-
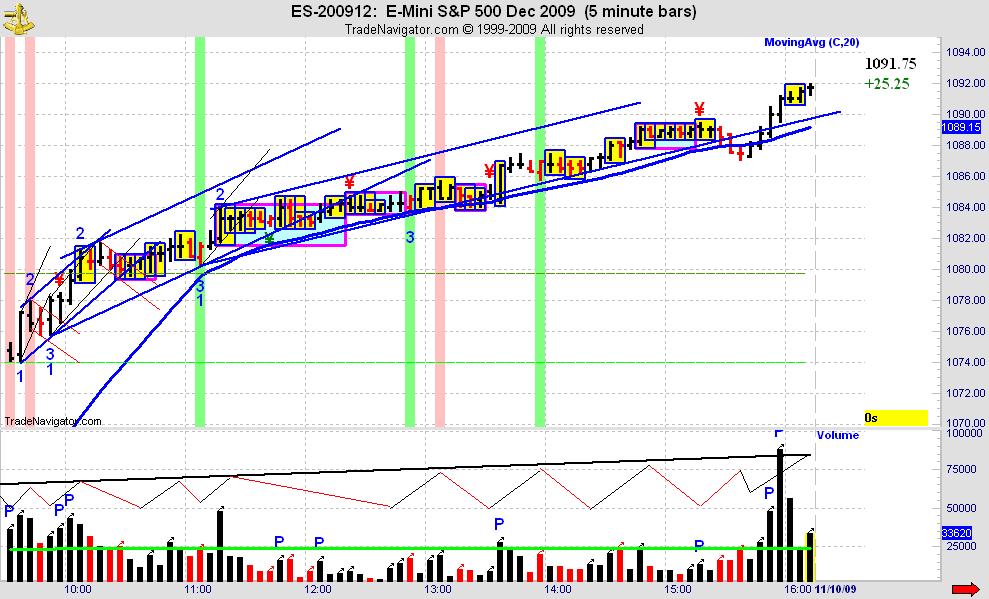
My chart for today, one trade, 11 points. I just held all day.
-
Good Evening,Does anyone have comments on today's ES activity?
MK
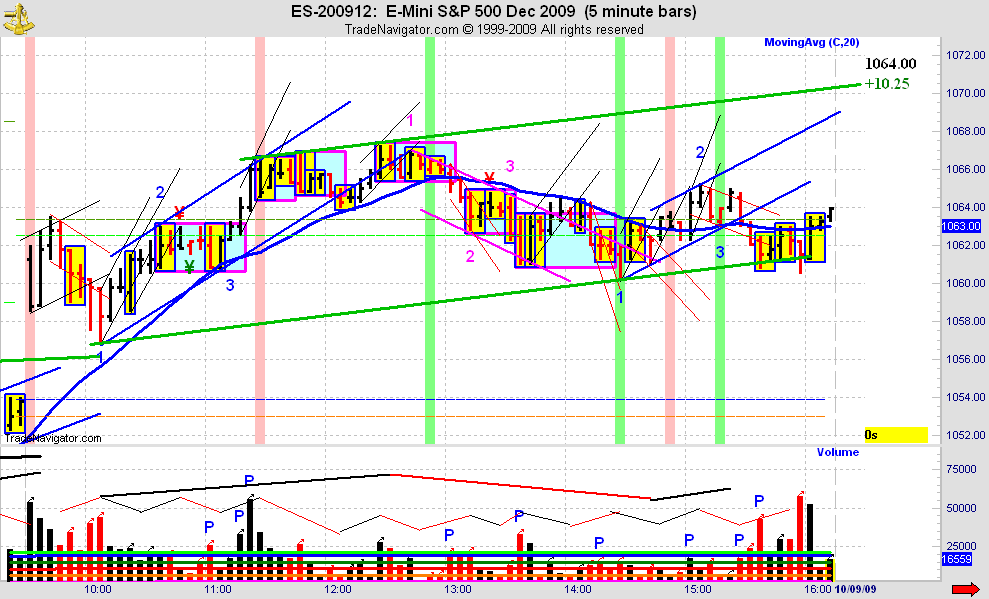
Yes, I annotated a small down traverse early and then started the up traverse that wouldn't stop fanning out. The market went sideways from 11:30 ish on (3 point range all afternoon).
My chart sucks today so I'm not going to post it.
sscott
-
My chart for today.....
-
My view of the day...
-
T But doesn't the red volume bars appear to reduce in height from left to right across the day on yesterday's volume pane? What to do when there appears to be different messages from the price and volume panes?Yes the red volume does decrease in the afternoon, but which was dominant all morning?
RED!!! the dominant slope is up, the price direction is red. Dominant trend price was going down, so the dominant (red) slope is up. We may have had a change in channel dominance in the afternoon, but we really won't know for sure until the market builds three traverses in a new up channel (WMCN)
-
GaussiansThe Volume Sequences (represented by Dominant and Non-Dominant Gaussian Formation) when matched with the above drawn trend lines for each trading fractal create the B2B 2R 2B (uptrend) cycle, as well as, the R2R 2B 2R (downtrend) cycle. Increasing Volume in the direction of the current trend represents dominant Volume. We represent such phenomenon with an increasing Gaussian line in our Volume Pane with the goal of syncing our trend lines with our Gaussian lines of equal weight See Attached.
To Be Continued ...
- Spydertrader
This quote is from the first page of this thread, also posted there is a guassian diagram
-
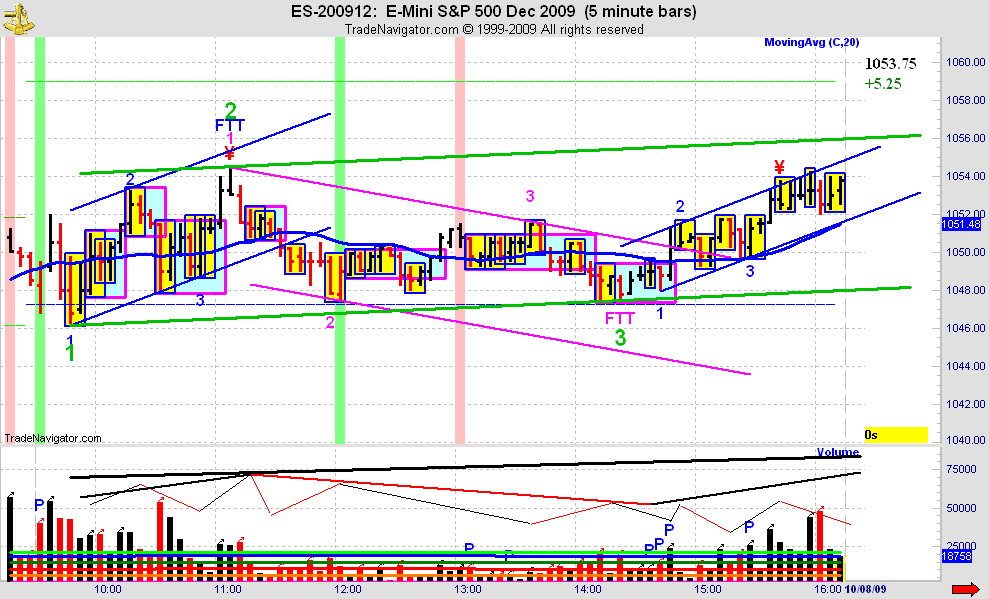
Thursday 17 September 2009I compare my guassians to yours and they are tracking the same points of change as to color, but are exactly opposite each other in the direction of slope of the dominant down channel along with the traverses contained within the channel. I use the color for price movement and increasing or decreasing slope for dominant or non-dominant movement. From the volume pane it appears the dominant price trend in the channel is down, so an upslope thick guassian to show dominance with a red color to show price direction would be the proper annotation. Unless of course you believe that todays channel represents a non-dominant retrace of a dominant up channel from yesterday. Context???
-
My chart for the 17th.
-
It seems to me that this statement doesn't appear to accurately cover all types of contexts.E.g. 2nd blue up traverse - 11/25/08, last pink down traverse - 02/03/09.
Thanks Romanus, I was out of town today and just reviewed your post. In both your examples there was accelleration, then two bars of decelleration (non-dominant movement) before accelleration of dominant movent in the direction of the traverse. I'll give you a more specific example of what I saw tomorrow, It's too late to think clearly tonight.
-
Modified chart below...."Accurately drawn trend lines in a chart Price Pane represent ‘containers’ of trend on the three trading fractals. We represent the fastest trading fractal using skinny lines (described as ‘tapes’) which, in turn, build the next slower fractal (represented by ‘medium’ weight lines) – known as a Traverse. These Medium fast trends (Traverses) build the slowest fractal (thick line weight) known as a ‘channel.’"...Spyder
It appears now that some are using "skinny tapes" to form "fat tapes" and "fat tapes" to form "even fatter tapes" etc etc. It is no wonder that many here are utterly confused with the terminology.
IMHO Taverses are ALWAYS made from Tapes, but not all tapes make a Traverese. In order for a tape to make a traverse, it must consist of at lease 5 bars and three tapes, one tape of accelleration, one of decelleration, followed by one of accelleration, forming points 1,2 and 3 of the traverse. And from my notes from NYC, one bar of decelleration does not equal decelleration. If anybody has anything to add, please do.
-
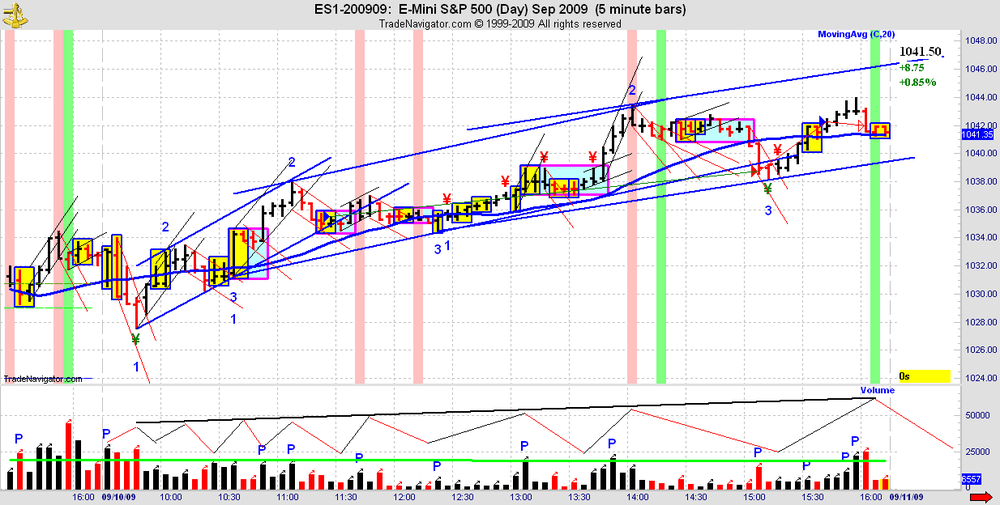
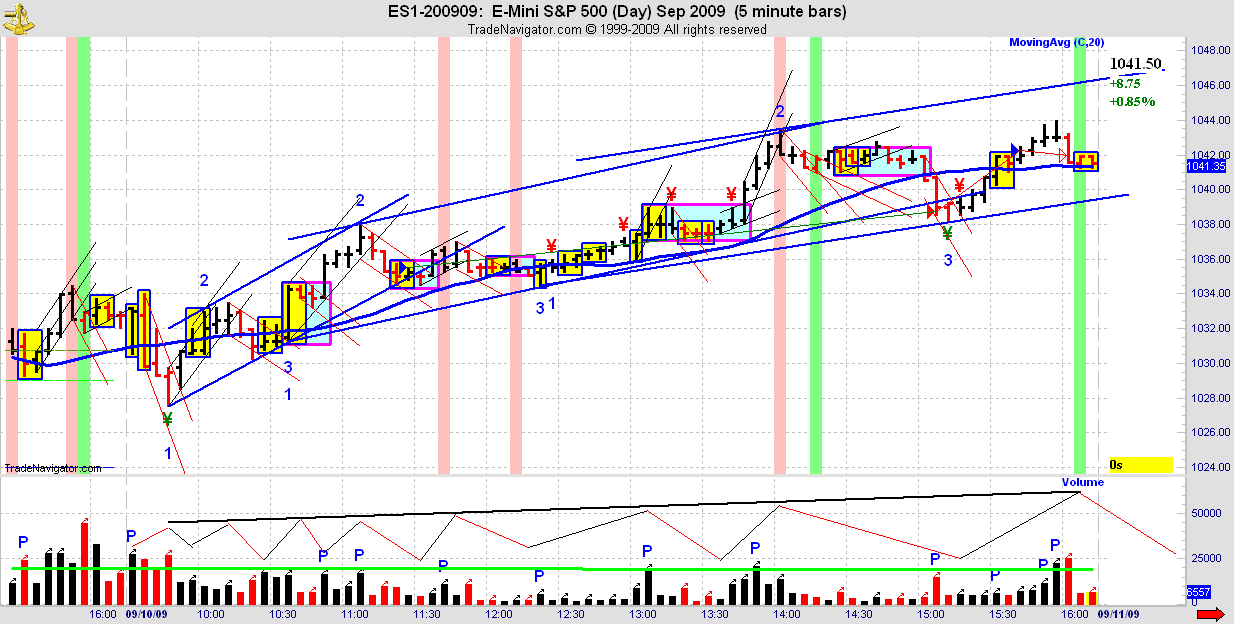
Chart for Sept 11...

-
Notice anything about the low volume on your chart?Check the next contract and see if that looks better.
D'oh!, thanks I switched over.
-
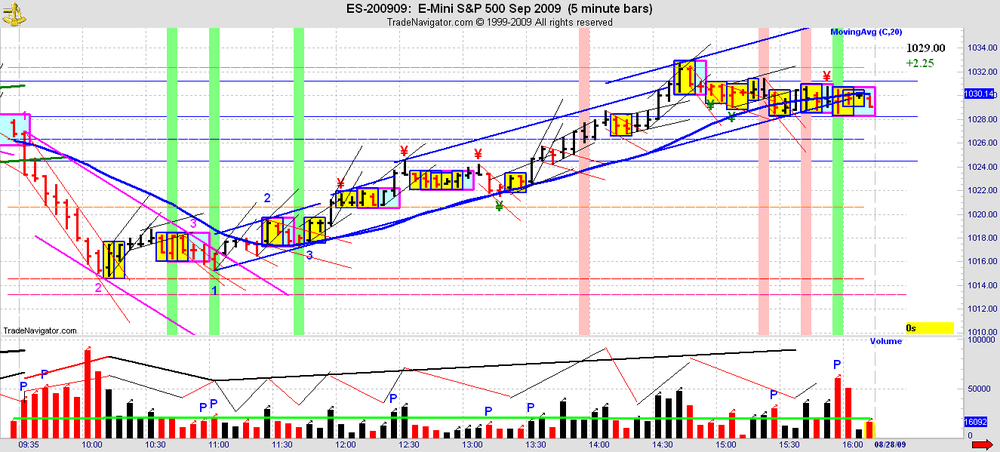
chart for Sept 10, 09
-
Yes, but if you're using dominance / non-dominance to determine the direction of the volume gaussians, what are you using to determine dominance / non-dominance?From my understanding of dominance/non-dominance. Always assume non-dominance until proven otherwise. Then;
1. A dominant bar must have Increasing Volume.
2. Price must close outside the range of the previous bar.
Exceptions: The first bar outside of a Lateral/Pennnant.
A Spike bar.
Bars within Lateral formations/Movement.
If anyone has any corrections or additions, please let me know.

-
My chart for today....
-
I've annotated some areas differently.Thank you for feedback. The reason I annotated the green up channel was because I had three traverses contained within channel. First the clearly dminant up traverse, then the non-dominant traverse on decreasing volume, then the up traverse on lower volume, but the black volume was slightly more than the red within the traverse. 1,2,3, sequence complete, look for change, which is exactly what happened cause the green up channel FTT'ed at 12:15 on increasing black volume. However, the red down channel started from an FTT of the blue up traverse at 10:30, not from the FTT of the green up channel I had annotated. Sooooo, I can see your point about there really not being a up channel associated with that. I'm still learning here so I really appreciate the comments.
Thank you.
-
Chart for today, Three levels of guassians, comments welcome...
-
My chart for today, and, any comments appreciated...
-
Updated today chart.
-
My work so far today, any comments would be appreciated.
The Price / Volume Relationship
in Technical Analysis
Posted
Gucci, yes actually I really do need you to confirm the correct answer. The market has spoken, but for me right now it speaks in a language that I do not fully understand. So to have you or Spyder confirm what the correct answer is would go a long way to help all of us move closer to fully understanding what the market is saying.