
Welcome to the new Traders Laboratory! Please bear with us as we finish the migration over the next few days. If you find any issues, want to leave feedback, get in touch with us, or offer suggestions please post to the Support forum here.


boomerangas
-
Content Count
24 -
Joined
-
Last visited
Posts posted by boomerangas
-
-
I've been on TL long time ago, just when i was in Uni. Currently, i work in London City in one of the investment banks and i have a lot of connections in financial community. So i'd like to mention, dear Urma, that NOBODY who is successful in this business doesn't advertise himself on TL and just satisfying his EGO for years. If you are successful ( like you are ) - you are too busy posting bullshit here on TL, instead you are trading, driving expensive cars, drinking fine cognacs in a Michelin-starred restaurants. I know nobody posting bullshit like you, but these people earning 10+ mil. annually, so i think you are earning even more so you have plenty of free time? So i'd suggest to do same for you, Urma, way you should be too successful and too busy to post in this "kiddies" board and to spend your valuable time.
p.s. don't trust any scam artists around - go for investment banking studies, try to get junior analyst job somewhere in Manhattan or London City, at least you will be paid on monthly basis and will see how things are really going here.
-
Personally myself have gained some edge on es these days and became profitable after i forgot following herd and to trade the trend. Here is my 2c what one should do to be profitable on es:
1. Throw away all the time-based charts, instead use fixed-ratio range, renko, volume or tick charts. They eliminate 70% of the noise.
2. Throw away sup/res from traditional charts. Instead use MP levels, it works really really great especially when Europeans are trading. They are good enough at the local usa time too but you can get false breakouts more often.
3. Don't day trade till 17:15 it will kill you. Instead, day trade, but leave position overnight if there is some reason to do it.
4. I'm heavily using worst-recognized techniques as the martingale but it just works fine for me, so you must have at least 10000 bucks in your account to leave position overnight and to add to the losing position. You can research historical data, and you'll see that there is 95% of time when next day's bar overlaps previous day bar by at least 3-5 full points. Here is a statistical edge if you are not correct with you entry. 1 basic rule - never martingale downtrend market there is always some chances to get a day like May 6, 2001/09/11 and so on. 2 basic rule - never martingale market till 17:02 if you are not correct with the entry and shorts are covering. Just try to add when everyone got margin call. You could see, how locals will correct this market in next 13 minutes till the close.
5. Try to learn not sup/res but where do big players want to see this market in next few days and trade just this direction, inventory really matters and where someone need to unload this inventory. These principles are very well desribed in wyckoff studies.
It seems thats all
 really will be happy if it helps in your trading.
 -
Mark, as from expirience from the trading just es for a 7+ years i could say you my truth. Don't even look at the indicators, keep in mind s/r BUT trade context. In 80% of the time, and it is THEIR edge, sup/res will be violated. Let's say price is rising and is flirting with a 1100 level currently trading at 1099. I could ensure you that this level would be violated and maybe not from the very first chance but from the second one. You could ask why? Because at the 1101-1102 there are large quantities of retail stops, and your too
and this level must be violated by professionals to unload long inventory, which was accumulated from the ~1160 ot 1180 level to shorts covering. That's true and every professional knows that. Intraday sup/res is very often just a lot of stops and are used for the inventory unloading. Basically it's very often just a last phase of the intraday trend. My strategy would be selling on the resistance violation at ~1103 and stop would be at 1105-06 because it's more probably than not that the resistance would be retested or there was just a fake break out to unload longs. -
Yeah, it seems that our styles are similar and really i'm concerned just with a timeframe on which i'm trading. And i trade range bars. No matter, what commercial do on 1 sec, 30 min or even daily timeframe. You could get spike in a matter of seconds like during flash crash and nothing else matters, just pure order flow from RETAIL traders. Value is either accepted or eithed declined. 80% rule works fine 80% of time, so you have 80% edge. MP VAL and VAH is everything i need. I'm just observing these levels and waching cum delta to decide if locals try to push price above VAH or below VAL. VWAP acts as a very good sup/res, so it's worth observing it. Also take a look on VWAP dev 2 and dev 3. You could earn your bread and butter just making counter-trend trades from just these levels. Put any ema to see the basic trend and you are ready for trading. Simple, no quant rocket science and i could to argue for a very long time that it's not worse in P\L than any of quant strategies.
Thanks Boomerangas. I think you're right in what you say. If price is taking a direction and it has some order flow behind it, then thats all you really need. Of course, if there is no real order flow, then you can start to look to fade. I was going to continue, but I'd only be repeating what you said! Generally, I'm looking for levels and trading off how order flow (volume, prints, quotes, pulling size, etc) acts around those levels. I'm not really into indicators, but I do use Market Profile for levels. Neither do I really have 'set-ups', patterns or shapes I look for.It seems as if we are quite similar.
One of the great jokes in all of this, is that nowhere have any of our resident Market Wizards explained the importance of time frame of those they are keeping score on. A very long term pension fund may well execute 40k in one blast. He may be looking to hold that for several years. It could be a hedge fund looking to cover tomorrow. Of course, to you and I, that doesn't really matter. How the market reacts in the 40k in the next few minutes may well do. But, to concern ourselves with who it was, why they did it, what they had for breakfast, well quite frankly, it's for the birds. The only use it has it to try and put ones self on a platform and claim some sort of intellectual superiority over everyone else, while making a complete ass of oneself in the process.
Good trading to you! I'd also like to thank all those who sent PM's in support. You know who you are
(Yes, even you Urma Blame, but I'm sorry, I'm still not recruiting yet :crap: ) -
Dude, so true words, but it's interesting what's your style of trading in details? What are you looking for to initiate the trade, which indicators are using and so on? Personally i'm pure order flow trader and it doesn't matter for me who are initiating trades. I'm just looking at cum delta have found no edge here. Really, if price goes up there is some reasons for it to go there and so on for the downward. Is it commercials, retail traders, hedgers, arbitrageurs does it really matters? There are so lot volume on ES and so many types of traders that we can complicate these things to the infinity. The big pool of liquidating retail traders could drive market much much higher or much much lower than any of the commercials but...Do you rememberg golden words of Livermore: "any commmercial, any big financial force can't hold price at the unfair level for the infinite amount of time. The market will be there where it should be."? So life is so difficult, why should we complicate it so much looking at who are initiating the trade...?
And so how do you know that a string of prints is initiating and not covering, or, part of a longer term accumulation or distribution/ adding trimming of a position?And in your earlier example of 40k lots sitting in a 3 point range (eg on the bid), how do you know that is a professional trading group (as you have now decided they are) sitting on the bid? Have you considered that it could well be 10k from a long term buyer initiating, 20k from a long term seller covering, and another 10k from an other participant, perhaps 'feeling lucky'.
I sincerely doubt that anyone would disagree that these are not 40k lots from smaller speculators/general public. My point is simply that to put a label on it and say it's from x market participant with y intention is a bit of a daft conclusion to come to. Don't you think? This is especially true when we consider all the tricks and games that these folk play to keep intentions away from the like of you and I.
Do you think there is a rule book the professional money manager follows when executing trades? Do you think if he is aggressively buying today he will dump it all in the market in one go, will he drip it in via time sliced orders, say 5 lots at a time every 30 mins over the next 2 weeks, will he have a policy of buying on declines only, etc, etc? You don't know. One day he may do one thing, the next he may do another. Some orders he may execute himself, some he may outsource to hide his tracks. You just dont know.
One rule of thumb you may find of use however is that these guys tend to be slower at getting in than getting out. Not all the time though. You just dont know.
Enjoy the rest of your holiday
-
Chris, i'm using cum delta studies in my trading too and it would be interesting to hear your opinion regarding one phenomena i've observed for a long time. Today this short-term scalping setup occured on crude oil near 72.80 level. Usually you could ride it for 20 points on crude and this happened today too. So basic rules - if the price is trading near some important "delta inventory level" or some important swing point and current cum delta is HIGHER in downtrending market than it was when price started slide down from this point it's short-term bearish sign? One could say, instead, that if the cum delta is rising and HIGHER than it was when price last traded at this point it means that more asks was hitted than bids and thus it's accumulation and not distribution. Just maybe it's short-covering phenomena? You have showed this setup in one of your vides too but have not said why it occurs. Thanks for explanation.
If you can watch realtime whether a zone of resting inventory is building or dissipating, I am not sure what you mean by failed? Also, where is the divergence and how many contracts are currently held? Middle of a recent multi-day range of price, on the upper end of an up trending multi-day range of price, on the lower end of an up trending multi-day range of price, on the upper end of a down trending multi-day range of price, on the lower end of a down trending multi-day range of price? The context of recent price/delta volume action and where the divergence is in relation to a multi-day range of price are all components that have to be accounted for.I have not seen any overall changes in the various Delta Volume Distribution patterns from 2009 to 2010 other than some volatility expansion again in 2010 (for the "ES" that is). The patterns have pretty much been the same for the last 7 years I have tracked the Cumulative Delta.....now getting into volatility changes, that is a separate subject (and how to account for the changes).
-
I wouldn't complicate things so much because you can't take blindly long/short signal on the indications of trade intensity. And if you can't you just are followin price action. You can't predict anything in this business. Let's assume that you are observing trade intensity spike. It means that agressive buiyng was met by agressive selling. But is there any edge? 5 min's later another big order from the longer time frame player could drive market much-much higher or lower just to the point where he want's to see this market and this spike could be nothing. As a real example it is a mini flash-crash of May 6. It would be very, very interesting to see all those buying spikes on UB charts all the way down. But price was driven to the point where someone wanted to see it. No matter what all divergences, intensities, deltas are showing. Pure order flow and price action.
Another example - you see that commercials are accumulating longs overnight, interest is rising. But someone sells to them? It could be retail trader or another, bigger, as Dalton describes, seller from the larger time frame, who will remove liquidity as on May 6 and market will crash in a matter of seconds. So if it is useless, why should one use it? Trade just a pure order flow, as a locals do, what is the diffirence is this order flow initiated by retail traders or commercials. By complicating things so much you could get "paralysis from analysis", trading is really easy if you have a good understanding of things such a price, value, under/over valued price and order flow. Really electronic markets have changed nothing here.
My
First, some Wyckoff:
"Whenever you study the tape or a chart, consider what you see there
as an expression of the forces that lift and depress prices. Study
your charts not with an eye to comparing the shapes of the
formations, but from the viewpoint of the behavior of the stock; the
motives of those who are dominant in it; and the successes and
failures of the buyers and sellers as they struggle for mastery on
every move."
Game Theory:
"Expressed in the specific terminology of advanced theorists,
poker (TRADING) can be defined as an asynchronous, non-cooperative,
constant-sum (zero-sum), dynamic game of mixed strategies.
While the game is played in an atmosphere of common
knowledge and no player possesses complete knowledge, some
players are better able to process this common knowledge into
a more complete knowledge than are their opponents"
-Pat Dittmar, "Practical Poker Math"
For those of you who have never traded in a live pit (before electronic execution became dominant), it used to be relatively simple to figure out trade "intensity" and who were the "dominant" players. If the pit was empty and everyone was reading the newspaper or talking about the cubs/whitesox, then there was no intensity. It was also straightforward to determine what the motives of the big players were as well as order flow, paper (literally), etc. As a local, you paid big money to either lease or purchase a seat in order to gain this advantage.
Now, electronic execution has made it much more difficult to determine who is doing what/when. That is why it is necessary to employ advanced methods (neural, genetic, millisecond resolution, etc.) in order to at least get a rough idea of what is really going on in the market (especially in the ES).
This is definitely not the only way to trade and make $$. But if I am making discretional trading decisions, I want as much "edge" on my side as I can get. At some point there may be overkill and too much info to process, but that is up to the individual trader's style and temperment ( I knew successful pit traders who barely graduated high school as well as genius/savant types who could count numbers like Rainman).
I'll be honest and say that I've learned a lot from UB's posts, but you have to do the work for yourself, and it isn't the holy grail. At least I have become more cognizant of the fact that there is a lot going on down to the tick/millisecond level that I was never aware of.
A lot of trading is about confidence in your methodology. Of course there are alternative methods to measure intensity and "commercial" participation. Maybe just a simple candlestick chart with volume is enough for some. I rather enjoy "forensic" trading analysis (ie picking apart trades, volume.bid-ask, up-down tick, etc. etc.) It is tantalizing that all of the information is seemingly right there in front of you, if you can only put it all together in a bigger picture. That is where I think advanced computational data mining/analysis, neural, genetic, etc. becomes necessary.
Have a nice Holiday weekend, and take a minute to remember why we have the day off on Monday.
-
I'd say yes, it depends from trader and market traded ( locals, market makers, big sharks doesn't use it ) But mid-sized desks are using this because it provides some vision of real sup/res and the real value of the instrument.
[HIGHLIGHT RED][/HIGHLIGHT RED]
I wonder if "professional traders" use Market Profile too. -
I'd say in addition that if one really worked in this industry for a long time as a dealer/broker/market maker/rocket scientist you should be aware that any serious trader, which trades 100+ ES lots per trade don't use ANY indicators. I never saw such a guy at the "institutionals" desks and Urma, tell me whatever you want.
p.s. it seems that Urma is having a bad trading day today ( you can't trade profitable if you are in the state of imbalance of nervous cells inventory
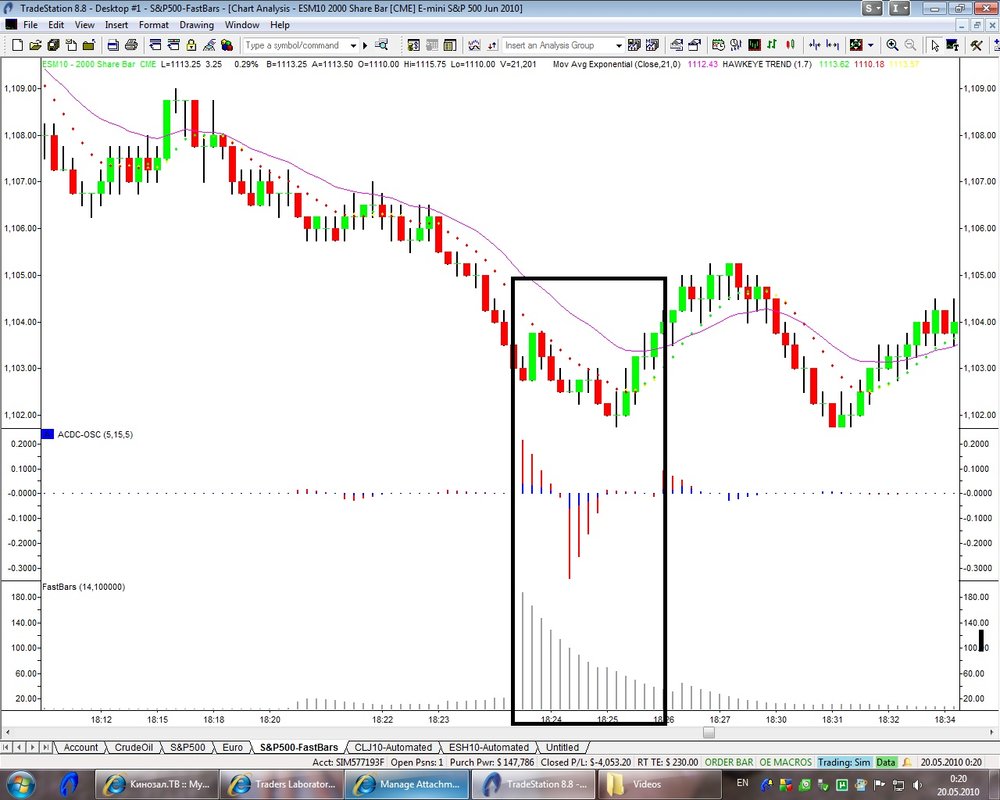
 ) Here’s BF point from way back early in the thread…
14 trades – all winners.
Not the slightest consideration (mental or coding) of ‘commercials’
or even volume (nope -bottom indicator ain’t volume…)
no Heads Up Display
no cross time frame, etc Intelligent Agents – except the ones inside my head and they aren’t that bright
no intensity readings…
not rocket science… if I can do it, many of the traders who are a lot smarter than me on here can too…
btw normally style on price chart is not +'s ... temporarily changed it for comparison purposes...
-
self-defend one more time. Man, nobody attacks you it's just mine subjective opinion.
QUOTE=UrmaBlume;97322]You might notice that I have been publicly thanked 403 times for my posts. I receive almost daily emails and pms thanking me and congratulating my on the same work you find worthless.
Some get a lot from my posts, some get a little bit and some don't get it at all.
BTW from what you showed me of your work, it in no way resembles the work we are doing in any form. But you already know that because I told you that almost a month ago.
UrmaBlume
-
Hey, Pat, i'm ethical person and i will not do same things. Just for a future - take it easy, you have very strong self-defending instinct. It seems that you've had some problems in your childhood or at school with another kids. Yes, i've reproduced your indicator and i've reproduced it to see if it have some value. I don't see anything wrong in these emails because i've just asked some charts from you to compare my work with yours. And now after the testings i see that it doesn't provide any edge. I just trying to discuss this thing and you are taking this as an attack to your person. You know, i'm talking the truth and here is a reason why you are so angry. The truth are attacking your EGO and worthless systems. Please, don't spam anymore, the person who have developed/will develop these indicators will see no value here and the person, who can't develop it wouldn't study nothing new from your worthless screenshots.
I agree but given the the situation where there is a huge spread between what they tell me and what they post in public, I think the public's right to know the truth trumps the duplicitous posters' protection. I certainly don't mind if they post my replies. -
As i said in earlier posts in my opinion these charts provide no value for the community because you are showing just a trends. I'm not pushing you to provide anything, nor i'm saying that it is a junk, just trying to dispute. I can show you a chart with a simple EMA's where are red paintbars and it is price below EMA and green - above EMA. I'd trade it tick by tick as your agents show. Or WCCI indicator, or any trend-following indi. All they screamed SELL. The main value comes when one/intelligent agent could avoid channel and to detect trend as early as it begun. I've programmed nearly 40 diffirent systems in my life and i could say that every system sucks if it's not detecting and avoiding chop and are not self-adjusting to x period volatility. So i'm also not so sure that your stuff is so great when there is no trend. Your problem is that you almost everywhere showing just a trends and what happened before this trend and no screenshots how did agents worked ( and intensity too ) when price was in channel all the day and every auto system sucked a lot. I'd say if the trader/system can't detect and to avoid chop it has no value, just mine opinion. If we could see how it trades chop, well i will say it's cool. If you'll say that you trade it, and this is not auto system well it's pure discretional trading. And good discretional trader doesn't need all this quant stuff. Look at the floor traders, they doesn't need any quant indicators and neuro advisors. Currently it's just self-ego fullfilling screenshots, because as you said there are no real quants at TL, and if there are some, all of them are working for you. Let's discuss chop avoiding/volatility adjusting techniques and not pure trend following stuff.
-
Don't get nervous, Urma, take it easy
. Here is "nothing personal, just a business". You've done a great work, it works for you, also helped ( theoretically ) to a lot of members here. I've just discussed, that there is no ultimate edge in this method and asked to post just one screenshot several minutes earlier. It shouldn't be hard task for you and it's just very strange, when you are saying that you have no time to deal with a 1 lot traders and to post something for the community but post the posts with a critics and self-ego fulfilling."I post here for 2 reasons 1) To try and get the brightest here to think about outside the box and 2) to try and spot talent"
Myself is not a talent, but you even don't want to discuss something in more details with a talented people and to attract them because what you are providing is 10% of info you know. And this 10% of info are unneeded and empty info for the real quant. Just my subjective opinion...
p.s. and just observations. And once again - no real reply to mine and cunparis questions, just getting nervous and a lot of critics...
QUOTE=UrmaBlume;97022]boom,
Cheating?
You have pestered me with pm's and emails for weeks and I have responded to most of them. I have tried to explain that I get requests/demands like this everyday and don't have either the bandwidth or the inclination to respond to such, especailly at this low level of concept and granularity.
You are doing some good work. Thanks for what you have shown me and for the kind words.
I will not write your code for you and I will not test, prove or disprove every thought, suggestion or situation that comes to the mind of every 1 lot trader here.
Almost none of the posts on this board are about the poster's original concepts or technologies. They are almost always about what someone is saying about someone else's work. Almost all of my posts are about our own, original, in-house development.
I enjoy posting here and am grateful for the hundreds of thanks, pms and emials I have gotten thanking me for what I have shared. Some have taken the hints I have provided and gone on to develop their own tools and they report improvment in their trading results. Others don't get enough to finish on their own and still others don't get it at all.
Unlike those that are ill-equipped to handle a discussion of the topic at hand, I spend zero time stalking and bashing those I disrespect the most.
As I said I greatly enjoy the conversations I have on a daily basis with TL members, thank them for the thanks I have gotten and have even taken some TL members on as traders.
I post here for 2 reasons 1) To try and get the brightest here to think about outside the box and 2) to try and spot talent.
UrmaBlume
-
Me too, really. Because it would be very interesting to see what happened on your indicators on 1158 level breakdown and what happened on the extreme. Urma, please, clear everything because it smells cheating. I could tell you the truth, that mine TI indicator sucked on these spike, it showed sell volume, which was just stops liquidating. And what helped me to avoid the loss - fully discretional trading and expirience. What happed later - just new trend, and if you have expirience you just are ridind such a trend till the first congestion. No predictive edge here, just trade what you see, and don't what you think. Strange, that you've just ignored mine and cunparis questions. Thanks!
Urma, I'm not sure if you saw my request, but regarding this post could you please post your chart for the previous 15 minutes? Thanks. -
My answer will be very simple. Any indicator, any ultra high-speed quant trading system, as Urma's system or reproduced TI indicator which i'm using DO NOT provide ultimate edge. You can't automate these things, because the very first channel of the price will wipe out all the earlier profits. Could these things help? For sure yes, but it's not uncommon to see the high intensity spikes near support/resistance levels, for the price just to pop up from here for several ticks and to break support/resistance just a few seconds later. I think UrmaBlume could would agree with it. You can't know who's driving move either commercial, which trades on 240 min timeframe either much larger, which basically trades on weekly timeframe an he covered 1/100 of his position on the spike just to throw price much much lower later. Personally i'm watching support/resistance, spikes near here, delta divergence in MD soft, cumulative delta, but the main thing is VALUE and where do Institutionals plan to accumulate/unload inventory, as i said in earlier posts. Yesterday HUGE short inventory was unloaded at the <1058 level, which was accumulated at 1165-1180 level. Any TI indicator couldn't tell you is it real breakout or just the shorts unloading inventory. So i'd suggest to just observe inventory and cumulative delta studies, or to trade pure order flow. Will it be delta studies, candlestick patterns or pure trendlines any volume/divergence/intensity indicator will be just a 10% helper here. I think the ultimate edge of UrmaBlume studies is not his indicators but himself with 30+ years of expirience, if for sure he is profitable trader.
QUOTE=SIUYA;96936]Interesting.....I am sure if you can actually front run (otherwise why say this is predictive?) or even tell exactly what goldmans and morgans etc are actually doing in terms of their trades then they would be very happy and interested to hear that.
If you have worked inside some of these places you will understand where they make a lot of their money - market making not trading, OTCs and options. Additionally a lot of the time, they are not 100% sure of where they make their money trading and tracking all their positions.
For a good laugh on this point read the Big short, and have a think about the recent GFC.
I have no problems with indicators that track divergences, volume and the like, it is just as a natural born skeptic find it hard to believe someone can make the claim as fact they are tracking actual orders for certain clients and market participants. I am sure this is not what is being claimed.
As was mentioned, a lot has to do with context and discretion and common sense and this indicator can help visualize elements of that.
(please take this in a positive light of a discussion point, not as an attack on anything in particular, except claims of fact that are next to impossible to prove)
-
Can't agree with you. There is several ways how to filter out "smart money" and "dumb money", it's very difficult to trade it, because more often than not it's counter-trend moves and it's more context trading, not pure mechanical trading. You should use your brains to analyze what's trying to do commercial's brains.
Yes, i agree futures is a zero-sum game but look, GS and JPM made money at the first quarter EVERY single day. It averaged 25m-100m a day. How do you think where all the money came from amd who are on the loss side
? Question to Urmablume:
Could you post earlier overnight screenshots of the action of predictive agents. I think any agent and any indicator wasn't able to predict today's short covering rally because all the night till 6.30 am commercials was pushing price down just to violate 1158 and 1156 levels. At 6.30 came pure reversal trend trade occured.
QUOTE=SIUYA;96859]just to add spice to the mix.
:2c::2c::2c:If you think you can actually determine who is buying or selling - then you are kidding yourself.
Nice intellectual idea, however even determining who is the smart/dumb money, institutional/commercial/retail money is irrelevant. Nice idea to chop everything up and look at the markets in a different manner..... however looking at a market differently will not change how the market moves.
If determining weather or not certain trade patterns in volume help determine as a filter a continuation or reversing pattern...... then maybe there is value.
It all seems to boil down to the whole conundrum of context and pattern recognition.
There are too many assumptions to believe that you can tell who is doing what, and more importantly the relevance of the situation. Professionals get it wrong just as often as others, and quite frankly for futures its a zero sum game, so how is all this relevant.
What is the relevance of another indicator?
-
Yeah, i know that, Cunparis, thanks. Bur really no edge here, because it could be just comercial volume absorbing all the retail traders volume near expected high.
Barry of Emini watch has an indicator that does something similar. It's called "Better Volume", it's free with the source code. it looks for a high volume bar with a small range. The small range means the volume couldn't move the price and it's likely to reverse. -
I'd like to suggest to you, blowfish, as to the good programmer to write some indicator which measures passive pressure to the price. Let's say trendline was breaked to the downside, volume is rising, it's selling volume but price is going nowhere. Or it is going down just for a 2 ticks, when, comparing to the normal volume, which is taken from the past ( database ) it should go for a 10 ticks down. As a result there is some passive buying activity here. I think we should measure volume/price changes to determine how do volume affects price comparing to the normal activity to gain some edge in these markets. What do you think, is there any way to measure this?
-
Smart man, smart trading soft, smart answers
. Really, no answer what is commercial volume by your mean, but it's your choose you have provided enough of valuable info for us.What's regarding the size of the trade i think it's useless because either large order is splitted and is shown as iceberg order. Example: 100 lot order is traded as 1-2-1-2-1-2-1-2
in matter of seconds. Either more often variance order is not shown at all - the price is driven to the "retail points" as i have mentioned above ( weekly trendline, 52 week high/low, swing high/low, fibonacci and so on ), this level is VIOLATED, stops were hit, and commercials unloads inventory as a passive buyers/sellers while stops are hitting their bids as on the yesterdays example. Look, what happened: price was driven to the 1100 level on ES, this level WAS VIOLATED, stops WAS COLLECTED by a passive commercial, which have putted the large bid which was not shown to any trader. Now we are ready to rebound on a daily charts? Let's see... What's regarding inventory here are another examples. As on Daily basis distribution on ES have taken place at 1165-1180 level, anything above was just stops running. You could see this on MarketProfile graphs and just with analyzing NET cumulative delta in either bloomberg soft either in any other like MarketDelta. Then, price was driven to the <1140 level, stops were hit, liquidity removed, market flash crashed on the may 6 and all this inventory was unloaded at ~1060-1090 level. Someone wanted quick profits and not to wait for a weeks when price will come to this point because of risk of rising economies. As i think all the UrmaBlume examples of TI was shown at these "intraday reaction points", because if you are large operator you need to create buying power or selling power. Market just oscillating between these points and i think we must primary track this, and intensity indicator just helps here.
With my respect to UrmaBlume i will not share neither sell my indicator, we have put tremendous amount of work in it and i don't need money. Instead, i could exchange it to some fresh genious ideas in trading volume.
Certainly size can show you that the commercial is present, i.e., the 2 lot trader never trades a 100 lot.The issue with the efficacy of this approach is that you need to differentiate between commercial spec trades and commercial permium aribtrage.
The commercial who trades for premium capture doesn't care about price, he only cares about the ROI offered by the current permium level.
The commercial spec trader cares nothing about premium.
My head of technology has had 3 offers from 3 different hedge funds in the last 6 mos to build technology to disguise just such entries.
cheers
UB
Size alone is useless for this work.
PS Does anybody know what's wrong withthe search engine. I can search usernames but not keywords.
-
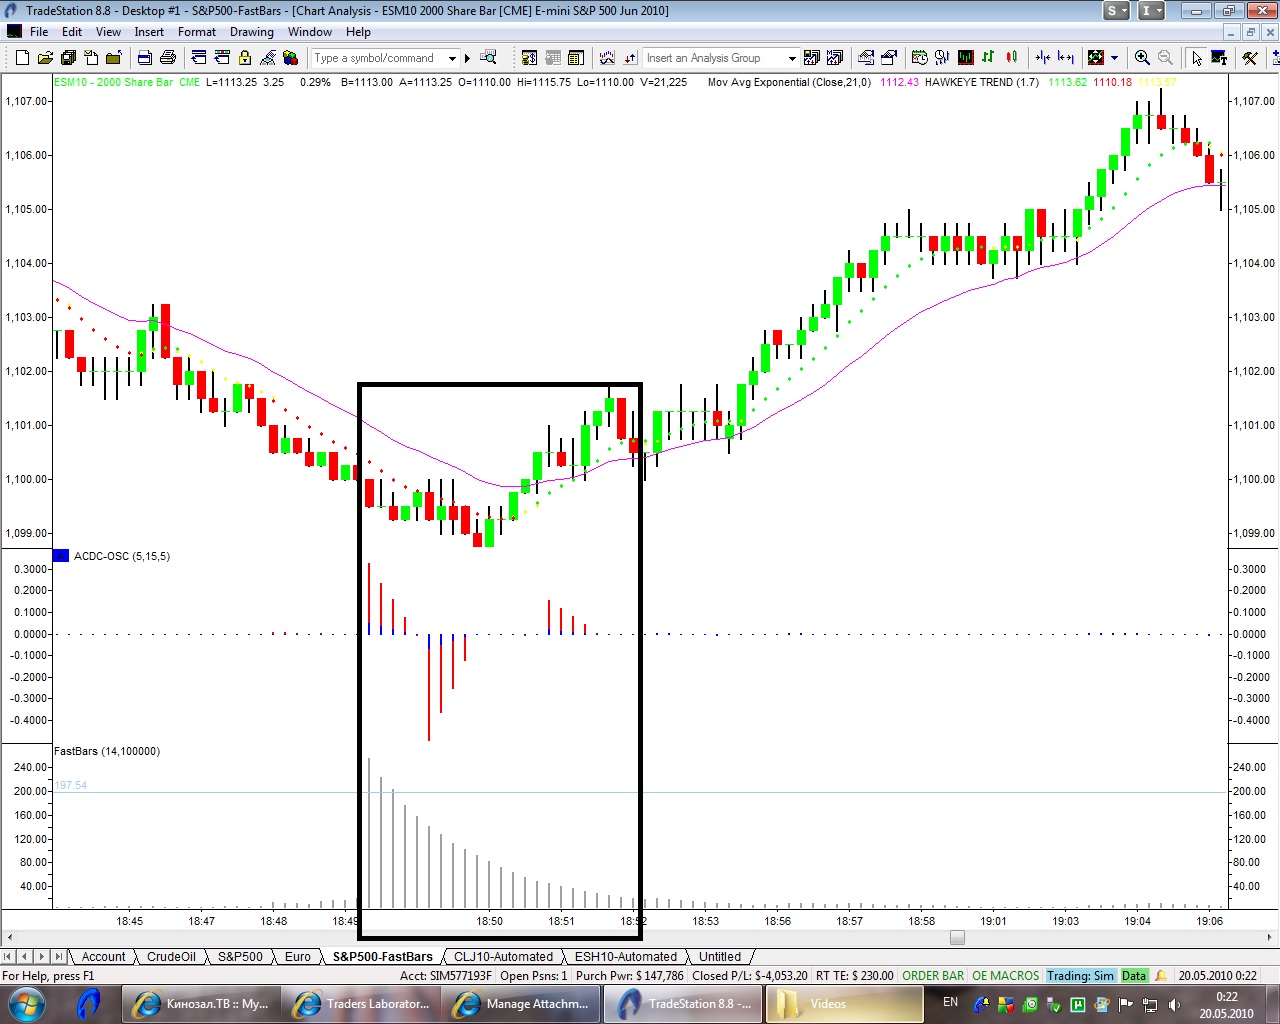
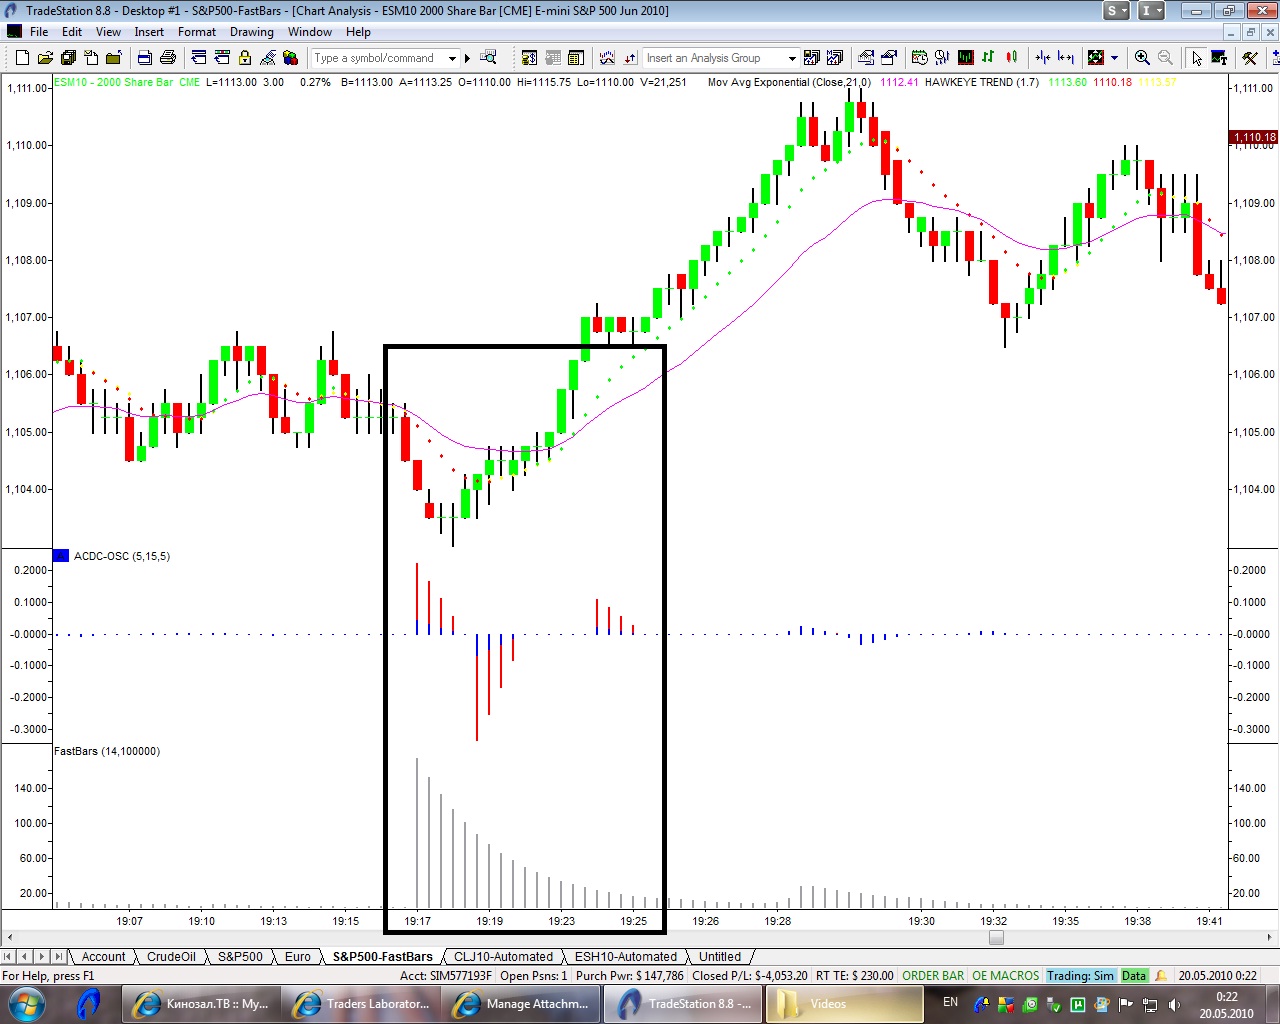
I've been following all the threads, started by UrmaBlume and i've developed trade intensity indicator. Personally i don't know is it 100% replica of original TI but it seems that UrmaBlume keeps this secret because he doesn't answered to any of my questions, just gave some hints. I like blowfish's idea and am sharing this idea. It would be interesting to hear UrmaBlume, but here is my opinion:
velocity of trade = price/time. Trade intensity = velocity of trade/time. Really my indicator measures with a 1/1000 sec precise how fast timestamps are moving and is it buying/selling tick. You could often observe, that commercial volume entered at specific levels ( pivots, trendline break and so on ), where all the retail traders are ripped. I observing this abnormal volume comparing this to the normal volume at this moment of the day and am calculating the total volume which have occured at these spikes. The total volume at the spike = acuumulated/distributed commercial volume. It seems that it works in some way for me, doesn't so good as for UrmaBlume but good enough too. Red spikes - buying volume, blues spikes - selling. Today accumulation have taken the place in three steps ( screenshots ). Just calculate volume on these spikes and you'll get commercial LONG volume. Would be interesting to see pictures from Urma.
-
No, i don't ask for the advice and i simple do not like to post something on the boards so that's why it's mine 2 post. But my trading expirience of 8+ years is worth something. Surely, i have some succesful concept, but your last posts isn't infomative at all. And as i have looked over all of your posts - everywhere same images, no concrete answers to any of traders and a lot of theory, no advices. So why are you posting, if you are not even ready to help with a simple advice? I wrote what i'm looking for when i analyze the volume ( last trade big sizes, contracts traded/second, same lots ) and what about you...?
-
Ok, but if have posted your concept here maybe you could give us some hints about this method. I don't think it could impact your trading results. It's very interesting to know how do you calculate the order flow? I'm trading by volume only and your concept is very interesting for me. Are you using bid-ask calculations for the indicators, or maybe the number of contracts flow/minute, 10 seconds, etc, or maybe you filter from the tape last size > than 10-20, or maybe you filter same bid/ask size from the tape per minute ( for example then funds try manipulate price you could often see bid or ask like this bid: 7-8-7-8-7-8-7-8-7-8-7-8-7-8-7-8 and etc. ). I have shared main concepts of analyzing volume and tape reading, so maybe and you could share some secrets of your indicators? Anyway, we do not ask to share the indicators!? You wanted to discuss this so, let's discuss it!
-
Hi, i found that your trading approach is great, but you haven't mentioned anything about this methodology. Could you share, please, where we could read about approach you are using and what indicators are you using? Thank you very much!
Time and Performance
in General Trading
Posted
You are not sure what you are talking about at all, MightyMouse. In all the private hedge funds you'll be fired the very next day if'll not be trading by a system rules or you'll make an even 3% unexpected loss for the managed portfolio.