
Welcome to the new Traders Laboratory! Please bear with us as we finish the migration over the next few days. If you find any issues, want to leave feedback, get in touch with us, or offer suggestions please post to the Support forum here.

shrike
-
Content Count
85 -
Joined
-
Last visited
Posts posted by shrike
-
-
Hi aaa
where do you put this :
if Cycle_Price.Choice = 1 then
Cycle_Price = ( $b_T3A.s((H+L+C+C)/4, 5, 2.3 ));
if Cycle_Price.Choice = 2 then
Cycle_Price = ( $b_T3A.s((H+L+C+C)/4, 5, 2.9 ));
if Cycle_Price.Choice = 3 then
Cycle_Price = ( $b_T3A.s((H+L+C+C)/4, 3, 2.3 ));
in the function or in indicator ?
-
Hi Wallan1
when i try to compile on multicharts i have an error , and i cant open the function , is password protect .

Compiled with error(s): ------
Wrong expression
errLine 24, errColumn 14, errLineEnd 24, errColumnEnd 51
-
Hi
i found this code 4 ergodic
{Ergodic Indicator:} {from William Blau's book --- "Momentum, Direction and Divergence" FORMAT: Ergodic_TSI(Price, r, s, u,, SmthLen) where r = length of first EMA smoothing of 1 day momentum, s = length of second EMA smoothing of 1 day smooting, u = length of third EMA smooting of 1 daymomentum, SmthLen = length of ema signal line. This is plotting the Average only (value2)} Inputs: Price(c), r(7), s(27), u(1), Zeroline(0), SmthLen(7), upcolor_1(green), downcolor_1(red), dotsize(2); Value1= TSI(Price, r, s, u); Value2= XAverage(TSI(Price, r, s, u), SmthLen); If value2 > value2[1] then Plot3(Value2, "SigLin", upcolor_1, default, dotsize); If value2 < value2[1] then Plot3(Value2, "SigLin", downcolor_1, default, dotsize); -
this code i found on mesa's website , i just add an exp mov

Inputs:
Price((H+L+c+o)/4),  Len(28),len2(14);
Vars:
alpha(0), Filt(0), MaxCorr(0), Corr(0), IR(0), J(0), Phase(0), Signal(0), Lead(0),medi(0);

alpha = (1 - Sine (360 / Len)) / Cosine(360 / Len);
Filt= .5*(1 + alpha)*(Price - Price[1]) + alpha*Filt[1];
MaxCorr = 0;
For IR = 0 to Len - 1 Begin
Corr = 0;
For J = 0 to Len - 1 Begin
	Corr = Corr + Filt[J]*Sine(360*(CurrentBar + IR + J) / Len);
End;
If Corr > MaxCorr Then Begin
	MaxCorr = Corr;
	Phase = IR;
End;
End;
Signal = Sine(360*(CurrentBar + Phase) / Len);
Lead = Sine(360*(CurrentBar + Phase - 2) / Len);
Plot1(Signal);
Plot3(Lead);
PLOT2(0,"O");
plot4(XAverage(Signal,len2),"med");
-
-
may i post few page of the book , where i copied formula ?
-
Why are you sad about it?i make a ts on some EU share or futures , but the variable "move of USA futures or market " i'm not able to do
i'm in UE ,so each movement from USA , here is amplified and hard to manage .
so is easyer trade USA stock and futures
-
Hi
i found and read the book , but when i tried to copy code found in it , this not work and i found many errors
-
Hi
sad telling this but
night and day European markets are driven by USA futures ,and when open ,by the USA markets
.try it with matlab this Kolmogorov-Smirnov Test
-
-
ok
of course needs find some rules about the difference and maybe the duration of time but but to a quickly look seems interesting
-
Hi
hey tams but you are a fantastic with code el :beer: , yes this is what i'm thinking on
-
Hi Tams
i have not been very clear considering of my bad english :embarassed:
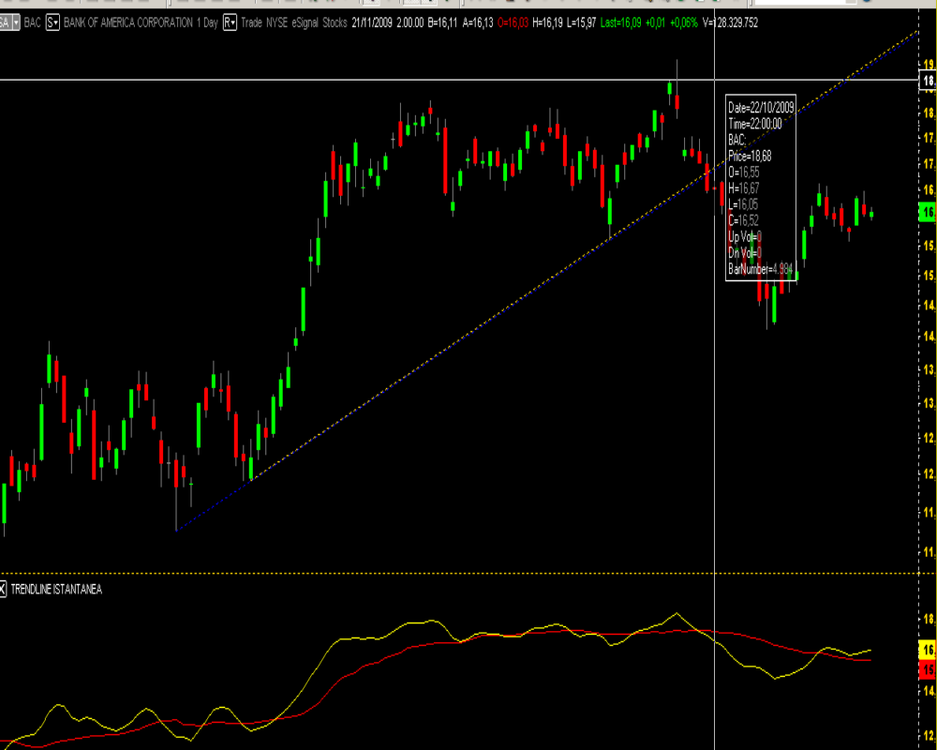
i have been thinking critical points are when difference between red and yellow line is big , i don't know exactly how much big .
for instance in my chart where i start the trendline , after wait for yellow line go up , also here we must have also a significant difference , yellow line goes down again and there is another difference , after line yellow goes up again and then we search the two min and we match them with a trenline .
we wait if trendline is breaks ,if yes ,we wait for a retest on trendline and then we work there on.
the same for the positive difference
-
Hi Tams
i've only gave a quick look and first impression how to use it ,considering we are speaking about a trendline , is to wait when there are two cross , maybe better with a big difference , wait if trendline is broken and take position ,only, when price come back on trendline
-
Hi Charlton
thanks for the links :beer:
-
Hi Tams
maybe you should draw a trendile from points where difference between two lines is high
,i haven't find a right measure of difference but seems me at least two point , i'm searching and making some test
-
or better rename it as : VChart :beer:
-
HelloI cant compile in MC error by error appear, who knows the secret?
Any other info in inet by same topic is found?
hi
open function and in variables write this : VChart(0) ( remember comma divide each variable )
-
hi
crazynasdaq ->Tick Data Processing
if i've understood well you take free stuff and after sell them ??? mmmhhh
-
thanks for sharing your indicator
-
hi
thanks to everyone , i'm working on your advice
-
thanks BlowFish
make some attempts, what do you mean with reset code starts here
maybe replace : if date > date[1] then begin
with
if mod( (TimeToMinutes(time)-TimeToMinutes(iStartTime) ), TimeToMinutes(ResetMinute s) ) = 0 then
begin
-
hi
thanks Tams for help , i tried it and work but what i found sometime an error because if i plot it on a range or volume chart sometime where is not a candle at 0900 so or return an error or skip restart when find a candle at 0900 . i try this :
if time = iniz or time =iniz+1 or time =iniz+2 or time =iniz+3 or time =iniz+4 or time =iniz+5 then begin . not elegant but must study more language code
i 've seen one post where you explain a formula with begin_time and end_time , i tried to insert in the code but dont work
-
hi
could someone help me to modify the DBVWAP_SD so i can starting it from a prefix hour like 0900 or 1100 , i've tried much times but nothing

Instantaneous TrendLine
in Trading Indicators
Posted
Hi aaa
sorry i've just saw your code :missy: