
Welcome to the new Traders Laboratory! Please bear with us as we finish the migration over the next few days. If you find any issues, want to leave feedback, get in touch with us, or offer suggestions please post to the Support forum here.


mikew
-
Content Count
40 -
Joined
-
Last visited
Posts posted by mikew
-
-

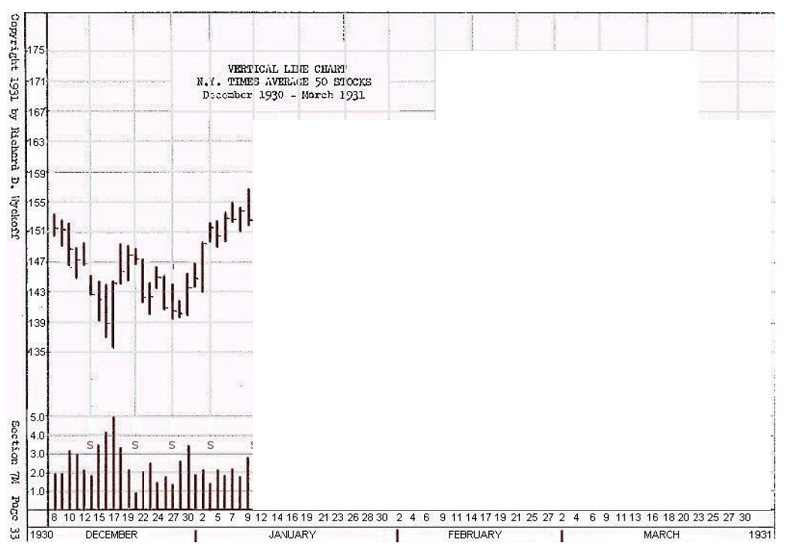
Such a reaction begins on the 12th and the low point of it occurs on the 16th. Volume on the reaction diminishes appreciably compared with volume on the rise from the December 29th low, a bullish indication, showing that the selling pressure is light.
Playing devil's advocate, why can't this be viewed bearishly as, "volume is low on this pullback, indicating that there are no buyers, price is dropping even with little selling pressure."
On the 16th, the closing is nearly at the high point of the day -- a bullish indication which is the reverse of the bearish indication on the 9th. This is our first sign that the reaction is nearly over. (*)
I don't see any special volume on the 16th, but closing near the high is a bullish indication. But, again, playing devils advocate, I see the same thing on the 14th. Prices were supported from the previous drop on the 13th, and now on the 14th, it closes at the high. But there is no mention that this is an indication that the reaction might be over on this date. But the market is always right, and if I would've went long on the 14th based on this, on the 15th I would probably be stopped out
(*) So here we have a new buying opportunity in expectation that the advance will be resumed. (**) Further confirmation of this comes in higher support on the 17th and in an almost complete drying-up in volume on a dip to the same low level on the 19th. The closing prices on the 15th, 16th, 17th and 19th show support within a narrow zone, mostly around 147-8. We must, therefore, look for the advancing tendency to be resumed.
-
Ok, Wyckoff continues
Having decided that the trend of the market is upward we must thereafter continue to trade on the long side until there are indications of a change in trend, or until the trend is in doubt. We must always be on our guard against any changes; and when the trend is in doubt we must take a neutral position, that is, be out of the market.

However, I'm stuck on his contradction. Bold is mine
For the next several days, until January 9th, the market makes further progress on the bull side, recording 156½ on that day; but observe that the closing figures on the 6th, 7th, 8th, 9th and 10th are all within a range of about one point. That means the market made no upward progress as a net result of four days’ activities following the 6th. The daily volume shows a tendency to taper off, which may mean a lessening of demand at the top of the swing to January 8th. This conclusion is partly confirmed by the shortening of the upward thrusts from the 3rd to the 7th, indicating that it was hard work advancing the market from l5O to 155. Buyers now seem reluctant to follow prices upward. On the day when the high of 156½ is recorded, the volume increases abruptly compared with the volume of the preceding sessions at the same time that the price runs up to a new high only to close near the day’s low (*) and actually below that of the previous session. All of the foregoing is evidence of the approach of a corrective reaction, but we still hold our long position because, as yet, we have had no indications of important distribution.
* The action of the 9th is an illustration of a typical buying climax, which is the reverse of a selling climax. On this day, a poor quality of demand is being promptly overwhelmed by the superior force of supply of good quality. In order words, the bulls, realizing that they are encountering resistance to the advance, break the stalemate of the 6th to 8th by bidding prices up to attract those buyers who were too timid to come in before the advance to 155, but who now fear that the market may get away from them because it is “making a new high.” Thus, there is a concerted rush of public demand which gives the larger and shrewder operators their opportunity to dump part of their lines on a broad and active buying wave, made to order for the purpose.
He says there is no indication of big distribution. Is this because the volume on this climax is lower, relative to the previous selling climax in mid December?
If he sees a corrective reaction in the future, why not close the long trade now, and either go short, or buy more at the bottom of the reaction? He says to hold onto the long position, even though he expects a pullback..
-
I think I'm getting it.. !
If everyone who holds a stock is sitting on large losses .. This is a certain Technical Position.... Now if they all sell and Now all the new buyers are sitting on small profits
The Technical Position is totally changed....
It would not go up until AFTER they SOLD.
Once they did sell... Not much could stop it from doing so.
My initial question in the thread was exactly this. I was wondering, well if the people who are on big losses decide to sell, their selling would contribute to the downmove even more, so why wouldn't the downmove continue stronger?
But you say, "not much could stop it from going up". I think I understand it now. The future is now up, because all the people who needed to sell have already done that. And even if there are new short positions who expect the price to go down, eventually they need to close their positions, which will contribute to more future buying pressure.
This quote from Olsen helped me:
In liquid financial markets, up to 98% of all the trading is based on speculative
positions and the hedging of those positions. These positions, being
speculative, are temporary, and any opening trade will need to be closed.
The closing trade has the effect of inducing a price reversal. Due to the duality
of the opening and the closing trade, the price movements are never
fully one sided. At some stage, sooner or later, positions will be closed
and then the price rebounds will occur.
I wasn't really taking into consideration that every open trade needs to be closed. And whatever pressure that occurs as trades get closed, that is 'weak' quality, right? And the side of the trade that is just being opened is of 'strong' quality? So after a sharp decline, all the panic selling is 'weak', because they are closing out their losing trades, and now all the 'strong' buying is opening their position.
You should study DbPhoenix's blog. It will show you the basics in a very structured and clear way. Use the list of content on the left side to navigate, and start from the beginning.
I have read his blog, but I will do it again now after the insights and help from everyone so far in this thread.
But there is a different quality when you can ask questions and get direct feedback from everyone including yourself. So I hope its not a problem if I continue this thread further. So far we've only covered the very very beginning of the chart

-
thanks motorway
Never underestimate the importance of the Technical Position ( as RDW tells us )
it is the "Where From"..
Can you explain what you mean when you say "Technical Position"? Do you mean the quality of the buyers and sellers? (Sorry, I just searched the course and found a good explanation in Section 14M)
And you've mentioned "where from" twice now, but I don't understand the reference.
Thanks again
-
Thanks motorway
Try Richard Olsen...Think about climaxes and this dynamic
THINK ABOUT PRESS: How to Trade « OlsenBlog
As the trend progresses, the ratio of trend followers and counter-trend
traders tends to become ever more one sided, and eventually 70 to 80
percent of the open positions are counter-trend.
I don't understand this. How is the conclusion that mots of the open positions are counter-trend? Wouldn't that in effect mean that the trend would HAVE to be reversed by definition?
Ok another thing then to consider is the increase and decrease of the population of interest.. Which can shift the dynamics and make "where from" less important...
What is the tendency of stocks after they have been going up
what is the tendency after they have been going down..
Hrmm.. Without thinking, I would say the tendency after they've been going up.. is to continue going up. The same with going down..
-
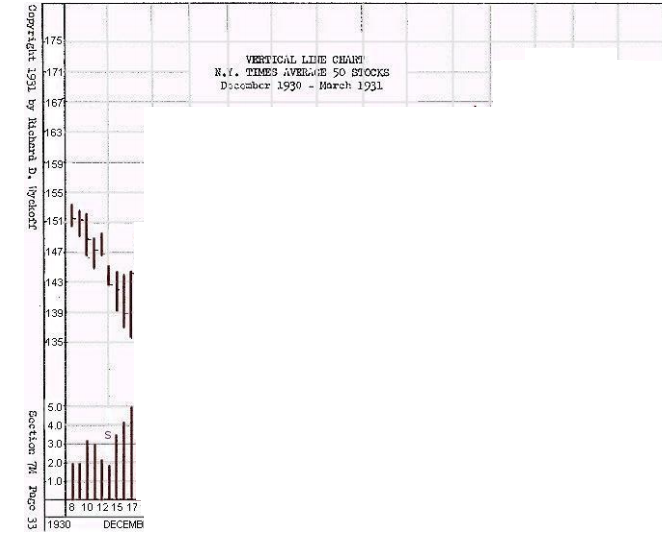
That is one of the perennial issues imvho. When is a climax the climax. Quite often you will get what looks like a climax in an area where you might anticipate demand, only for price to move lower and do the same at the next area, on even higher volume.Right exactly. Thats why I went and used the day before on the 16th as an example.
But you could even take it back further.. Suppose we only know the first 4 bars on the chart. Well the two bars on Dec 10th and 11th look like higher volume (over 3m, highest we've seen yet) and a bottom and on the 11th the bar closes nearer to the top. So on the 11th, we might start thinking "selling climax" only to see it go lower over the next 5 days
-
Thanks to the previous three posts. Its starting to make sense now. I'm going to go over it some more, and then I'll post my next set of questions.
One last thing:
Lets take it one bar previous. Dec 16th marks an increase in volume as well. On the 16th, you could just as easily say that this is climactic volume (over 4mil). But do you assume that the selling isn't finished yet, because the price closes at the low? Meaning, theres no buying power yet to turn price back against all the panic selling? Obviously with such high volume (the highest on the chart yet, since we don't know the 17th yet), there are buyers trying to halt the decline, but the selling panic is still too much.
-
First, I'd like to know what you mean by "last support buyers being taken out".Perhaps you meant that the price and volume spike could have represented the last people willing to buy there, and if price re-approaches the low then there might exist no further demand, correct?
Yeah, thats what I meant. This is the problem I seem to have in interpreting large volume spikes. Let me try to explain my problem further.
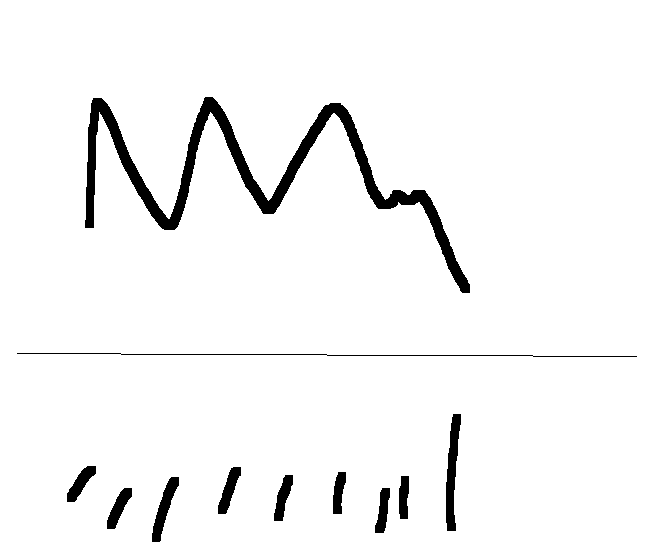
Lets say theres a horizontal range of choppy up and down trading. Support and resistance lines have held a few times now. Lets say the next time price approaches support, we get a big down bar on high volume:

Would you conclude that this is indicative of support being "taken out" or "not holding", and that price may continue further downward? That's is how I would look at it; am I thinking wrong? But if I apply what I learn in this example, I could say, "well we broke out of the horizontal range and support didn't hold, but maybe it was just panicky sellers and all those trades were matched with strong buys."
Since there was so high volume, you know that a lot of people were involved at these prices, hence the prices are now important. The climax establishes a tentative support. Tentative. Only if and when price re-approaches this price again, then you can observe and judge whether the selling pressure re-appears and overwhelms the remaining demand, or whether the selling is exhausted and buyers compete to buy more.
Therefore, in most cases you must wait for a test to see if the demand is still present and if the selling is exhausted, or if the buyers who bought the seeming climax are getting rid of whatever they bought and almost noone seems to want it.
Right ok, so we wait for a test of these lows again to see what happens. I think this is the point gassah was making in his attachment. Wyckoff does go on to say that confirmation will be provided on the next swing move down, to see if the price holds. I didn't quote that part in my original post because I was first stuck on this original climax.
-
Hi,
I'm new to trading in general, and have tried to understand the stuff posted here. I'm just starting to go through the Section 7M pdf, where Wyckoff gives his analysis of a daily chart. I'm finding that I have tons of questions as to how and why he's coming to the conclusions that he is.
If the forum doesn't mind, I will be posting my questions in response to Wyckoff's analysis, in hopes that others here can help me to understand things. The questions will probably be VERY basic, so I will apologize in advance. Bold will be mine, to emphasize his words that I'm trying to grasp
So, to begin,
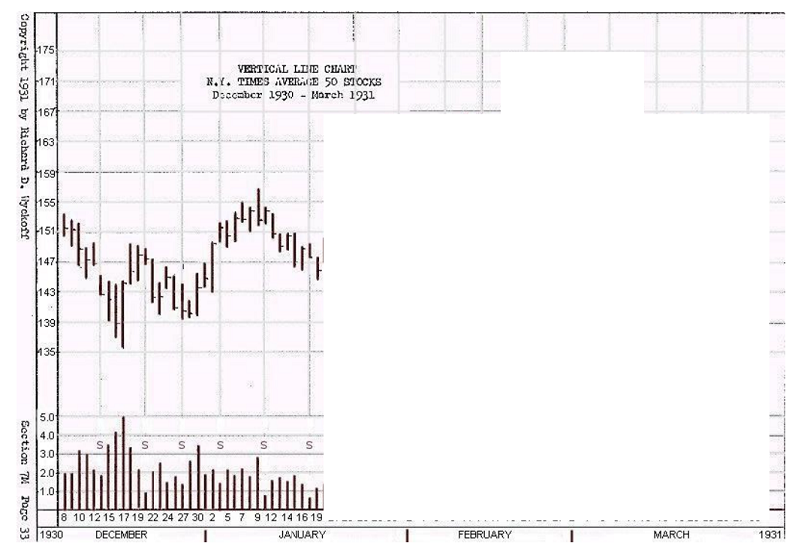
The story told by this chart is as follows: We use the period from
December 8th to December l7th as our starting point, and without regard to the market history previously recorded. This interval of nine days marked a sharp acceleration of the previous major decline, culminating in a widening spread of the daily price range and a very marked expansion in the daily volume of trading as the market reached its low point -- thus reflecting the panicky selling which takes place under such conditions (see Footnote following).

The volume on the 8th was around 2,000,000. This increases to 5,000,000 on the day of the low point. Tape observers would have noted the fact that a large part of this volume occurred as the market recorded the extreme low and on the rally from the lows. This confirms the fact that the climax of the downward movement (*) has actually been passed, and gives us the starting point for our next forecast.
*The phenomenon of the Selling Climax is caused by the panicky unloading of stocks (supply) by the public and other weak holders which is matched against buying (demand) of (1) experienced operators; (2) the large interests and sponsors of various stocks who now either see an excellent opportunity to replace at low prices the stocks they sold higher up, or wish to prevent further demoralization by giving the market support temporarily; and (3) short covering by the bears who sense a turn.
Stocks thus become either temporarily or more lastingly lodged in strong hands. An abnormal increase in volume is one of the characteristic symptoms of a selling climax, since supply and demand must both expand sharply under these conditions, but the supply is now of poor, and the demand of good, quality; and since the force of supply now will have been exhausted, a technical rally ensues.
How does he conclude that the supply is now exhausted? How can he be sure that on the next bar, selling re-commences? And how does he say that the demand is good quality, while the supply is poor?
We have a big drop, and a huge volume spike. On this last bar, sellers succeeded in pushing the price past the previous days lows, but then buyers overwhelmingly came in to close at the high. It seems like Wyckoff is saying that all the panicky sellers are worn out, and the people buying are stronger. But why can't it be viewed that this huge volume spike was the last of the support buyers being taken out, and that the move will continue downward?
-
Well for me, its good to see that at least a few people are still participating and viewing here.
I'm a complete beginner and I'm going through section 7M and have TONS of questions. I plan on starting a new thread for it, and I hope that people are willing to help me.
-
Thanks for the reply
I'm actually a professional poker player looking to make a transition into trading, so your analogy rings true.
The thing is, with poker, there are mathematics that I can rely on, as long as I can accurately gauge how my opponents are playing. As you say, I may have pocket aces, but depending on the the other cards on the board, and how I think the other people play, the hand may or may not be so good.
But, if I can get all in before the flop with pocket aces against someone else all in before the flop, then I can be assured that I am at least a 4:1 favorite. So even if I'm unlucky and lose that 1/5 times, I can rely on the probabilities that I will win more often than not.
Using your 3:1 risk reward example, I have difficulty finding those numbers with any confidence in trading. Sure you can enter the trade, set your stop loss at -1, set your target at +3, but how can you be confident that your targets are good?
-
Hi
I'm new and have been reading about trading by price for a while. I've follow DB's pdf's from his yahoo groups days. I still don't feel like I have a grasp on things.
A quick question I have is, how can one use the past prices to determine the future? I mean, even with all this price analysis, at any moment a huge surge of people can come in and send the price in the opposite direction that you've predicted. How can you ever account for that? How can you swing the probabilities in your favor with this uncertainty?
For example, you see a double top, or a head and shoulders, it would seem that buyers are exhausted and cannot move the price upward. It seems like a good short opportunity when price breaks a support line or hits a resistance line. You enter short. But how can you be certain that in the next five minutes, a huge surge of buying doesn't come in and overwhlem the sellers? This has been nagging at me..
-
So AMP will provide information for futures? Can you give me a link for AMP?
And also what WorldTrader said, how can I get Forex data?
-
I want to start learning how to trade commodity futures and/or forex currencies. I have a friend who uses Interactive Brokers, so I was planning on using the same brokerage software. For charts, he uses eSignal, which seems very expensive for me to start.
Basically I just want to look over historical charts and start trying out fake paper trades using the past data. Ideally i'd be able to fast forward through these old charts so I can go through them quicker.
I'd like some recommendations on broker/chart combos that are cheap since all I want to do is test right now. Thanks in advance
Trading The Wyckoff Way
in The Wyckoff Forum
Posted
Ok, thanks, I'll spend more time considering the dynamics of each potential buyer/seller and existing long/shorts as price moves.
I also wanted to jot this down to see if I'm getting it
Just wanted to revisit this..
Using the example of a downtrend, as the trend progresses (as the price decreases), supply is greater than demand. So what is meant in the above quote is, the people who bought long higher up are still long and losing, the shorts have succeeded and have taken some profits. Most of the open trades are the people who have held on the way down and are too stubborn to take the loss. Since these buyers are already in, there's no buyers left to support the price, which is partially why it drops. Then, once these buyers finally give in as panic increases, they finally close their trades and take their loss, and since their selling pressure is now gone from the market, the path of least resistance is upward.