
Welcome to the new Traders Laboratory! Please bear with us as we finish the migration over the next few days. If you find any issues, want to leave feedback, get in touch with us, or offer suggestions please post to the Support forum here.


nicknextmove
-
Content Count
49 -
Joined
-
Last visited
Posts posted by nicknextmove
-
-
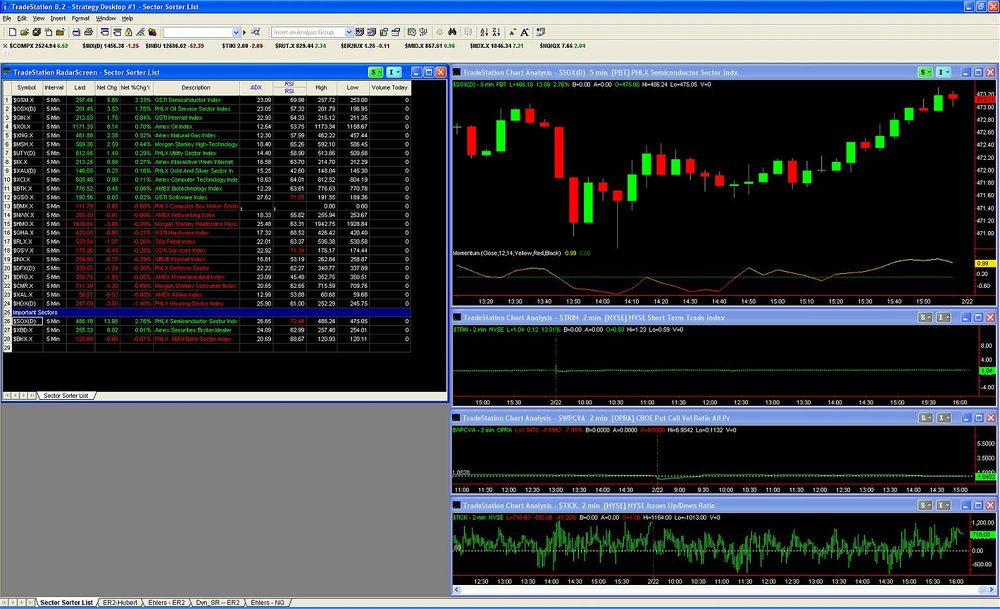
I trade the ER2 exclusively now. Used to trade YM earlier.
Have strategies that run on 5 minutes.
Sector Sorter workspace is to tell me how the market is doing (idea from one of Carter's webinar).
-
Totally agree with you Kiwi.
But I would also like to add that non-brokers should also be not allowed to pimp their wares.
I see that some people have recommended MultiCharts.
I have tried a demo of MultiCharts and would never recommend it.
Did not want to get entangled in a pissing contest - so kept quiet previously.
-
This is the code for the 3 Bricks Reversal:
[LegacyColorValue = true]; {********************************************************* 3_LineBrk_V4 Modified 2/12/04 WAV added input to show/hide paintbars (true/false) added input to show/hide brk line (true/false) added input for BrkLine length alert once per bar only use: how to hide regular price bars ( format symbol, style, BarType to Line on Close or dot, color to chart background or similar ) ********************************************************** "3 Brick Reversal" Modified and Renamed 06/21/06 PatientTrader (Lonnie VanZandt) added TrendLine drawing to draw the tops and bottoms of the "bricks" cleaned up the Alert reporting added a vertical Trendline as the last PaintBar of a box prior to a new box, to close the box cleanly. The end result is visually identical to John Carter and Hubert's "TTM Bricks" indicator. I compared the transitions to those in "Mastering the Trade" and they appear to match. (Note that Figure 11.8 (@YM Daily) in that book does not match the 2006 data for @YM for Fourth Quarter 2006. Odd... } inputs: TrendWeight(2), ShowPB(True), UpColor(Cyan), DnColor(Red); vars: TrendLeading(-1), TrendTrailing(-1), LastPb(-1), LastHigh (0),LastLow(0),DrawColor(0), AlertTime(0); arrays: LineH[2](0), LineL[2](0), color[2](0); if BarNumber = 1 then begin LastHigh = h; LastLow = l; end; {-------------------------------------- handle first 3 lines separately ---------------------------------------} If BarNumber = 4 then begin for value1 = 0 to 2 begin if c[value1+1] > LastHigh then begin LineH[0] = c[value1+1]; LineL[0] = LastHigh; color[0] = UpColor; LastLow = LastHigh; LastHigh = c[value1+1]; end else if c[value1+1] < LastLow then begin LineL[0] = l[value1+1]; LineH[0] = LastLow; color[0] = DnColor; LastHigh = LastLow; LastLow = c[value1+1]; end; end; end else {-------------------------------------- long side ---------------------------------------} begin { see if close > high of last 3 lines } if c > MaxList(LineH[0],LineH[1],LineH[2]) then begin { see if last line was down color...if so then break } if color[2] = DnColor then begin if TL_Exist( TrendLeading ) then TL_SetEnd( TrendLeading, Date, Time, LineL[2] ); TrendLeading = TL_New( Date, Time, Close, Date, Time, Close ); TL_SetSize( TrendLeading, TrendWeight ); TL_SetColor( TrendLeading, UpColor ); if TL_Exist( TrendTrailing ) then TL_SetEnd( TrendTrailing, Date, Time, LineH[2] ); TrendTrailing = TL_New( Date, Time, LineH[2], Date, Time, LineH[2] ); TL_SetSize( TrendTrailing, TrendWeight ); TL_SetColor( TrendTrailing, UpColor ); if AlertTime <> time then begin AlertTime = time; alert("Brick Reversal Long Setup on " + GetSymbolName + "."); end; end else begin if TL_Exist( TrendLeading ) then TL_SetEnd( TrendLeading, Date, Time, LineH[2] ); TrendLeading = TL_New( Date, Time, Close, Date, Time, Close ); TL_SetSize( TrendLeading, TrendWeight ); TL_SetColor( TrendLeading, UpColor ); if TL_Exist( TrendTrailing ) then TL_SetEnd( TrendTrailing, Date, Time, LineL[2] ); TrendTrailing = TL_New( Date, Time, LineH[2], Date, Time, LineH[2] ); TL_SetSize( TrendTrailing, TrendWeight ); TL_SetColor( TrendTrailing, UpColor ); end; for value1 = 0 to 1 begin LineH[value1] = LineH[value1+1]; LineL[value1] = LineL[value1+1]; color[value1] = color[value1+1]; end;{for value1} LineH[2] = c; LineL[2] = LastHigh; LastLow = LastHigh; LastHigh = c; color[2] = UpColor; DrawColor = UpColor; LastPb = TL_New( Date, Time, LineH[1], Date, Time, LineL[1] ); TL_SetSize( LastPb, 1 ); TL_SetColor( LastPb, color[1] ); end else begin {-------------------------------------- short side ---------------------------------------} { see if close < low of last 3 lines } if c < MinList(LineL[0],LineL[1],LineL[2]) then begin { see if last line was up color...if so then break } if color[2] = UpColor then begin if TL_Exist( TrendLeading ) then TL_SetEnd( TrendLeading, Date, Time, LineH[2] ); TrendLeading = TL_New( Date, Time, Close, Date, Time, Close ); TL_SetSize( TrendLeading, TrendWeight ); TL_SetColor( TrendLeading, DnColor ); if TL_Exist( TrendTrailing ) then TL_SetEnd( TrendTrailing, Date, Time, LineL[2] ); TrendTrailing = TL_New( Date, Time, LineL[2], Date, Time, LineL[2] ); TL_SetSize( TrendTrailing, TrendWeight ); TL_SetColor( TrendTrailing, DnColor ); if AlertTime <> time then begin AlertTime = time; alert( "Brick Reversal Short Setup on " + GetSymbolName + "."); end; end else begin if TL_Exist( TrendLeading ) then TL_SetEnd( TrendLeading, Date, Time, LineL[2] ); TrendLeading = TL_New( Date, Time, Close, Date, Time, Close ); TL_SetSize( TrendLeading, TrendWeight ); TL_SetColor( TrendLeading, DnColor ); if TL_Exist( TrendTrailing ) then TL_SetEnd( TrendTrailing, Date, Time, LineH[2] ); TrendTrailing = TL_New( Date, Time, LineL[2], Date, Time, LineL[2] ); TL_SetSize( TrendTrailing, TrendWeight ); TL_SetColor( TrendTrailing, DnColor ); end; for value1 = 0 to 1 begin LineH[value1] = LineH[value1+1]; LineL[value1] = LineL[value1+1]; color[value1] = color[value1+1]; end;{for value1} LineL[2] = c; LineH[2] = LastLow; LastHigh = LastLow; LastLow = c; color[2] = DnColor; DrawColor = DnColor; LastPb = TL_New( Date, Time, LineH[1], Date, Time, LineL[1] ); TL_SetSize( LastPb, 1 ); TL_SetColor( LastPb, color[1] ); end else begin if ( DrawColor = UpColor ) then begin if TL_Exist( TrendLeading ) then TL_SetEnd( TrendLeading, Date, Time, LineH[2] ); if TL_Exist( TrendTrailing ) then TL_SetEnd( TrendTrailing, Date, Time, LineL[2] ); end else begin if TL_Exist( TrendLeading ) then TL_SetEnd( TrendLeading, Date, Time, LineL[2] ); if TL_Exist( TrendTrailing ) then TL_SetEnd( TrendTrailing, Date, Time, LineH[2] ); end; end; end; end; if ShowPB then begin Plot1(LineH[2], "LineHigh",DrawColor); Plot2(LineL[2], "LineLow" ,DrawColor); end; -
This is the code for the Squeeze aka BB Squeeze:
[LegacyColorValue = true]; {@@14439@@} {04/05/2006} //Updated by TradingDude, fixed "division by zero error" {02/16/2005} {Updated by Redlock} { Well, I have been working in this indicator. I have made a couple of changes: (1) that if the momentum changes direction, it changes color. (2) I have taken out the plotting of the alertline (3) have the dots plotted along the axis (4) Have changed the name of the indicator to BBSqueeze (cuts down on confusion). I think that you will find that it resembles what is on the TTM indicator.} {------------------------------------------------------------------} {mmillar, 05/12/2005 For anyone interested I made a small change to the indicator(s) above. I found that the indicator displayed fine for ES, YM etc but screwed up for FX - this is due to the number of decimal places used by the symbol. I just added a multiplier so the indicator is normalised across all symbols. Add the following lines... Vars: LHMult(0); if ( barnumber=1 ) then Begin LHMult=pricescale/minmove; end; And modify the following line so that it includes the LHMult variable... Plot3(value2*LHMult, "NickmNxtMove", color); } { Bolinger Band Squeeze (BBS) Indicator } { A variation of an idea by nickm001 (Originally coded by eKam) that when Bollinger Bands (BB) fit inside the Keltner Channel (KC), a breakout is about to occur. It works on longer term charts, such as 15 minute to daily charts. This code creates an indicator that plots the ratio of BB width to KC width. When BB and KC widths are the same, the ratio (BBS_Ind)is equal to one (1). When the BB width is less than the KC Width (i.e. BB fit inside KC), the BBS_Ind is less than one and a breakout is indicated. An Alert Line is provided to indicate the level at which the trader considers that the "sqeeze is on" and a breakout is eminant. Coded by Kahuna 9/10/2003 Added by eKam: 9/10/2003 The average of where price has been relative to the Donchian mid line and Exponential average of the same length is also plotted as an attempt to predict the direction of the breakout. Added 2/1/2005 For decreasing Delta bar....darker colors to highlight the change.} Inputs: {------------------------------------------------} Price(Close), Length(20), { Length for Average True Range (ATR) & Std. Deviation (SD) Calcs } nK(1.5), { Keltner Channel ATRs from Average } nBB(2), { Bollinger Band Std. Devs. from Average } AlertLine( 1 ), { BBS_Index level at which to issue alerts } NormalColor( Red ), { Normal color for BBS_Ind } AlertlColor( Blue ); { Color for BBS_Ind below alert line } Variables: {---------------------------------------------} ATR(0), { Average True Range } SDev(0), { Standard Deviation } BBS_Ind(0), { Bollinger Band Squeeze Indicator } alertTextID(-1), Denom(0), LHMult(0); if ( barnumber=1 ) then Begin If minmove <> 0 then LHMult = pricescale/minmove; end; if barnumber = 1 and alertTextID = -1 then alertTextID = Text_New(date,time,0,"dummy"); {-- Calculate BB Squeeze Indicator ----------------------} ATR = AvgTrueRange(Length); SDev = StandardDev(Price, Length, 1); Denom = (nK*ATR); If Denom <> 0 then BBS_Ind = (nBB * SDev) /Denom; If BBS_Ind < Alertline then SetPlotColor(1, NormalColor) else SetPlotColor(1, AlertlColor); {-- Plot the Index & Alert Line -------------------------} Plot1(0, "BBS_Ind"); {-- Plot delta of price from Donchian mid line ----------} value2 = LinearRegValue(price-((Highest(H, Length)+Lowest(L, Length))/2 + xAverage(c,Length))/2,Length,0); var:color(0); color = yellow; if value2 > 0 then if value2 > value2[1] then color = green else color = darkgreen; if value2 < 0 then if value2 < value2[1] then color = red else color = darkred; Plot3(value2*LHMult, "NickmNxtMove", color); {plot3(value2,"BB Squeeze",color);} {-- Issue Alert when the Squeeze is On ------------------} if BBS_Ind crosses below AlertLine and Text_GetTime(alertTextID) <> time then begin text_setLocation(alertTextID, date, time, 0); Alert("Check for Squeeze Setups on " + SymbolName); end; {-- Issue Alert when the Squeeze Releases ---------------} if BBS_Ind crosses above AlertLine and Text_GetTime(alertTextID) <> time then begin text_setLocation(alertTextID, date, time, 0); Alert("Squeeze is Over on " + SymbolName); end; if BBS_Ind crosses below AlertLine then SetPlotColor(1, Green); -
This is the code for the TTM Trend:
{ ModHA PaintBarStudy 1/20/04 modified Heikin-Ashi technique compares current bar open to close range with prior bars...if current is within prior then color remains the same Taken from https://www.tradestation.com/Discussions/Topic.aspx?Topic_ID=22399 Modified by mm to make it more like TTM Trend - appears to match www.tradethemarkets.com } inputs: CompBars(6), UpColor(Blue), DnColor(Red), BarWidth(1); vars: haClose(0), haOpen(0), color(0); if BarNumber = 1 then begin haOpen = open; haClose = (O+H+L+C)/4; end; if BarNumber > 1 then begin haClose = (O+H+L+C)/4; haOpen = (haOpen [1] + haClose [1])/2 ; { ................................................................................ } if haClose > haOpen then color = UpColor else color = DnColor; for value1 = 1 to CompBars begin if haOpen <= MaxList(haOpen[value1],haClose[value1]) and haOpen >= MinList(haOpen[value1],haClose[value1]) and haClose <= MaxList(haOpen[value1],haClose[value1]) and haClose >= MinList(haOpen[value1],haClose[value1]) then color = color[value1]; end; { ................................................................................ } // plotPB(haOpen,haClose,"heikin-ashi",color); plotPB(High,Low,"heikin-ashi",color); SetPlotWidth(1,BarWidth); SetPlotColor(1,color); end; { ................................................................................ } -
Unfortunately, I don't see it in TradeStation.
-
Thank you Walter. Will try that indicator out.
-
wsam29,
If you are sure that it is not an indicator that you paid for, do this:
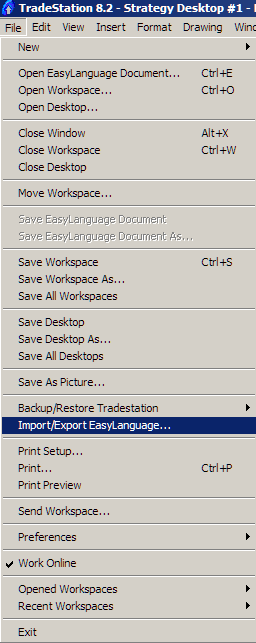
1. Open TradeStation
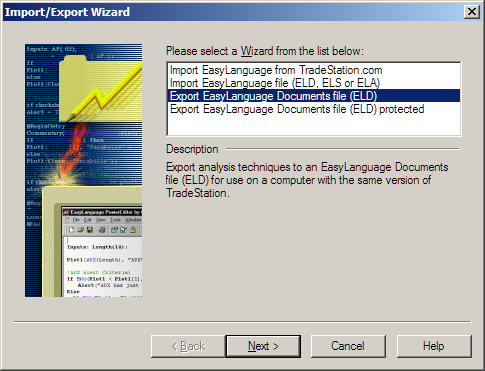
2. Select the File | Import/Export EasyLanguage ... menu
3. Select Export EasyLanguage Documents file (ELD). Click Next.
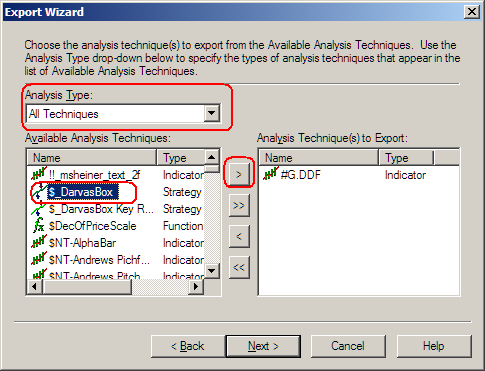
4. In the Export Wizard Select All Techniques
5. Then select the TTM Tick Volume Indicator. Click on the > button.
6. Click Next.
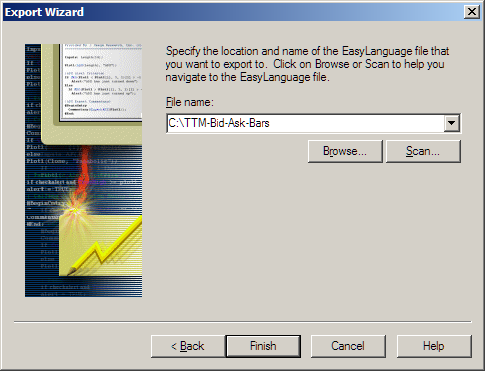
7. Type in C:\TTM-Bid-Ask-Bars as the File Name
8. Click Finish
You will now have the TTM-Bid-Ask-Bars.eld file in C:\
Upload it.
-
NP Soultrader.
Actually Hubert's video did help me.
Lost $700.00 before the meeting (using my automated strategy). Made $830.00 after (trading myself).
So - more power to Hubert [ and his lovely accent
 ]
] -
-
Question for guys whose have leased a seat.
Do you have a LLC or a Corp?
I have a full time job and trade part-time - so not sure which would be good for me.
From reading some threads on EliteTrader looks like LLC is not tax efficient.
-
I do. Don't use it much - but when I do the capability pays for itself.
See this demo for example where Carter can figure out how many bars back a TTM/BB Squeeze was fired, etc (I have the freeware version of that Indicator courtesy of TRO).
-
Thanks - please keep 'em coming.
-
Thanks insideday. Learnt a lot from your code.
Attached is the ELD for people who don't want to go the copy/paste/verify mode.
-
Didn't know there was a Russell 2000 Tick.
What is the symbol you use in your platform?
-
Thank you for the link brownsfan019, will check it out via the trial.
BTW, I believe the TTM guys are also with Mirus.
-
Ah ... forget it - found the print option.
-
Soultrader,
Any reason why there is no print topic/thread option in this forum?
Would be nice to be able to print an entire thread like in the TS forums.
Thanks.
-
Kiwi,
What is a HSI contract - what is the underlying?
Thanks much.
-
-
That is all for now folks!
-
How To Use Put/Call Ratio
Download 'How To Use Put/Call Ratio' from MEGAUPLOAD
Download and unpack the zip file. Then double click on the fnv05012006hs.htmlfile.
-
How To Use $TICK
Download 'How To Use $TICK' from MEGAUPLOAD
Download and unpack the zip file. Then double click on the fnv05032006hs.html file.
-
How To Use $TRIN
Download 'How To Use $TRIN' from MEGAUPLOAD
Download and unpack the zip file. Then double click on the fnv05022006hs.html file.
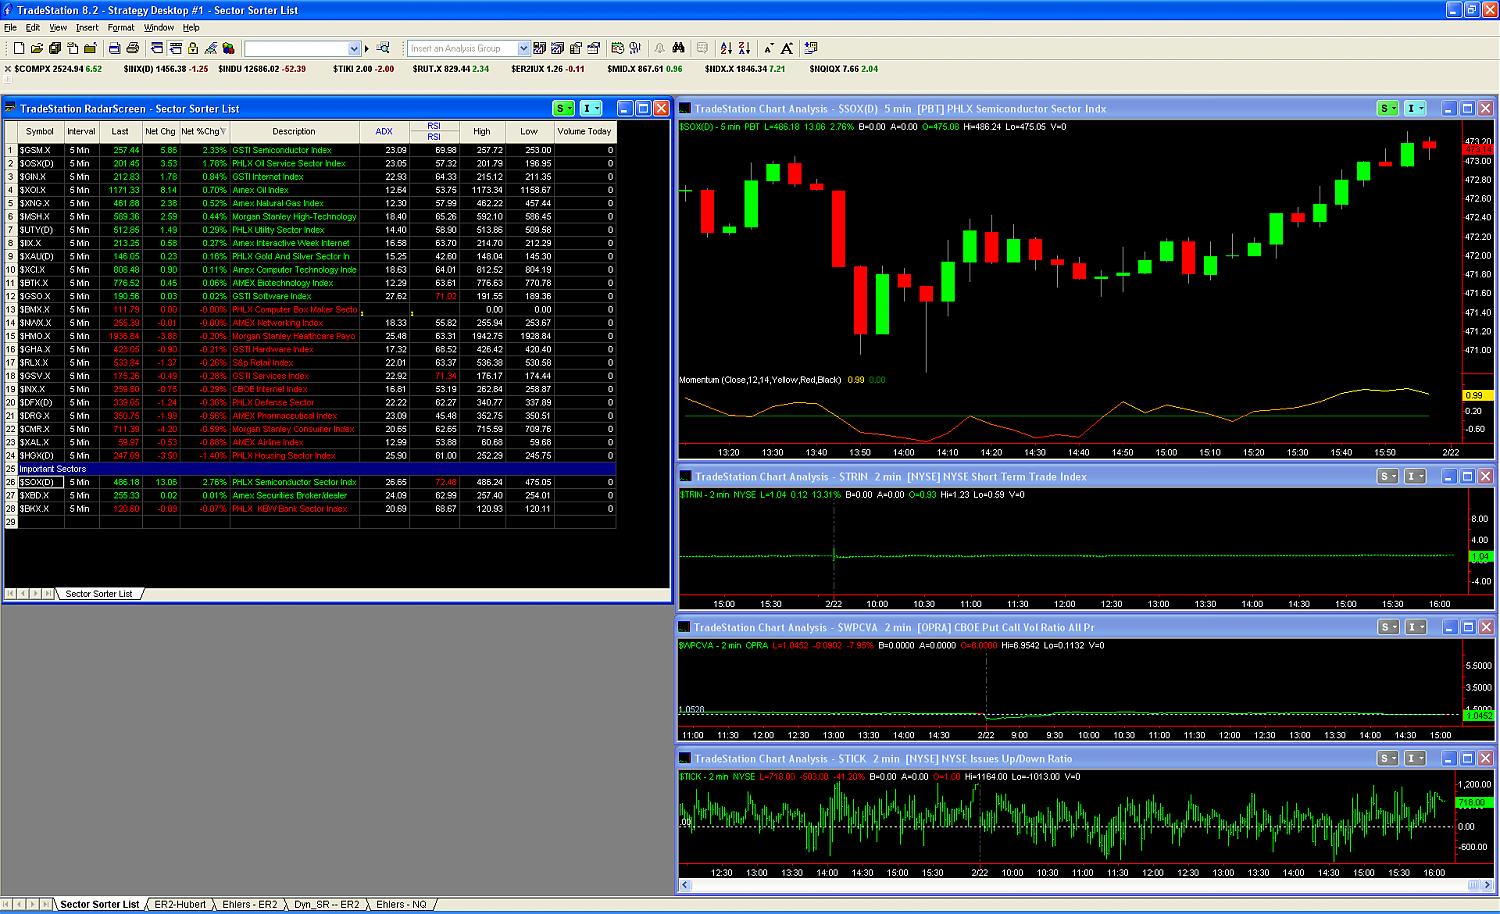

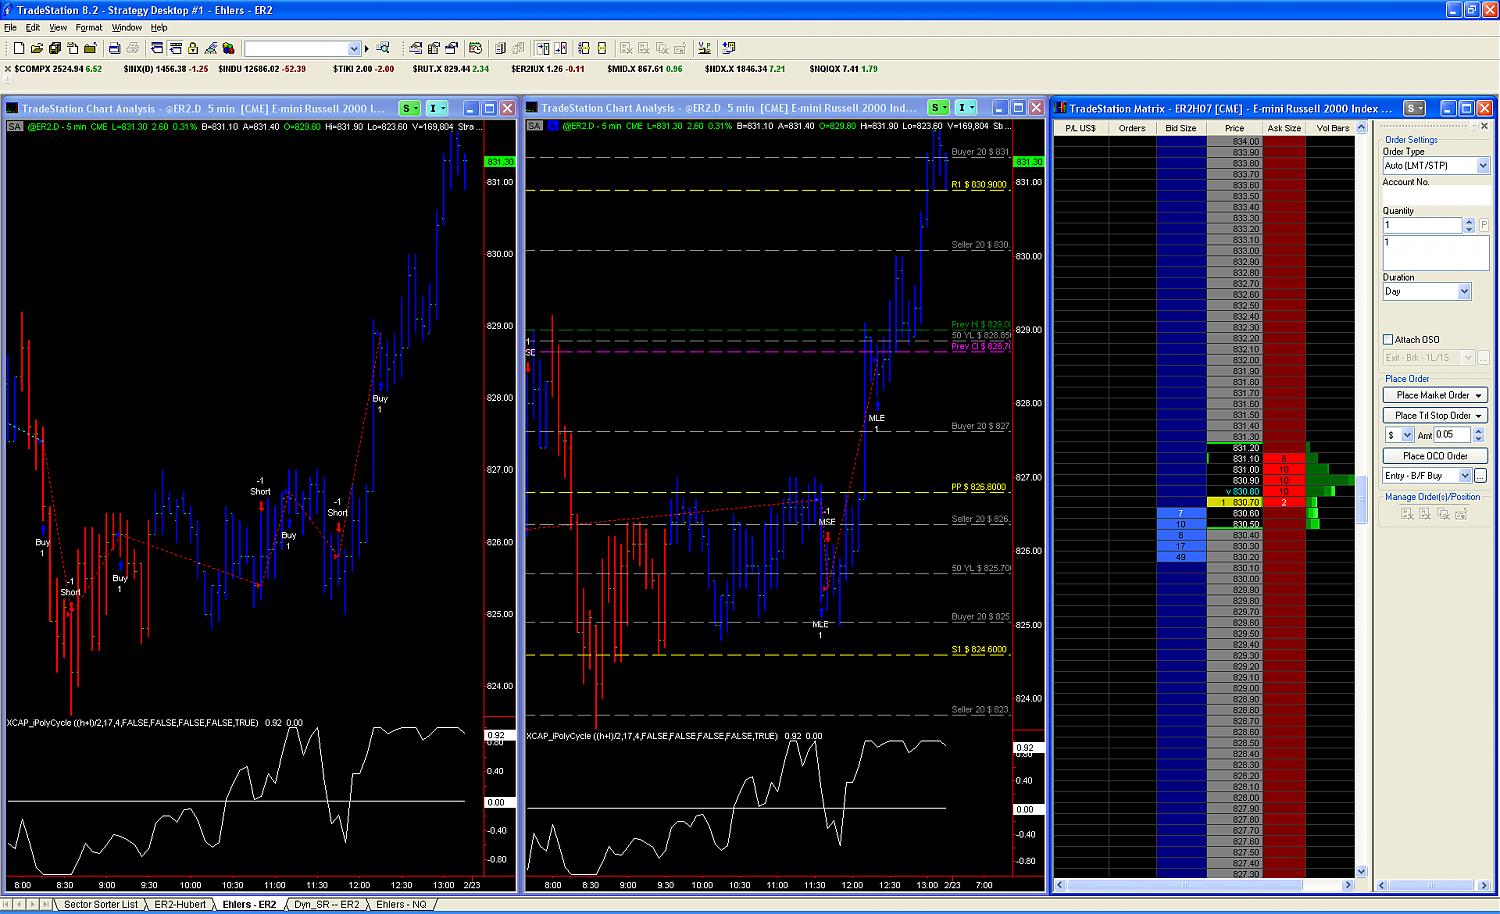
Chart Set-up
in Market News & Analysis
Posted
walter,
Here it is. You can also get it from the TS forums.
I find the xcap to be better than Ehler's inv. fisher transform (though both come close).
20070116233527XCAP_POLYCYCLE.ELD