
Welcome to the new Traders Laboratory! Please bear with us as we finish the migration over the next few days. If you find any issues, want to leave feedback, get in touch with us, or offer suggestions please post to the Support forum here.


CuriousGeorge
-
Content Count
8 -
Joined
-
Last visited
Posts posted by CuriousGeorge
-
-
Two very good ideas. I'll have a look at them both.
I appreciate the help
-
I found the link shown below on another forum and figured it was worth passing on. Sign your name and have letters sent to your congressmen. If anyone has similar links please share.
http://www.rallycongress.com/no2tradertax/1536/tell-congres-to-block-trader-tax/
-
I'm curious if any of you know of a program that will allow me to quickly post multiple journal entries daily . It should organize posts by date and post the time of each entry. Something where I can quickly make posts with the click of a button and not have to enter a new subject each time. This is for my trading and I just need something to quickly get my thoughts recorded without having to put too much effort into it. If any of you know of a good, preferably free, program which will allow me to this please let me know.
Thanks
-
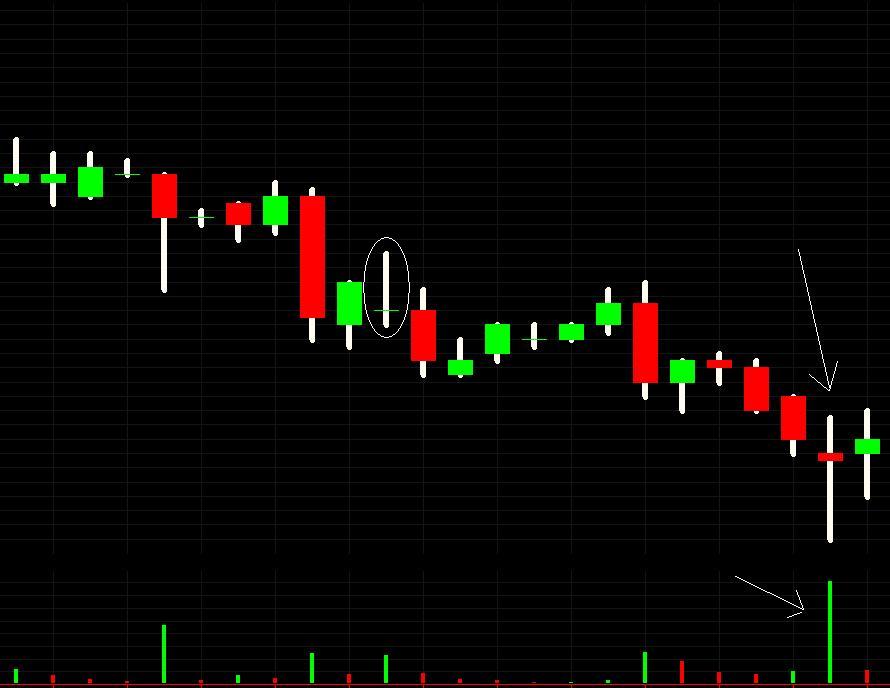
I put on my short at the close of the circled candle. There were no S/R levels for many months back.
-
I thank you both for your helpful replies. Let me ask one mor thing, if you were already short at the time you saw this action, would you exit immediately or wait for some other confirmation?
-
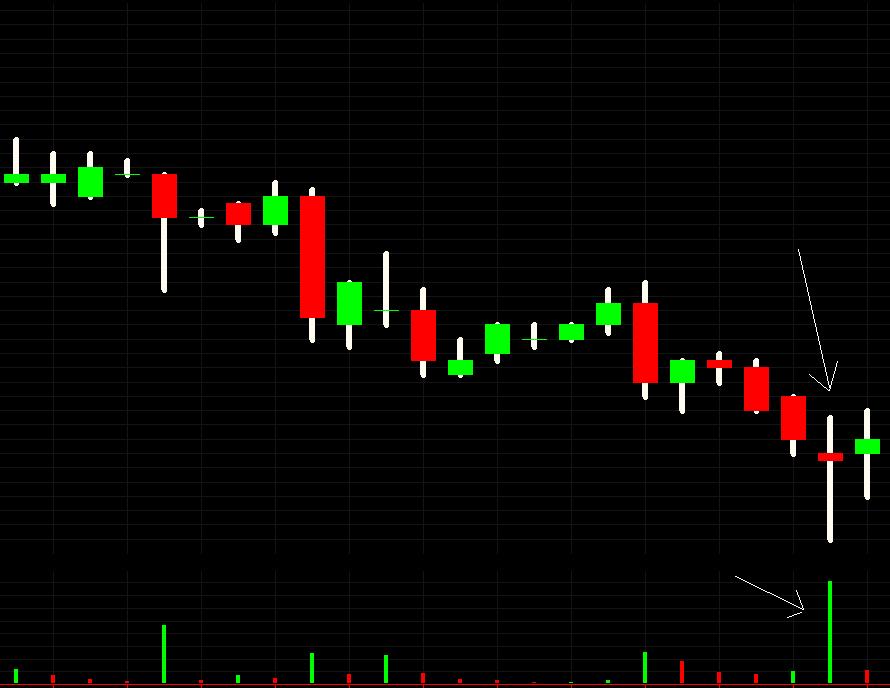
I'm very interested in the things you guys are talking about here. I've attached a chart below to get some feedback by some of you veteran VSA traders. How do you interpret this action?
Thanks for any feedback
-
When I submit a stop market order, is it sent to the market or is it held by my broker waiting to be sent? The reason i ask is because I'm curious who sees the order. Is it just my broker or do other market participants able to see it as well?
I hear of stop hunting, but is this done by participants who assume orders are at a certain level or is it done by people who can SEE orders at a certain level?
Help W/ Avg Vol By TimeFrame ELD
in Coding Forum
Posted
I found the following code on TradeStation forums. It's supposed to show the average volume and median volume by timeframe for a specified number of days back. However, the results don't line up with my calculations so I figured I would see if some experiences coders in here could have a look and see what's wrong. Here's the code:
INPUTS: Days.Back( 5) ;
VARIABLES: Days.Count( 0 ),
Session.Minutes( 0 ),
Total.Volume( 0 ),
Volume.Average( 0 ),
Volume.Median( 0 ),
Counter( 0 ),
Bars.per.Day( 0 ) ;
IF BarType = 1 THEN BEGIN { plot intraday time charts only }
Session.Minutes = TimeToMinutes(1515) - TimeToMinutes(0830) ;
Bars.per.Day = Round( ( Session.Minutes/BarInterval )+ 0.49, 0 ) ; { round-up }
//print(Counter);
//print(barnumber);
//Print("*******");
Total.Volume = 0 ;
Days.Count = 0 ;
FOR Counter = Round( BarInterval * 0.5, 0 ) TO Days.Back * Bars.per.Day BEGIN
IF Time = Time[Counter] AND
Days.Count < Days.Back THEN BEGIN
Total.Volume = Total.Volume + UpTicks[Counter] + DownTicks[Counter] ;
Days.Count = Days.Count + 1 ;
END ;
END ;
if Days.Count <> 0 then
Volume.Average = Total.Volume/Days.Count ;
Volume.Median = median(Upticks + Downticks,Days.Count);
Plot1( Volume.Median, "Median Vol" ) ;
Plot2( Volume.Average, "AvgVol(ToD)" ) ;
Plot3( UpTicks + DownTicks, "Volume" ) ;
if upticks > downticks then
setplotcolor(3,green);
If plot3 > Plot1 and plot3 > Plot2 then Alert("High Volume");
END ;