
Welcome to the new Traders Laboratory! Please bear with us as we finish the migration over the next few days. If you find any issues, want to leave feedback, get in touch with us, or offer suggestions please post to the Support forum here.


ed16888
-
Content Count
9 -
Joined
-
Last visited
Posts posted by ed16888
-
-
Blu Ray , thanks for the quick reply, I really appreciate your hard work, I ran my code intrabar, I added the code you discribe, the alert on the cross is fine, but the near does not seems to be working, 5 ticks above and below should be fine, here is what I did, can you see where the errors at, thanks again...
{
Applies to daily, intra-day, and tick bar charts only.
Plots lines at floor trader pivot levels, based on the following formulae:
Resistance Level 3 = R3 = R2 + YestHigh - YestLow
Resistance Level 2 = R2 = PP + YestHigh - YestLow
Resistance Level 1 = R1 = PP * 2 - YestLow
PivotPoint = PP = ( YestHigh + YestLow + YestClose ) / 3
Support Level 1 = S1 = PP * 2 - YestHigh
Support Level 2 = S2 = PP - YestHigh + YestLow
Support Level 3 = S3 = S2 - YestHigh + YestLow
Input specifies whether R3 and S3 are plotted in addition to the 5 lines at PP, S1,
S2, R1, and R2.
}
inputs:
Plot_5or7( 5 ) ; { if 7, adds plots for S3 and R3 to other 5 lines }
Inputs:
Threshold (6);
variables:
S1( 0 ),
S2( 0 ),
S3( 0 ),
R1( 0 ),
R2( 0 ),
R3( 0 ),
PP( 0 ),
TodaysHigh( 0 ),
YestHigh( 0 ),
TodaysLow( 0 ),
YestLow( 0 ),
TodaysClose( 0 ),
YestClose( 0 ),
Counter( 0 ) ;
Vars:
mintick(0),PPuppthresh(0) ,PPlwrthresh(0) ,R1uppthresh(0) ,R1lwrthresh(0) ,R2uppthresh(0) ,R2lwrthresh(0) ,S1uppthresh(0) ,S1lwrthresh(0) ,S2uppthresh(0) ,S2lwrthresh(0);
if Date <> Date[1] then
begin
{ increment Counter to be sure enough data is processed - see comment below }
Counter = Counter + 1 ;
YestHigh = TodaysHigh ;
YestLow = TodaysLow ;
YestClose = Close[1] ;
TodaysHigh = High ;
TodaysLow = Low ;
PP = ( YestHigh + YestLow + YestClose ) / 3 ;
R1 = PP * 2 - YestLow ;
R2 = PP + YestHigh - YestLow ;
R3 = R2 + YestHigh - YestLow ;
S1 = PP * 2 - YestHigh ;
S2 = PP - YestHigh + YestLow ;
S3 = S2 - YestHigh + YestLow ;
end
else
begin
if High > TodaysHigh then
TodaysHigh = High ;
if Low < TodaysLow then
TodaysLow = Low ;
end ;
if Counter >= 2 and BarType < 3 then { if at least one full day's data has been
processed and chart bar interval is daily, intra-day, or tick bar then plot }
begin
if Plot_5or7 = 7 then
Plot1( R3, "R3" ) ;
Plot2( R2, "R2" ) ;
Plot3( R1, "R1" ) ;
Plot4( PP, "PP" ) ;
Plot5( S1, "S1" ) ;
Plot6( S2, "S2" ) ;
if Plot_5or7 = 7 then
Plot7( S3, "S3" ) ;
Mintick = minmove/pricescale;
PPuppthresh = PP + (Threshold*mintick);
PPlwrthresh = PP - (Threshold*mintick);
R1uppthresh = R1 + (Threshold*mintick);
R1lwrthresh = R1 - (Threshold*mintick);
R2uppthresh = R2 + (Threshold*mintick);
R2lwrthresh = R2 - (Threshold*mintick);
S1uppthresh = S1 + (Threshold*mintick);
S1lwrthresh = S1 - (Threshold*mintick);
S2uppthresh = S2 + (Threshold*mintick);
S2lwrthresh = S2 - (Threshold*mintick);
If Close crosses above PP then Alert( Getsymbolname +" crossed above PP");
If Close crosses below PP then Alert( Getsymbolname +" crossed below PP");
If Close crosses above R1 then Alert( Getsymbolname +" crossed above R1");
If Close crosses below R1 then Alert( Getsymbolname +" crossed below R1");
If Close crosses above R2 then Alert( Getsymbolname +" crossed above R2");
If Close crosses below R2 then Alert( Getsymbolname +" crossed below R2");
If Close crosses above S1 then Alert( Getsymbolname +" crossed above S1");
If Close crosses below S1 then Alert( Getsymbolname +" crossed below S1");
If Close crosses above S2 then Alert( Getsymbolname +" crossed above S2");
If Close crosses below S2 then Alert( Getsymbolname +" crossed below S2");
If Close crosses above PPlwrthresh then Alert( Getsymbolname +" just under PP");
If Close crosses below PPuppthresh then Alert( Getsymbolname +" just above PP");
If Close crosses above R1lwrthresh then Alert( Getsymbolname +" just under R1");
If Close crosses below R1uppthresh then Alert( Getsymbolname +" just above R1");
If Close crosses above R2lwrthresh then Alert( Getsymbolname +" just under R2");
If Close crosses below R2uppthresh then Alert( Getsymbolname +" just above R2");
If Close crosses above S1lwrthresh then Alert( Getsymbolname +" just under S1");
If Close crosses below S1uppthresh then Alert( Getsymbolname +" just above S1");
If Close crosses above S2lwrthresh then Alert( Getsymbolname +" just under S2");
If Close crosses below S2uppthresh then Alert( Getsymbolname +" just above S2");
End ;
-
Thanks Paul, I really appeciated.
-
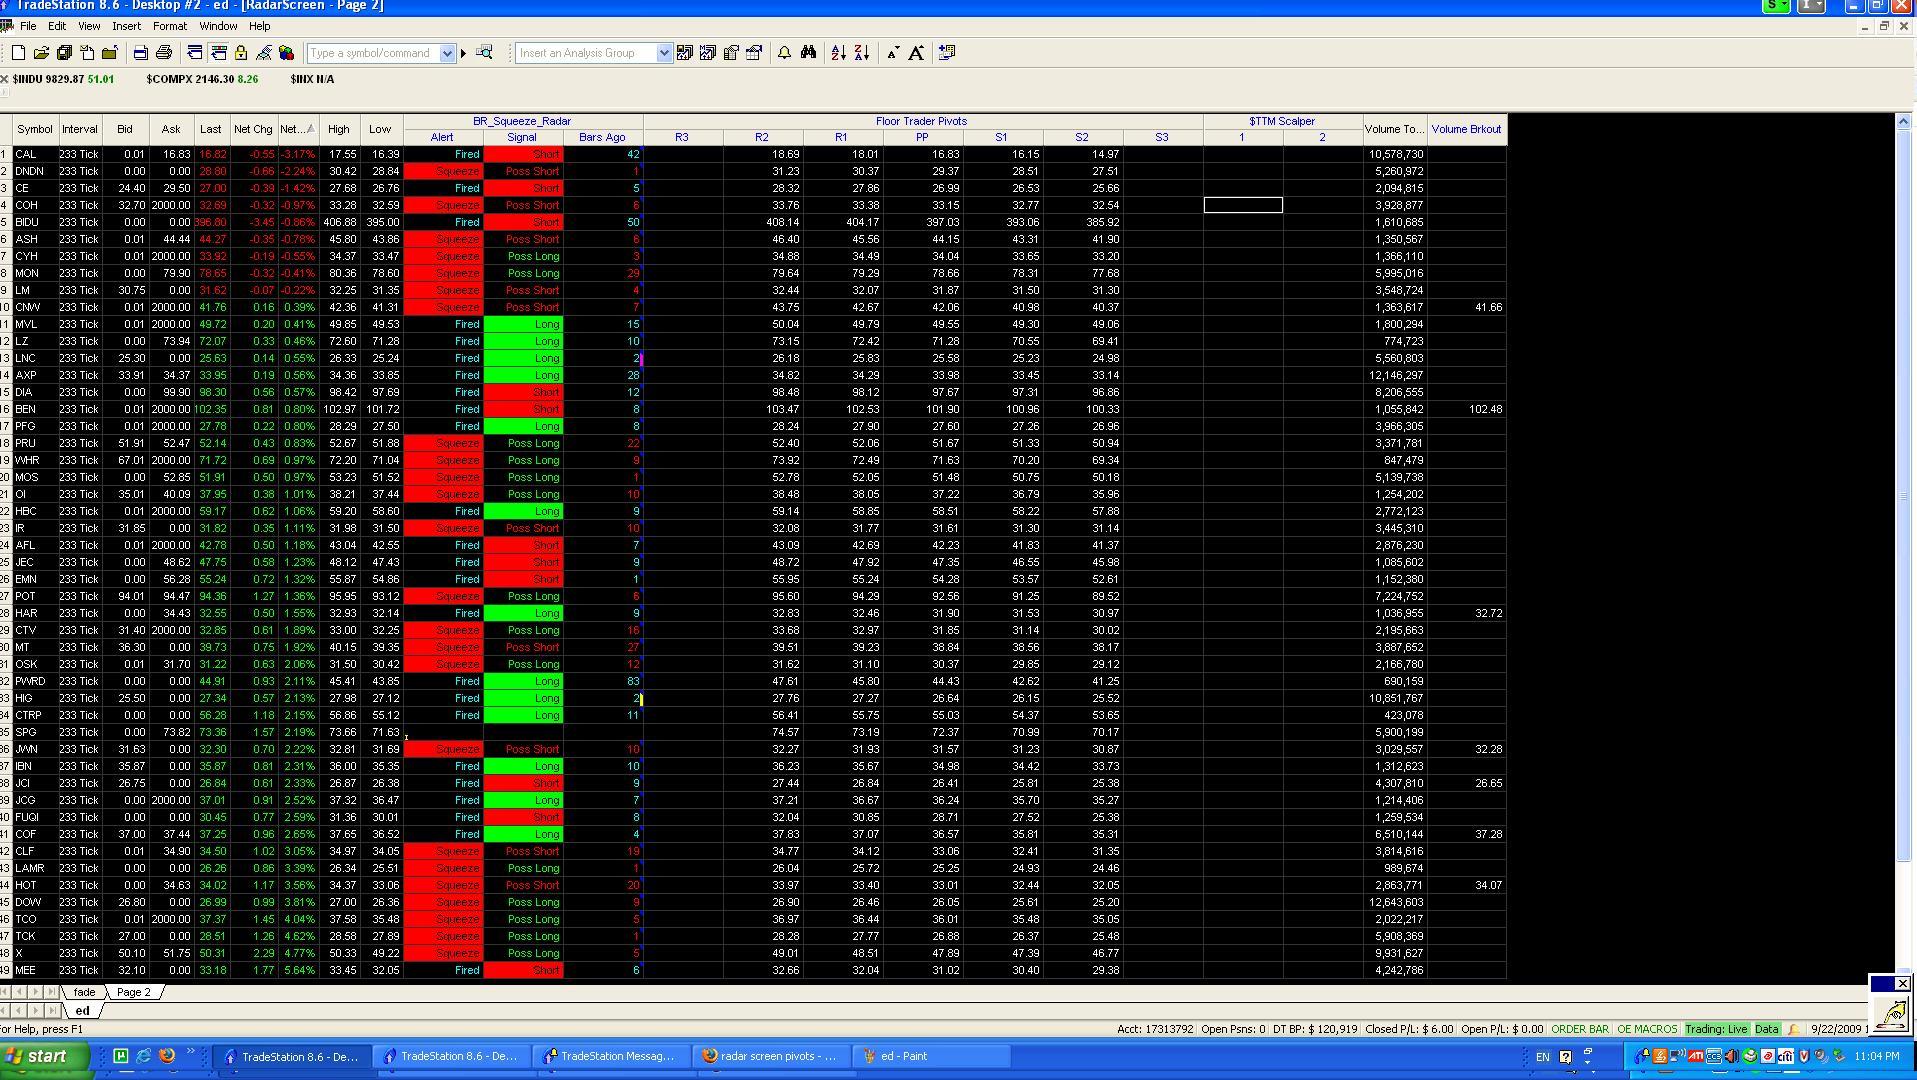
here is a screenshot of my radar screen, is there a way to add alerts to my pivots when the price cross or near. I also attached the floor trader eld that I use, can anyone help?below is the pivots indicator that I use, any programmer out there can assists?
{
Applies to daily, intra-day, and tick bar charts only.
Plots lines at floor trader pivot levels, based on the following formulae:
Resistance Level 3 = R3 = R2 + YestHigh - YestLow
Resistance Level 2 = R2 = PP + YestHigh - YestLow
Resistance Level 1 = R1 = PP * 2 - YestLow
PivotPoint = PP = ( YestHigh + YestLow + YestClose ) / 3
Support Level 1 = S1 = PP * 2 - YestHigh
Support Level 2 = S2 = PP - YestHigh + YestLow
Support Level 3 = S3 = S2 - YestHigh + YestLow
Input specifies whether R3 and S3 are plotted in addition to the 5 lines at PP, S1,
S2, R1, and R2.
}
inputs:
Plot_5or7( 5 ) ; { if 7, adds plots for S3 and R3 to other 5 lines }
variables:
S1( 0 ),
S2( 0 ),
S3( 0 ),
R1( 0 ),
R2( 0 ),
R3( 0 ),
PP( 0 ),
TodaysHigh( 0 ),
YestHigh( 0 ),
TodaysLow( 0 ),
YestLow( 0 ),
TodaysClose( 0 ),
YestClose( 0 ),
Counter( 0 ) ;
if Date <> Date[1] then
begin
{ increment Counter to be sure enough data is processed - see comment below }
Counter = Counter + 1 ;
YestHigh = TodaysHigh ;
YestLow = TodaysLow ;
YestClose = Close[1] ;
TodaysHigh = High ;
TodaysLow = Low ;
PP = ( YestHigh + YestLow + YestClose ) / 3 ;
R1 = PP * 2 - YestLow ;
R2 = PP + YestHigh - YestLow ;
R3 = R2 + YestHigh - YestLow ;
S1 = PP * 2 - YestHigh ;
S2 = PP - YestHigh + YestLow ;
S3 = S2 - YestHigh + YestLow ;
end
else
begin
if High > TodaysHigh then
TodaysHigh = High ;
if Low < TodaysLow then
TodaysLow = Low ;
end ;
if Counter >= 2 and BarType < 3 then { if at least one full day's data has been
processed and chart bar interval is daily, intra-day, or tick bar then plot }
begin
if Plot_5or7 = 7 then
Plot1( R3, "R3" ) ;
Plot2( R2, "R2" ) ;
Plot3( R1, "R1" ) ;
Plot4( PP, "PP" ) ;
Plot5( S1, "S1" ) ;
Plot6( S2, "S2" ) ;
if Plot_5or7 = 7 then
Plot7( S3, "S3" ) ;
end ;

-
Hey Paul, I do use floor pivots on the radar screen, however I don't see anywhere I can adjust the backgound colors when the price gets close, what indicator are you using? do you mind sharing it with me, thanks in advance..
Ed.
-
I daytrade and I use 144 tick chart on the radar screen, I was just wondering if there is such a alert that I can set up in the radar screen that monitors stocks' pivots and gives you alerts like AAPL broke R1 or like AAPL reversing from R1, things like that.
-
Does anybody out there has a pivots alert indicator that works on the radar screen that alerts you when a stock breaks a pivots level or reversal on a pivots level? thanks in advance.
-
Hey Blu-Ray, I have your BR squeeze and having good results using ing, do you have the same indicator that will works in the radar screen? thanks in advance.
-
I have downloaded the install the pbf squeeze indicator and tested it out and is working pretty good, I was wondering if anyone out there has the code for the same indicator that works on the radar screen. any help will be deeply appeciated, thanks.
Pivots Alerts on Radar Screen
in Technical Analysis
Posted
Yeah, you are right Blu-Ray, I just tried it today, it does work perfectly. thanks again.
Ed.