
Welcome to the new Traders Laboratory! Please bear with us as we finish the migration over the next few days. If you find any issues, want to leave feedback, get in touch with us, or offer suggestions please post to the Support forum here.


TrueBalance
-
Content Count
18 -
Joined
-
Last visited
Posts posted by TrueBalance
-
-
If you use IB, this one is great. But it is not the only option, of course there are a multitude of brokers and third party feeds out there. Not all free though.
Best wishes,
TB
Hi All,Can someone suggest a realtime data feed provider from a broker that also has a Microsoft .NET technology API component, at the moment I am using an OpenEcry but having difficulties with their API and current documentation?
Any help will be much appreciated.
Regards
Simon
-
you can always open a real account with IB,then you get to access the papertrading account.
The papertrading account streams real time data,
the same data as in your real trading account.
I believe you only need $3,500 to open an account,
plus a minimal data fee if your commission do not reach a minimum amount.
Unless you're under 21 or live in India or it's an IRA or advisor/broker account, the minimum deposit is $10K.
Best wishes,
TB
-
Although many people that use IB and the API visit this forum, you might be better off using the Interactive Brokers API Forum for detailed questions like that.
Best wishes,
TB
-
...Good to hear from you again ... you've been too quiet!
Thank you
 . If I were to post I would most likely only add noise. The charts that are posted and discussions that follow is already more than anyone could wish for.
True. What Branscomb did was conceive how to use it for system evaluation (normalization of expectancy, R distribution graphs etc) and then to give it a name - important in itself since that is what makes it possible for me and you to talk about it in a conceptual manner now....I kind of thought R-multiples was the basis of Richard Dennis's and William Eckhardt's money management regimen from the 70's......"A rose by any other name ..."
My comment was not directed to you Thales but to the writings of Van. I just think professional writers should give reference when appropriate, that's all. When they don't, they somehow imply that what they write is common knowledge and does not have an originator, or that they came up with the idea themselves. I don't know Branscomb, and he probably doesn't care - but I do.
Best wishes, TB
-
... focusing on R as oppossed to nominal dollars will help you overcome the desire to be right ...Van Tharp is an educator. He's done a good job at teaching and explaining R-multiples. He did not invent the concept though, and I always thought he should give credit where credit is due.
The concept of R-multiples was conceived and developed by Chuck Branscomb.
Sorry for the slightly off topic information
.Best wishes,
TB
-
I would like your opinions of the following stock as well.Edit: Maybe I misunderstood this... if the question is what would I do now if I was flat, the answer would be "wait".
-
Reading through this book tonight, I can say that had I attempted to learn to trade price action based upon what he teaches in these pages, I'd have cut years of struggles away from my trading. I'd have saved thousands upon thousands of dollars buying software, books, seminars, etc.I had a look at amazon and thought I recognized the book cover. Sure thing, I have it right here in my bookshelf. Have I ever read it? Nope. I probably bought it on recommendation years ago, when I was in a frenzy researching mech systems. How ironic isn't that.
Now for the real reason of this post: Happy holidays
. -
I'm going to buy data from these guys:Will post what I think of it.
Would be good if anyone has any random months of tick data for quality comparison.
If you are looking for FX data you can find it for free at Oanda/FXTrade. The data is bid/ask, going back to Jan 1, 2004 and is what was actually used for trading. You need an FXTrade account with some minimum balance to be able to get it. They offer five pairs (and of course you can create synthetic pairs from the ones supplied).
To get some ideas on what constitutes quality data, check out High Frequency Data Filtering from tickdata.com. It is worth reading even though it was written by a vendor.
-
Another option is to collect the data yourself and/or use a downloader. Years ago I used QCollector for that purpose with mixed results. It did permit you to download a lot of tick data unattended. Beware though, the data from your charting platform provider is not always what you would expect.
I've heard good things about Tickdata. Never used them and I think it is on the expensive side (which is probably relative).If you choose tickdata.com, they offer something (that used to be) called "pick 15" and "pick 30". You get to pick 15 or 30 years of tick data in any combination of symbols/years, which is a less expensive entry point. Still pricey though.
I have used them for several years and never had any problems. Service and support is ok. They used to deliver tick data once a month (if you have a subscription), now you get it every day after market close.
There are cheaper (and more expensive options) out there. It all comes down to how important quality is to you, and what timeframe you are testing on. As always you get what you pay for. And to have any use of high quality data you probably need a platform that can use it in an efficient manner.
Best wishes
TB
-
Don't forget to check how the chart trading functionality is implemented (client side, server side or a mix). With other words, where are the orders that show on your chart? Make sure to check for the combination of broker/charting software that you intend to use.
-
Thales,
In this context for EJ - would you consider a bracket prudent?
Long term trend (4h) is up, and there is less R above the bracket as I see it.
Even longer term trend is down though, but there is more R in that direction so the targets are smaller.
-
2nd target hitWell done Gabe,
Just an observation -- I was looking at the same EJ trade with some of Kiwi's recent comments in mind. The first break (trade) was after a 4h bar break down (there was a 4h "inside" bar after that one but to me trend was down) . The second possible trade on the chart, long, from the blue line, I would not have taken for the same reason (4h is still down).
And by the way, nice to see several people here from a forum of the past (at least to me), a traders roundtable if you so will. I would not have guessed
.Edit #1: I see Thales posted a potential short while I was writing this.
Edit #2: Thales post was for another pair... confusion reigns today. And the second long would have rocked. Oh well.
-
"Search for all posts" for an active member will only return the last 500 posts:
Showing results 1 to 25 of 500The limit makes it very difficult to read up on some users posting history, which means that some information is essentially lost.
-
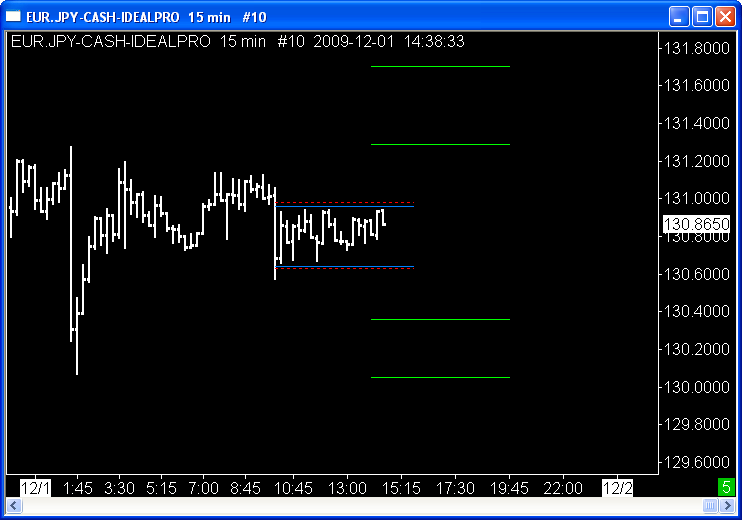
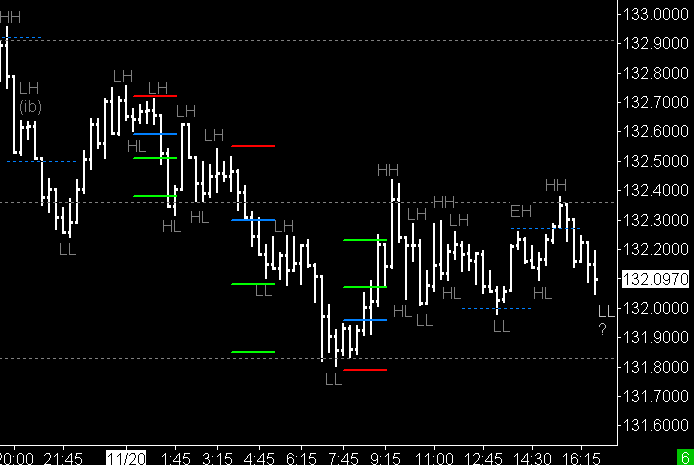
This is what I am looking at right now (just observing). Would move stop to B/E at 132.59.

-
...
Why can no one go with the flow of capital?
The problem with H L LH is that you will often get it against the trend in a good move.
...
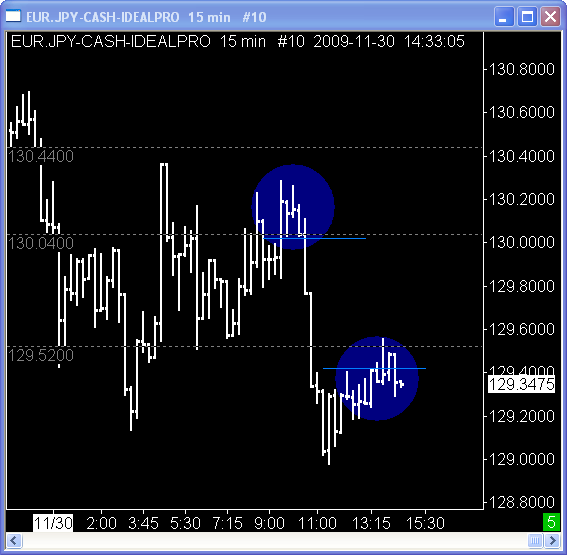
Kiwi, here's the big picture. Resistance at 132.91-ish (in my view) and an anticipated move down to support at 132.36 (about middle of the 132.90 - 131.83 area). So target 1 was before that first R, and target 2 below it. R:R would be close to 1 for the first target so the setup looked attractive to me.
I know you have described a similar context earlier in this thread and I found it interesting then (as I did now), I will definitely try to keep it in mind in the future.
-
Here's the EURJPY. Looking for a short. If price reaches 132.50 on momentum I would move the stop to BE.

-
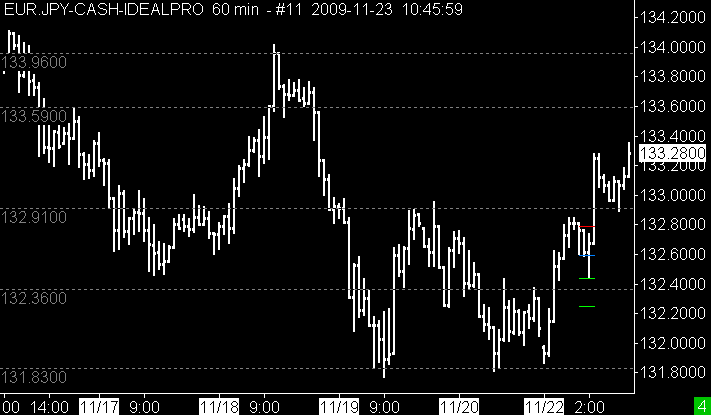
Here's my first (public anyway) attempt at S/R analysis of spot FX. Right now, a few hours before the Sydney open, EURJPY is in a range with no clear direction (131.83 - 132.26). For a reasonable R/R I would like to see some determination in any movement before entering. The lines on my chart are not actual trades, they are hindsight annotations.
I trade mech systems and usually I don't look at charts at all. Consequently I've never really used indicators. But seeing and anticipating price movement is still not easy. Might have something to do with me being a tad older than 9.
Thalestrader - thank you for starting this great thread.
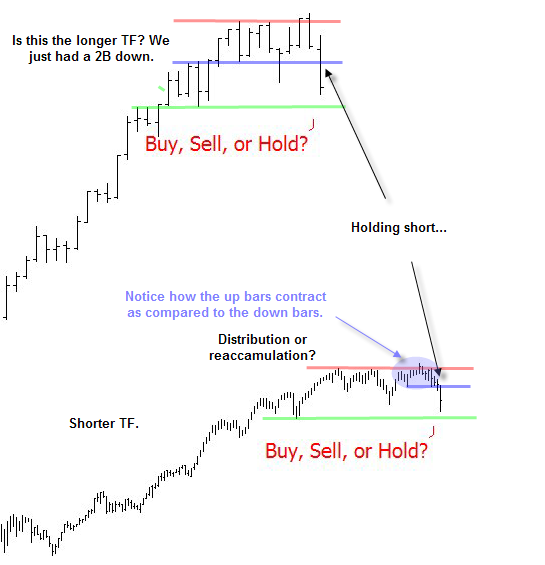
The Price / Volume Relationship
in Technical Analysis
Posted
Which is actually a very healthy thing to do.
Sorry, I could not resist.
Best wishes,
TB