
Welcome to the new Traders Laboratory! Please bear with us as we finish the migration over the next few days. If you find any issues, want to leave feedback, get in touch with us, or offer suggestions please post to the Support forum here.


metalhead
-
Content Count
80 -
Joined
-
Last visited
Posts posted by metalhead
-
-
Is this something that can be done intraday? Initiate a long position when the index closes at a 7 bar low.
-
From the first image the chart seems confusing:

Looking at the one marked buy 48, it doesn't appear to sell after a 7 day high.
It looks to be sold after a 6 day high.
-
Does this give as good of gains as dogs of the dow?
-
Let me preface this post by saying I am not trying to be a hater.
I have been reading this thread over the last couple days and am happy to see people having success with this method.
I noticed on many of the entry charts people posted, there were numerous trades that would've been losers prior to the current entry. I did not see this addressed anywhere. I am not saying that a method should have 100% winners, I just wanted to point out that according to the entry methods described in this thread, some of the charts would've had losing trades in the past if they had been taken (they were not taken, though, because they were from a time before this thread was created and before whoever posted them was using this system).
For example, this chart was posted:

Before the rally beginning in the middle of January, there were around 5 losing trades.
Now that this thread has been going on for over a year, what sort of win rate are you experiencing?
Is anyone trading this method intraday?
I agree with the Optiontimer's premise that despite using indicators you are really trading price action. This method is entering on pullbacks in a trend. It works well in trends. It works really well in big trends, especially if you pyramid. It fails to work when a trend ends, when a HH is followed by a LL, or when price chops.
Are you having success on things like the S&P (which people say tends to be less trendy) or currencies (which people say trend like crazy for years)?
Alright those were my questions and comments after reading this whole thread.
-
Great system, have been testing it on intraday with very good results, one has to define the exit strategy but that is just a byproduct of backtesting.How are you doing intraday with this?
-
I buy dips in uptrends and sell rallies in downtrends. I assume the major trend will continue until it doesn't.If this were day trading, my answer would have been different.
-OT
How would your answer by different if this were day trading?
-
i guess you need to define a filter for the chop.Unfortunately there are no effective chop filters because they only tell you if price has been chopping, not if price will chop in the future.
That's why I asked about the HH/HL thing.
-
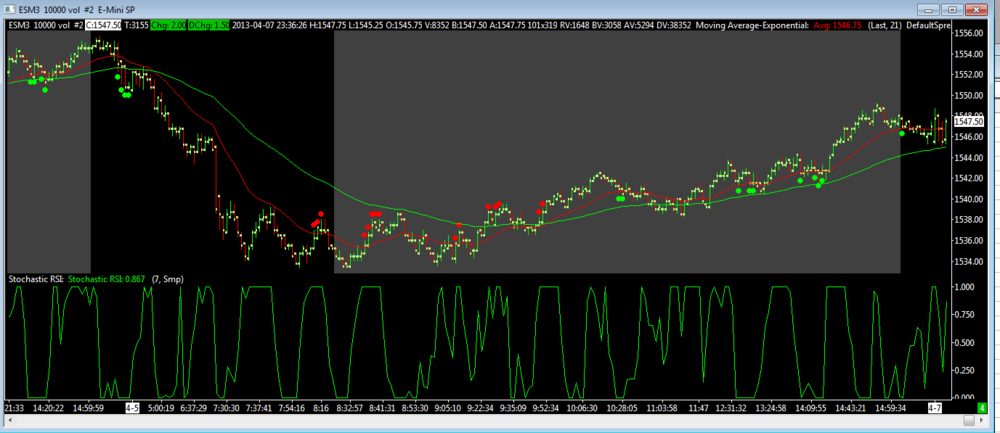
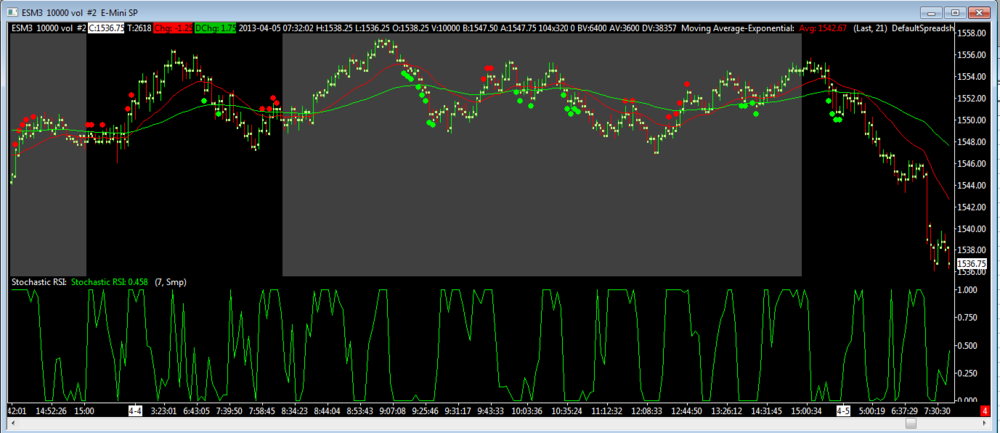
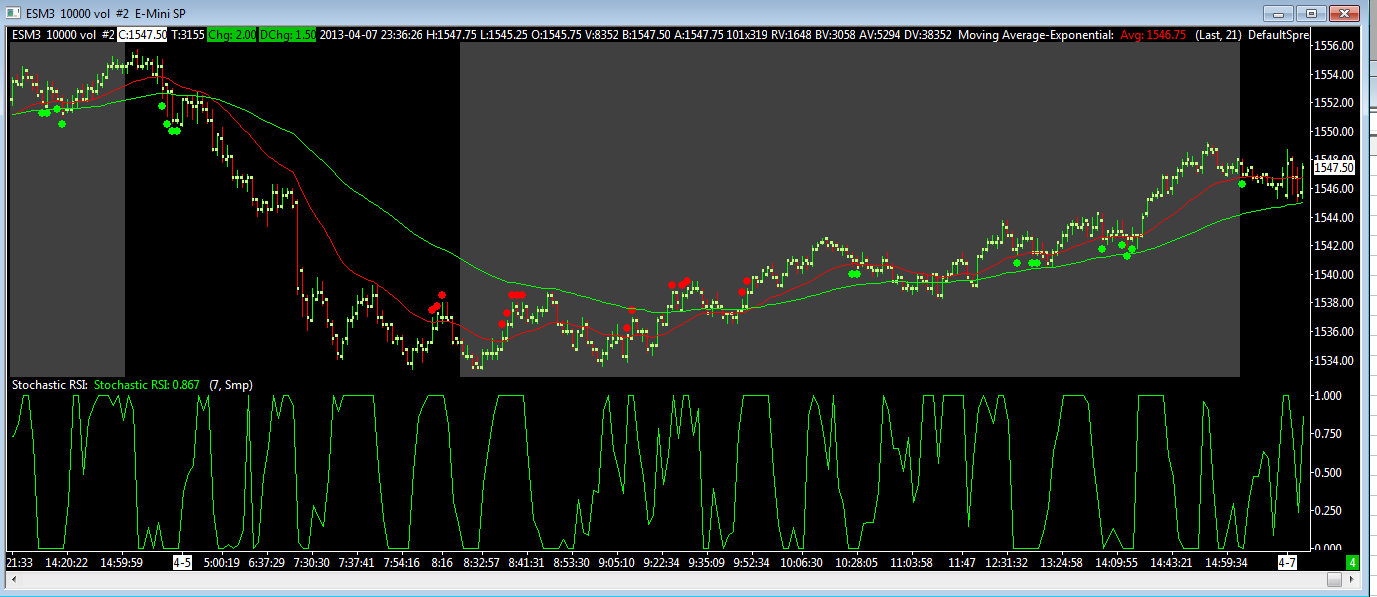
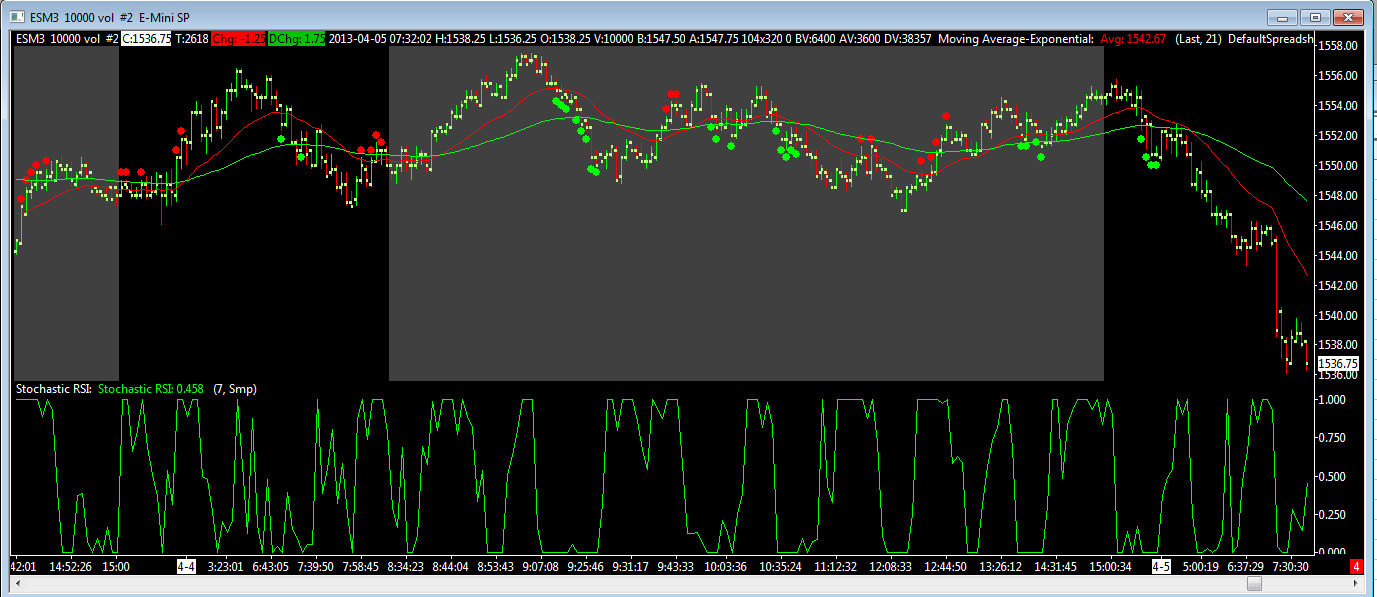
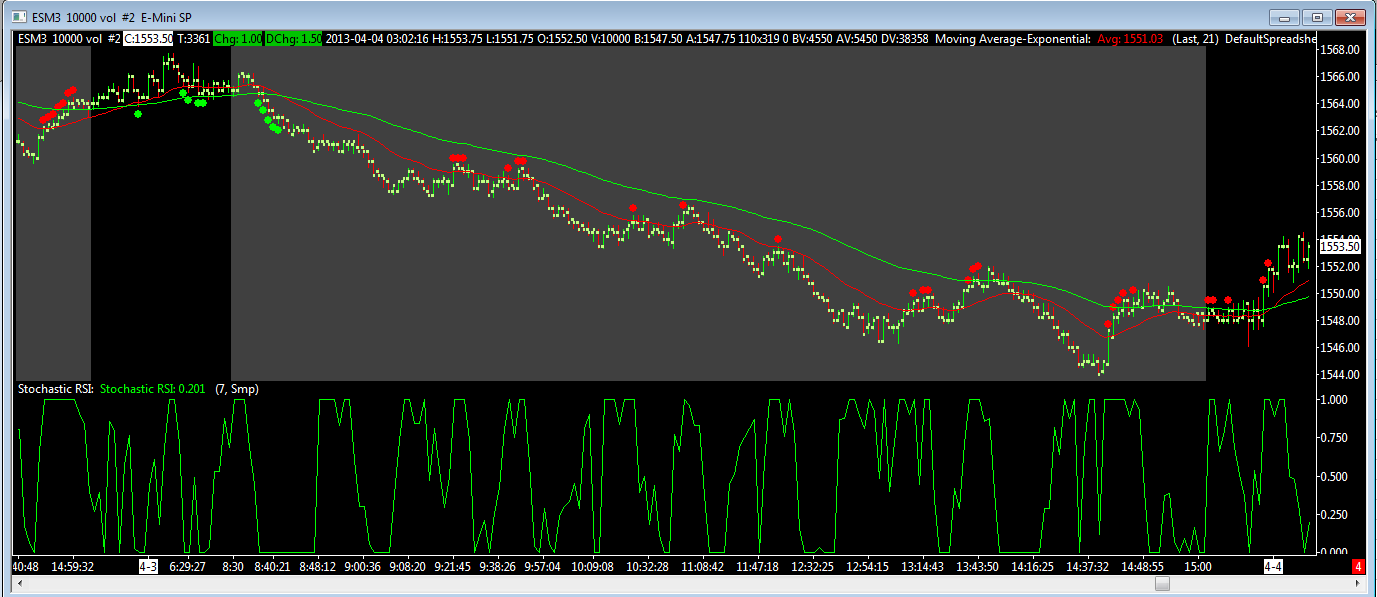
I coded up a "red light/green light" version of the rules on the first page in SierraChart.
Works well during trends as you may expect since it has you buying the pullbacks.
Not all of these signals would be taken like the ones where price is way outside the 65EMA. I only coded it to check if the low was below the 21EMA if the 21EMA is above the 65EMA for long positions and vice versa. You'll see.
Green dot = long signal
Red dot = short signal
Grey background = regular trading hours.
It worked great on April 3rd.
Not so much on March 12.
Question (sorry if I missed it in the thread): do you only take long trades following HH/HL or do you take tall long trades given by the indicators regardless of where they occur in swing highs/lows?
-
I just read this entire thread and saw I had posted in it a few years ago.
I tried to make something like this in SierraChart but it seems SC is limited by its smallest unit of time being 1 second. So with tick or volume charts, I can check to see if the time it took to create the bar was less than one second, which is basically 0 seconds, because SC cannot work with values less than 1 second but faster than zero seconds.
So I was able to using a tick chart of any size and measure the time between bars. Naturally the smaller size tick charts, the more accurate this would be. However, since it is limited to 1 second at the smallest, using too small of a tick chart size results in too many signals, and using too big of a tick chart size results in too few signals.
ES 500 tick chart:
http://www.sierrachart.com/Download.php?Folder=SupportBoard&download=185
ES 2000 volume:
http://www.sierrachart.com/Download.php?Folder=SupportBoard&download=186
ES 250 tick chart:
http://www.sierrachart.com/Download.php?Folder=SupportBoard&download=187
You can see there are many false signals on that last one.
I'm sure this isn't really close to UrmaBlume's but I also don't think you can get any closer with SC since 1 second is as fast as they can get.
-
ZLEMA is fun to play around with. You can smooth it with a fast HMA and get a pretty good MA.
However, it's still a MA and doesn't really offer any advantages.
Trade in the direction of its slope? Get chopped out from time to time.
Fade it? Lose in trends.
It has the same limitations as any other MA.
-
We developed this indicator and all of our traders use it every day, in fact we have 2 different versions of it and they use both.The HUGE CAVEAT with this indicator is that it can give the signal of a reversal when it is really a signal of continuation.
The good news is that with the proper filters based on order flow and the balance of trade it becomes easy to tell which is which. Without such filters or other corroboration its use can be very problematic.
cheers
UB
Want to share those, too?

-
anyone still using this indicator?
-
No replies cuz everyone is too busy making money with this indicator!

-
Just read this entire thread.
Has anyone adopted this indicator into their trading?
Has anyone coded it for SierraChart?
-
how are the micro FX contracts? Last time I checked they had almost no volume BUT they might have some potential. And at 1/10 the value of the normal FX contracts, you could afford to make a mistake or two.
Has anyone traded them? Or are they only being used by bigwigs to arb against the normal FX contracts?
-
As previously asked, "Does anyone have the 3 setups that go along with the indicator when purchased from PBF?" Many Thx in advance.i think someone on another forum said they are trading when the histogram and centerline match up, trading histogram divergences, and something about when the histogram breaks its own trendline. I can't remember exactly.
-
thank you, sir
(message not long enough ljkfdlkjflkjdfljkfljkdf :p )
-
Find attached screenshot withRed = Hull
White = Quick
Blue = Jma
All set to 4 periods
Hull definitely turns faster
Jma definitely goes flat faster and more smoothly than the other two (and that is about the only utility for mov avgs I have)
Quick came along for free so I shared it for ppl who don’t like to buy closed source products etc.
ie best one depends on your own distinctive needs.
hth
PS rurimoon re "Basically it change its formula base on which period it used"
That particular one is not it... :hmpf:
Thanks for posting that chart. Would you mind posting another one with the MAs overlaid over the candles, too? I want to see how price bars interact with the MAs.
Thanks!
btw did something happen to this thread? I got like 50 emails that there were new replies but there was really only one new reply.
-
I recently purchased the JMA (comes with DMX),VEL, and RSX indicators. I find the JMA and RSX to be very beneficial, and VEL a distant third.JMA is superior to HMA for reasons posted above: the phase element enables control of lag/overshoot. This is critically important.
The RSX is more than and RSI with JMA smoothing (I tried to avoid the expenditure, but could not code anything close).
For a short term trader these indicators can make a very positive difference.
Can you post some screenshots of when these indicators gave good signals and when they gave bad signals? Jurik's webpage doesn't have many examples of various time periods.
Thanks.
-
This post reminded me of a martingale system that i bought back around 1990 when I was first interested in trading.I did a little searching and it looks like the author has died, the software is no longer for sale, but the documentation is here.
the algorithm explained
http://www.petereliason.com/sts/book_ch11.html
main page
that domain seems to have expired. Any more info about this anywhere else?
-
I should also point out that there are a number of real traders trading in the chat room, in real time, and they are more than happy to answer questions (though perhaps not immediately since they are after all trading). Just click "chat" in the toolbar at the top of your screen.Looking forward to trying that out next week after the holiday.
Happy Holidays everyone!
-
An interesting thread, but a bad beginning. If you believe that discretionary trading is all guesswork and hate guessing and if you think that volume is useless and if you believe that useful trendlines can't be drawn in real time (and, it follows, are therefore useless), then you are virtually guaranteeing your own failure, or, if you prefer, the failure of anyone else to "prove" the value of trading price (i.e., that which is created by the "market" and not by the trader, such as MAs, trendlines, pivot points, Fib, and the vast array of other indicators).In short, if you're genuinely interested in learning how to trade price, you can't expect to do so if you approach the subject with the attitude that it's all a crock. On the other hand, there's no particular reason why you or anyone else ought to feel as though they are morally obligated in some way to learn how to trade with price alone. Trading by price has no absolutely higher or lower value than trading with indicators. If you believe in your heart of hearts that indicators are the way to go, then stick with them and work it through. Only when you are prepared to address trading by price alone with an open mind will you be prepared to learn how to do it.
Corrections:
I've never found volume to be useful, and the successful traders I've spoken with say they don't use it, either. I also say I am leaving it up on my charts just in case I am able to finally get something from it.
Re: trendlines. 99% of the posts on ET by "gurus" show beautiful trendlines drawn after the fact, and trades made based on trendlines that could not possibly have been drawn at the time. I'm not saying it's impossible to draw trendlines in real time, just that many, many people draw them after the fact and act like they were there all along.
If I sound cynical in that thread, it's because there is so much BS on ET. Fake gurus like to lead newbies astray and try to get them to pay for their courses that don't even backtest profitably (i can name 5 ET'ers off the top of my head who are known for this... and I have them all on my ignore list). I'm putting in a lot of work, I just have my BS detector on from the beginning.
-
Seems like this thread was made a day after I made this thread over at ET:
http://www.elitetrader.com/vb/showthread.php?s=&threadid=146764&perpage=30&pagenumber=1
You may want to check that thread out, too. I'm trying to learn PA and have removed all indicators. So far I'm doing horribly :p
That thread is much longer, but is also full of a lot of guru fortune cookie BS which you have to wade through.
Glad to see there are some PA thread over here on TL.
-
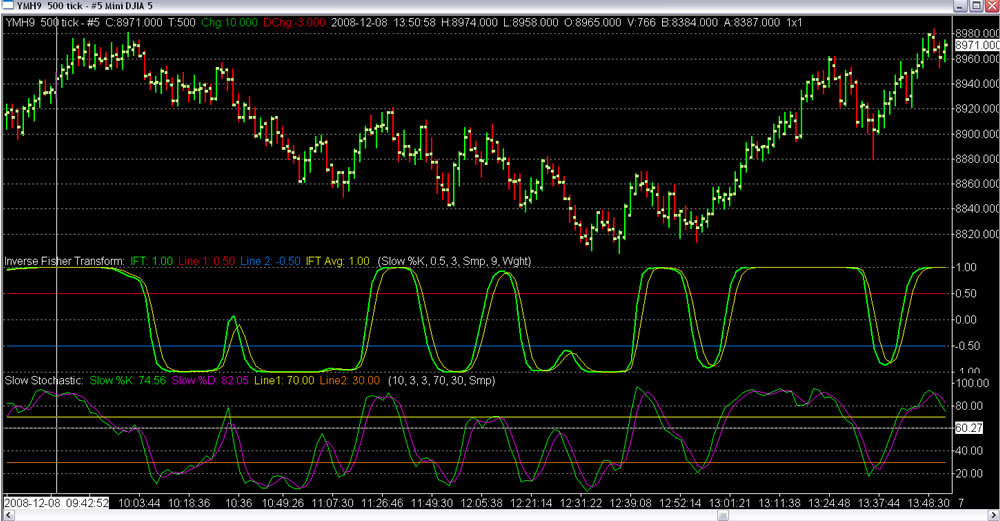
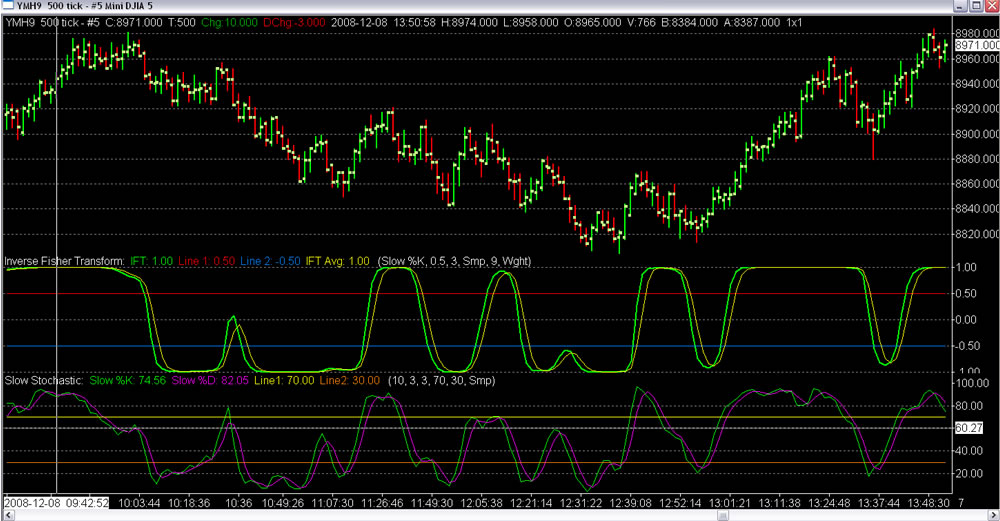
like this
(IFT (middle) is applied to slow stochs (bottom))

Trade Intensity
in Technical Analysis
Posted
I wanted to refresh this thread and see if people were using this indicator.