
Welcome to the new Traders Laboratory! Please bear with us as we finish the migration over the next few days. If you find any issues, want to leave feedback, get in touch with us, or offer suggestions please post to the Support forum here.

aaa
-
Content Count
466 -
Joined
-
Last visited
Posts posted by aaa
-
-
Hi bluehorse
So, TS help is no longer available offLine from 9.1
:=(
What about 9.0 ?
:=)
Is anyone has a 9.0 release on his computer and able 2 check it ?
Would U mind 2 open the eld attached compiled with TS9 + 9.1 from MarkSanDiego ( a great EL programmer)
and 2 copy both functions + indics in 4 seperates texte files
and post them ?
best regards
aaa
*********************************
Software release history
-
TradeStation 3.0 (January 1993)
-
TradeStation 4.0
-
TradeStation 5.0 alias TradeStation 2000i (February 1999)
-
TradeStation 6.0
- TradeStation 7.0
- TradeStation 7.1
-
TradeStation 7.2
- TradeStation 8.0
- TradeStation 8.1
- TradeStation 8.2
- TradeStation 8.3 (June 2007)
- TradeStation 8.4 (October 2008)
- TradeStation 8.5 (February 2009)
- TradeStation 8.6 (April 2009)
- TradeStation 8.7 (December 2009)
-
TradeStation 8.8 (October 2010)
- TradeStation 9.0 (October 2010)
- TradeStation 9.1 (November 2011)
*********************************************
07/14/11
Convert function DrawLRChan to a local Method for greater efficiency and to avoid passing large numbers of parameters to function.
-
TradeStation 3.0 (January 1993)
-
Hi BlueHorseHello,
I'd be happy to help, but the only compiled html files I can find in the Program directory are:
elanalysis
elobject
elword
spr_topics
tradestationhelp
tsdevhelp
Any suggestions to help me find what you're looking for?
Kind regards,
BlueHorseshoe
A windows help file is identified by a *.chm extension
Would U mind 2 have a look into your
tradestation\Program\
or make a search with a *.chm filter in your TS main program included subdir ?
If TS 9.1xx dir structure = 8.xx
U should find the help file named something like :
easylanguagehelp.chm
Please rar it B4 attache it
Anyway many ThanX 4 your gently help
aaa
-
Hello Happy Multichart' users
Here are TradeStation 8.7 help file from Tradestation\Program\
10 x Much more documented !
easylanguagehelp.chm ( 3.3 Mo) <= > PowerLanguage.chm ( 0.3 Mo )
For information ;
spr_topics.chm ( strategies)
Enjoy !
TS 8.7 EasyLanguage Reference.rar
-
Hello,

May I ask why you need someone else to acquire this for you?

Regards,

BlueHorseshoe
Dear BlueHorse
I use MC in PowerLanguage very similar than EasyLanguage in TS.
Scripts compiled after TS 9 are unfortunately no more compatible with MC.
They are new functions and "Method".
Also TS help is much better documented than MC help
( Please, have a look in the attached file Help of the tiny MC help )
and May B It could help coders w/o TS platform 2 have the latest release of EasyLanguage help file ...
Best regards
aaa
PS It's ONLY one help file (*.chm must be compressed 2 upload it ), not the entire program of course !
-
Hello
Could someone post here his last TradeStation release 9.1.24 "easylanguagehelp.chm" file located in the program dir ?
https://www.tradestation.com/trading-technology/whats-new/tradestation-9-1
-
Hi trader273
U can test Waldo 2 indicator here
http://www.traderslaboratory.com/forums/trading-indicators/8125-td-waldo-02-a.html
and Waldo 3 indicator here
http://www.traderslaboratory.com/forums/trading-indicators/8415-tom-demark-waldo-3-a.html
-
currently i have something but alert comes too late like 3 candles after..regards
Hi JaimSierra
Bad news ;
Pivot function needs x Bars back 2 detect a signal
2 bad

Good news
It's possible, with array or a different logical approch, 2 detect a pivot in RealTime showing a divergence, or a ZigZag, or whatever indicator.
2 good

regards
PS others divergences indicators here based on the same MARKPLEX code
http://www.traderslaboratory.com/forums/10979-aaa/
Markplex very nice site here
http://markplex.com/free-tutorials/
//----------------------------------------------------
inputs:
//----------------------------------------------------
StochLength(  14 ),
Length(  20 ),
[color=blue][u][b]LeftStrength( [size=7]3[/size]  ), [/b][/u][/color]
RightStrength( 1  ),


[center][size=3][b]Pivot (Function)[/b][/size][/center]


The Pivot function returns the value of a pivot point and the number of bars ago the pivot occurred.

Syntax
Pivot(Price, Length, LeftStrength, RightStrength, Instance, HiLo, oPivotPrice, oPivotBar)

Returns (Integer)
The oPivotPrice and oPivotBar output parameters return the price value of the pivot point and the number of bars ago it occurred.  The Pivot function itself returns a value of 1 if a pivot is found, and -1 if not found.

Parameters

Price
Specifies which bar value (price, function, or formula) to be considered.

Length
Sets the number of bars to consider for the pivot.

[b][color=blue][u]LeftStrength[/u][/color][/b]
[b][color=blue][u]Sets the required number of bars on the left side of the pivot bar.[/u][/color][/b]

RightStrength
Sets the required number of bars on the right side of the pivot bar.

Instance
Sets which occurrence (that is, 1 = most recent, 2 = 2nd most recent, and so on) to return.

HiLo
Sets which pivot values to return, 1 = High, -1 = Low.

oPivotPrice
Outputs the specified bar value at the pivot point.

oPivotBar
Outputs the number of bars ago the pivot point occurred.

Remarks
This function is used to find pivot or swing points.  This function allows you to specify variable strength sides, as well as whether the pivot point should be a high or low pivot.

Example
Assigns to Value2 the most recent pivot low price over the last 21 bars and to Value3 the number of bars ago the pivot low occurred using a left strength of 4 and a right strength of 2.
Vars: oPivotPrice(0), oPivotBar(0);
Value1 = Pivot(Low,21,4,2,1,-1,oPivotPrice,oPivotBar);
Value2 = oPivotPrice;
Value3 = oPivotbar;
-
Hi OneSmith + Urma Blume
You are real respectable gentlemen...
:=)
********************
about Multi-Time Frame platforms
*********************
AmiBroker Solution ;
AmiBroker can do that very easily
TimeFrameSet( );
TimeFrameRestore();
TimeFrameExpand( );
******************************
A TradeStation smart solution here
JAM Higher Timeframe Pack ( I guess it is the one posted in this thread by moshinqreshi )
http://www.jamstrategytrading.com/HTPack.htm
******************************************
Multichart Solution
ADE ( All Data Everywhere )
or
Pour un graph Avec MCUne solution est d'Utiliser plusieurs instruments à des résolutions superieurs en "subchart > Hide" dont les valeurs des indicateurs sont toutes identiques.
Ex =
ecran principal = 1 mn = MACD 12-26-9
Subchart Hide = 5 mn = MACD 12-26-9
One solution is to use several instruments to superiors resolutions "subchart > Hide",
the values of the indicators are all identical.
ex =
main screen = 1 mn = Mov Avg 50
Subchart Hide = 5 mn = Mov Avg 50
*******************************
*******************************
-
JAM is an honest vendor. Definitely one of the best EasyLanguage programmers. Highly skilled and knowledgable.
I agree 100% => AMAZING indicators + tools !!!
and if it's the same indicator, it's not fair 2 post it w/o making a reference to him and his site.
-
ThanX OneSmith
I think that I've already posted Xcellent free locked JAM's MA MultiTime.eld in the past.
http://www.jamstrategytrading.com/FreeStuff_files/JAMHTPACKFREE.ELD
If

Multi-Time Frame MA – OOEL = Jam's indicator

and // or

Darvas Box Indicators for TradeStation = has been already posted by jojojo ;

{
[url]http://www.traderslaboratory.com/forums/trading-indicators/16127-darvas-box-indicators-tradestation.html#post178653[/url]
}

then

it should B fair 2 specify WHO is the author and WHERE it comes from ;
PS : JAM is active on the TS forums as mmillar.
.
-
Hi
It's writen with TS 10.90.06.9035 => unreadable 4 me :=(
Can someone post it in texte format ?
ThanX
-
nota bene
Volume by Price bars prices should be watched as potential support/resistance during a pullback.
it is important to understand how Volume by Price works.
Current Volume by Price bars should not be used to validate past support or resistance levels because the indicator is based on all the price-volume data shown on the chart.
This means six months of data for a chart that extends from January to June.
It may appear as Volume by Price identified support in March, but keep in mind that the indicator data extends well beyond March, which is essentially the future.
To effectively identify support or resistance in March, the chart needs to end at or before March, not after March !!!
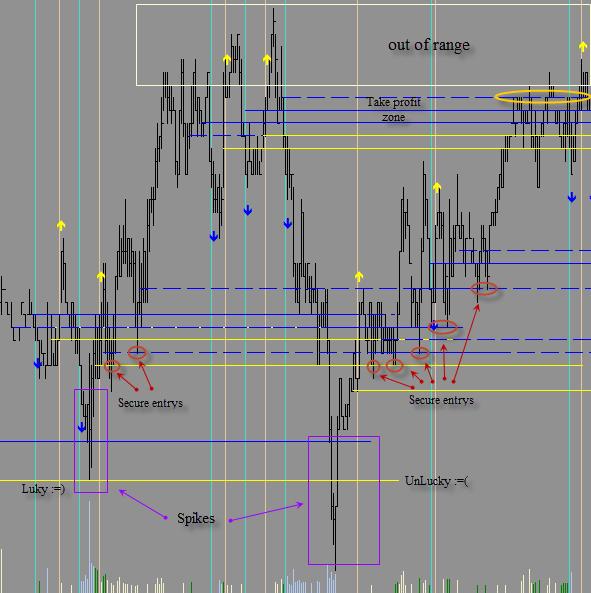
For this reason we need to draw FIXED lines at EACH identified POC.
Then, we will use these identified estimated different sup/res lines in the near future time axis to open a position in an eventual pullback.
( secure entries and Take Profit Zone ( reversals ?) on the graph below).
Watching a moving POC (Point Of Control) in a "Market Profile" in a data playback mode will illustrate well this moving concept.
aaa

-
.................
:=)
-
Hi Johnny
ThanX 4 the interesting TRO links.
Why and when a price become 2 B a Support or a Resistance, is that the question ?
My graph is not based on High & Low Elliott Fibo retracements, even tho it looks like this.
Learn How to Apply Fibonacci Retracements to Your Trading | Elliott Wave International
but rather a full strategy based on identified zones of price/Volume/Time ( POC) Support/Resistance.
-
Hi SadScorpion
IMO choosing highs & lows are fragile & risky support/resistance Bcoz they are out of range, or in an Xtrm volatility zone (like spikes) ;
they are tests 2 find a compromise accepted by all... or a possible break out !!!
Who knows ?
Who will take care of irrationnality and base their decision on it ?
***********************
But the moment when big hands Xchange there contracts in a range, identified by volumes, is a very interesting zone of support/resistance lines.
Bcoz When Prices moves with a (good ;=)) signal, contrarian traders + scalpers moves back price to these lines, and they Bcome very secure points of entry in the identified trend.
Then, last support/resistance lines starts 2 B a secure take profit zone or, if it is a BreakOut, leaving time 2 the trend 2 develop itself until new support/resistance lines appears 2 sold the position.
aaa
-
Hi Nuno
ADE doesn't send information tick by tick but "bar by bar"
I'm not sure at 100%
Can someone confirm ?
******************************
AmiBroker can do that very easily
TimeFrameSet( );
TimeFrameRestore();
TimeFrameExpand( );
**************************
A TS smart solution here
JAM Higher Timeframe Pack
The JAM HT Avg Simple indicator works for tick, minute, daily, weekly, monthly and yearly chart intervals.
It can display a minute based moving average on a tick chart, a daily moving average on a minute chart, and weekly, monthly or yearly moving averages on a daily chart. No slow and complicated DLLs . No multi-timeframe charts to mess up your chart format .
http://www.jamstrategytrading.com/HTPack.htm
aaa
PS Je trade aussi le FCE ;=)
.....

-
and ThanX 2 Tams also !
always onboard 2 help beginners !
-
Dear OneSmith
ThanX very much 4 your smart code
It will light my script & open new horizons 4 my ideas.
:applaud:
aaa
-
Hi Tams
ThanX 4 your help.
Oups, I don't understand your logic
I've tryed this but w/o success
I check on a year graph the high bar date ( 1071231 ) from which I want 2 find the monthly bar date ( 1070731 ) corresponding to this year high bar
I close the yearly graph
Now I open a monthly graph from 01-01-2000 to now, and test this idea
variables:
Price.Year(0),
Date.Month(0);
// First find the high year price
if date = 1071231 then
Price.Year = HighY(0); // correct
// Then find the monthly date
if h = Price.Year then
Date.Month = date; // uncorrect
print("Year High Bar Price = ",Price.Year," Monthly Bar date = ",Date.Month);
-
Hello
Let say that we know the highest price of a bar year
Yearly
2011 = 4000
How to find the bar date of this 2011 yearly high in lower resolution?
Quaterly
4000 = 2011-31-03
Monthly
4000 = 2011-28-02
Weekly
4000 = 2011-19-02
Daily
4000 = 2011-15-02
InDay
4000 = 2011-15-02 15:33
aaa
-
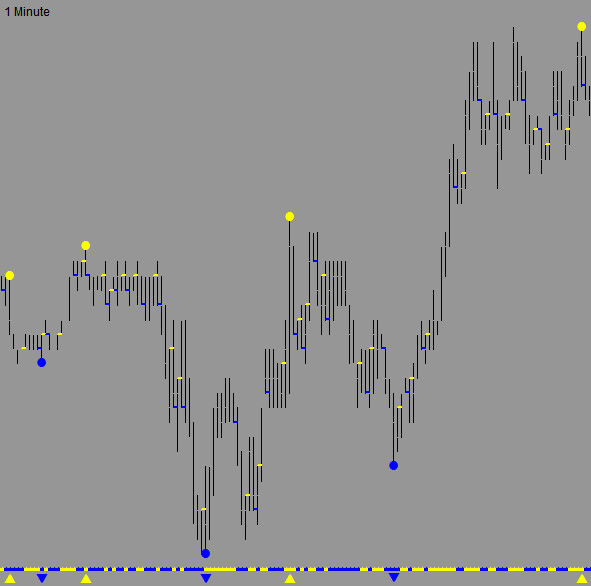
What I need is an indicator that will tell me what 1 tick above the current high and 1 tick below the current low is.
I need it displayed in the price pane where the current price is displayed
Hi PitTrader
Do U mean something like this ?
-
Hi Tams
Can U send me free money from HSI via paypal ?
I will send U back free fresh air from our mountains via Jet Stream.
ThanX in advance

-
Hi OneSmith
ThanX 4 your help.
I had 2 wait 1 year 2 have an answer 2 my question ( better late than never ) !!!
I should have never found it Bcoz I don't have MapSS.New function in my ADE library ( 1.07)
What is the ADE release now ?
Can U send me a copy of your ADE library and eventually more recently pdf than the one I've posted ?
Here is my library content
ADE Generate Class Indicator
ADE Plot Info Test Indicator
ADE Plot OHLCV Indicator
ADE Save Info Test Indicator
ADE Save OHLCV Indicator
ADE.BarDate Function
ADE.BarID Function
ADE.BarInterval Function
ADE.BarTime Function
ADE.Daily Function
ADE.DeleteMap Function
ADE.DeriveBigBar Function
ADE.DeriveOHLCV Function
ADE.Directory Function
ADE.FileExists Function
ADE.FileName Function
ADE.FindOrAddListN Function
ADE.GenerateCode Function
ADE.GetBarIndex Function
ADE.GetBarInfo Function
ADE.GetFileIntervals Function
ADE.GetFileSymbols Function
ADE.GetIntervals Function
ADE.GetMap Function
ADE.GetOHLCV Function
ADE.GetRequiredMap Function
ADE.GetSeries Function
ADE.GetSymbols Function
ADE.IntervalDesc Function
ADE.IsHigherTF Function
ADE.Monthly Function
ADE.Normalize Function
ADE.OnNextBar Function
ADE.OpenMap Function
ADE.ParseParamStr Function
ADE.PutBarInfo Function
ADE.PutOHLCV Function
ADE.PutOrPushN Function
ADE.RaiseError Function
ADE.ReadDataFiles Function
ADE.ReplaceSepTag Function
ADE.ReplaceStr Function
ADE.SaveMap Function
ADE.SortDataMap Function
ADE.TickBarT Function
ADE.TickBarV Function
ADE.TypeZeroBarID Function
ADE.TypeZeroInterval Function
ADE.TypeZeroParseID Function
ADE.UseFile Function
ADE.ValidateName Function
ADE.VolBarT Function
ADE.VolBarV Function
ADE.Weekly Function
ADF.Average Function
ADF.AverageFC Function
ADF.Highest Function
ADF.HighestFC Function
ADF.Lowest Function
ADF.LowestFC Function
ADF.Summation Function
ADF.SummationFC Function
ListN.Average Function
ListN.Back Function
ListN.Clear Function
ListN.CopyMapKeys Function
ListN.Count Function
ListN.Get Function
ListN.IsSorted Function
ListN.Lookup Function
ListN.Maximum Function
ListN.Minimum Function
ListN.New Function
ListN.Next Function
ListN.PushBack Function
ListN.Put Function
ListN.Release Function
ListN.Resize Function
ListN.Rewind Function
ListN.Sort Function
ListN.Summation Function
ListS.CopyMapKeys Function
ListS.Count Function
ListS.FindFiles Function
ListS.Front Function
ListS.Get Function
ListS.Insert Function
ListS.New Function
ListS.Next Function
ListS.PushBack Function
ListS.ReadFile Function
ListS.Release Function
ListS.Resize Function
ListS.Rewind Function
MapNC.Count Function
MapNC.Get Function
MapNC.New Function
MapNC.Put Function
MapNC.Release Function
MapNC.Remove Function
MapNN.Get Function
MapNN.New Function
MapNN.Put Function
MapNS.Count Function
MapNS.Get Function
MapNS.Put Function
MapNS.ReadFile Function
MapNS.Share Function
MapSC.BuildRowMap Function
MapSC.Count Function
MapSC.Get Function
MapSC.New Function
MapSC.Next Function
MapSC.Put Function
MapSC.ReadFile Function
MapSC.Release Function
MapSC.Remove Function
MapSC.Rewind Function
MapSC.SetColumnOrder Function
MapSC.Share Function
MapSC.SortByCol Function
MapSC.WriteFile Function
MapSN.Clear Function
MapSN.Get Function
MapSN.New Function
MapSN.Next Function
MapSN.Put Function
MapSN.Rewind Function
-
Salut aaa,
merci pour cette reponse très claire
Merci surtout à mon professeur, Maître Sam T. qui m'a enseigné patiemment à énoncer clairement mes pensées (et beaucoup d'autres choses...
).Une pensée à la fois,
Une logique à la fois,
Une action à la fois,
Une ligne par phrase,
Une phrase par structure.
Si on a plus d'une pensée dans la même ligne ; on est cuit.
Si on a plus d'une ligne dans la même phrase ; on est cuit.
Si on a plus d'une phrase dans la même structure ; on est cuit.
:ciao:
TS Help
in Coding Forum
Posted · Edited by aaa
Hello
05-12-11 TS 9.0 LRCHAN.ELD => without Method ( the one I need now )
from 07/14/11 MarkSanDiego Convert function DrawLRChan to a local Method for greater efficiency and to avoid passing large numbers of parameters to function.
13-08-05 TS 9.1 LRCHAN.ELD => with method ( the one U've posted )
I need 2 have both releases 2 understand how he did the conversion 2 (try 2...) understand the method logic.
it should B hard w/o help file... :missy:
I'm not a coder, all I know comes from learning the coders' works
ThanX so much BlueHorse, U make a lot 2 help us
aaa
more great faster functions here
http://hightick.com/Tips.html