
Welcome to the new Traders Laboratory! Please bear with us as we finish the migration over the next few days. If you find any issues, want to leave feedback, get in touch with us, or offer suggestions please post to the Support forum here.


SRspider
-
Content Count
45 -
Joined
-
Last visited
Posts posted by SRspider
-
-
Ok thanks for that. It does make sense. I know it doesn't always happen but after a break out sometimes we get a reaction. I think for me I would rather wait for that to jump on , especially if I don't have the data on the ranges that you spoke about. I will though start looking more closely at the NQ since that is the instrument I trade mostly.
Thanks again.
This particular type of data gathering can be done with static charts. You can collect the data in just a few days.
-
Thanks DB for the input. When you buy a break out what might you consider to make it more probable that it is not a false breakout? I would imaging that the volume must be higher.
A question that is on everyone's lips.
The answer lies in collecting ranges and determining how many points price must rise above the range to signal genuine intent. This will vary, of course, depending on the instrument, so there's no point in testing a bunch of stuff you have no interest in trading. If you're interested in trading the NQ, collect NQ ranges. If you're interested in stocks, then I'm afraid you're going to have to collect data on each.
This is all part of the characterization process. If you don't go through it, you'll pay.
As to volume, I wouldn't bother. The gurus will tell you that volume must accompany a breakout, but this isn't true. Volume often waits a bar or two or several before kicking in largely because the breakout itself goes unnoticed. Only after the breakout does the volume come in. Or at least one hopes it does if one went long.
If you're interested in volume, I suggest you look at the volume thread, below.
-
Ive been covering a lot of the material since yesterday and making notes. I can see how the context is extremely important in figuring out what trades to look for and where.
In determining topping or bottoming action i see that there are several indications.
1. Climactic volume
2. The slope of the incline or decline of the price action
3. The closing of the bars that poke the lows or the highs
4. Once that climax is identified a techical rally follows if it was a selling climax.
5. The key is then the secondary reaction which should create a higher low.
Not necessarily. Price may dip below the previous low but pull back up due to buyer interest. If this bar "closes" at or near the high, this indicates buying interest and can be bought just like a higher low.
The VSA people like to call this a "spring", but there's no need to come up with a special name for it unless you're trying to sell a system to somebody. Beginners like lots of lingo.
6. If this in turns breaks a supply line there is a good chance the market will enter into an accumulation phase and should be bought.
7. Then there should be some good volume increase on the up move after that secondary reaction. This is also key because buyers are willing to pay the ask
As far as buying on a dip in an uptrend. Several key factors come in to play
1. Coming down to a support area not necessarily. Be careful with regard to "support" and "resistance". Price is reaching a level where buyers are interested. You can't always know this in advance. Judge the market by its own action.
2. Shortening of the thrust down
3. Closes near each other
4. Low volume on the way down, because sellers are having to lower the ask in order to fill orders
5. Mini selling climax is oka
6. closes then near top of bars and higher volume on the way up, again because buyers are willing to pay the ask
7. Narrow range bars or narrower
When I start seeing this type of action it would be safe to buy that dip for a continued up move. He describes it as "dullness"
Works the opposite for selling a rally in a down trend.
Ranges
can be accumulation or absorption or they can be distribution. Some of the clues obviously is the context that led to the range. But once in the range lets say we are starting to see bars with higher lows and higher highs within the range or pokes under the range that come back up through and the volume on higher closes is bigger than the volume on lower closes it may be showing signs of absorption .
the opposite for distribution.
Ignore all of that.
Buy a breakout through the upper limit of the range.
Short a breakout through the lower limit of the range.
Keep it simple.
There is a lot in that book to take in.
Am I getting this right?
Thanks for your help.
-
Thanks DB,
I will give it a go this weekend and post any questions if you don't mind. As far as the charts go , I'll just be watching for now and try and view in the context of what I will be reading.
-
Hi Db,
Regarding springs and upthrusts , its just terminology I picked up taking other courses and reading stuff on Wyckoff, if it is or is not (Wyckoff) I am not really sure and maybe its something made up.
But regarding reading the market. This is kind of what I mean , I noted on the QM chart of today. Its hindsight to its easier to see but to see it real time is what I would like to accomplish. I am willing to start over and erase it all if you can point me in the right direction.
You may have read the Evans' version of Wyckoff's course. Wyckoff's original course was not released from copyright until a few years ago.
I suggest you look at the Wyckoff Lite stickie uptop. It has a link to the original course, if you want to read the whole thing. If you don't, suggestions are made to abbreviate it. What is most important is Section 7.
5_8_2015.thumb.jpg.a369266ff3c610120e023f8ac7d2a8df.jpg)
-
Ok thank you for your feedback. After giving this some thought what I would like to be able to do is analyze the market via the Wyckoff method using the supply and demand lines ranges spring and up thrust tests climactic selling and buying pushes through supply or demand or breakouts while incorporating volume. In this analysis be able to spot trading opportunities on a 5 or 3 min chart managing my risk effectively. How do you think I should approach this ?
What do you mean by "spring" and "up thrust test"?
-
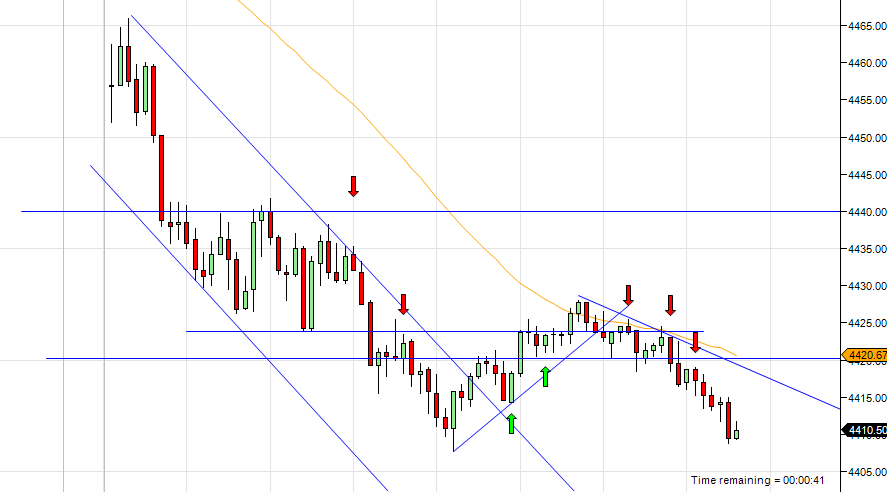
I know I probably did this all wrong but here is the logic
behind the trades today
First Green arrow was a long on a retrace after the break of
that small double top or small range.That stopped out so it leads
to the first red arrow which was a short on the failure which also stopped
out.
The second green arrow was a long based on the fact that
they were holding the 50% mark of the range. that
one worked out ok.
The Third green arrow was a long basded on a break out
of the range but it came back intot he range and stopped out.
I tried the long again on the fourth green arrow and was again
stopped out.
Not the best outcome today and I know probably didn't do things correctly.
Whether you did it "right" or "wrong" is way too early in this process. While I like the clean chart as it is so much easier to read, you should not be trading at all unless, as I said yesterday, you only want to borrow an element or two from the SLA.
But if you want to learn the SLA, you're going to have to spend some time observing without thinking about trades and where you'd enter and where you'd exit and where you should have entered and where you should have exited and so on and so on and so on. This is in a way of form of rewiring. The more messed up you are, the longer it will take, but with replay it won't take nearly as long as you might think.
My charts, which I posted to ET, follow:
While I don't want to nag, I do want to point out, again, the advantages of trading a longer bar interval. I realize no one who's posting is doing this, but I continue to encourage those who are not in a position to daytrade to explore this option.
A 1m chart of today's activity. 0800 is not especially early, even if one works at home.
5_7_2015.thumb.jpg.bd37fcf58df1893941407065a5a2f26a.jpg)
-
Hi Db
I'm trying to stick to the SLA/AMT, so if your taking about the ma and the tick chart at the bottom I can remove those since I'm not really using them. Except maybe the TICK chart to better time an entry. Your comments are appreciated.
thanks
-
First red Arrow a short at the top of the channel.Didnt amount
to much so I scratched it.
The first Green Arrow a long on a retracement after the
range break. But it was close to the upper channel line
so I didn't expect much and just scalped.
The second red arrow a short after the price action showed
weakness a failure to go up and at the upper
trend channel line.
Fourth Red Arrow a short after price failed to move up
at that lower trend channel line. A break of the demand line
as well. this was a full stop out.
Fifth Red arrow a short after the demand line break and
a retracement back up.
I don't really like taking more than five trades a day and i am feeling
that I took these pretty quick, but those were the setups. Going to observe
now and see if something really solid sets up.
I see also that we broke down through a hinge on the daily
chart so I have more of a short bias.
Chart2: Took another short after the break of the support or bottom of range and a retrace back up to the support now resistance.
_TICK(3Min)5_6_2015.thumb.jpg.a8ca6f799289e3f442864a65b6d92921.jpg)
_TICK(3Min)5_6_2015-1.thumb.jpg.8e33da24ad7bed1f4f00817e63e57be9.jpg)
-
Tomorrow I will start my journal. The main objective is to practice reading the market and identifying opportunities to trade. Mainly day trading the NQ on a 3 minute chart, but will do analysis on the weekly, daily, hourly, 30 min, and 3.
-
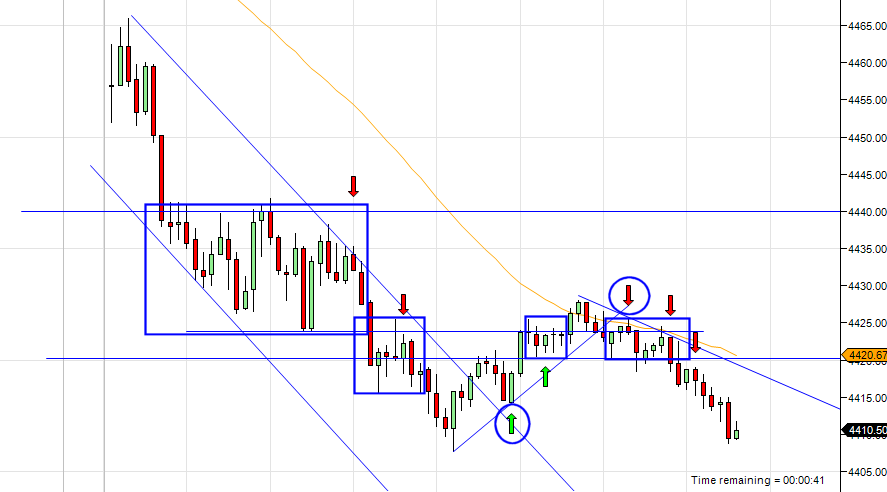
Thanks for the feedback DB. The second red arrow is a short on a re trace after the break of the first range box you have drawn. The last red arrow was a short on a re trace after the break of the second range box you have drawn. Were those valid if viewed in that way?
Thanks again
Yes, but the longer you wait, the more likely you are to get stopped out.
-
I think I understand the concept. Here are some of the trades I saw today in real time. Please let me know if i'm on the right track.
Saw this other Long after the Supply Line Break and Retest. It was good til the top of the range there.
Yes and no. More yes than no. Trading ranges means trading reversals, and one can't trade reversals until the limits of the range have been established. If the range is exited before these limits are established, then there's no trade. Which is why I avoid trading ranges. If nothing else, that provides a break as everything ranges for at least a little while, sooner or later.
Therefore, the only trades you have that are in keeping with the SLA are the long off the retracement after the break of the supply line and the short off the retracement after the break of the demand line. Whether or not you stay in the latter depends in part on your risk tolerance and in part on your faith in AMT.
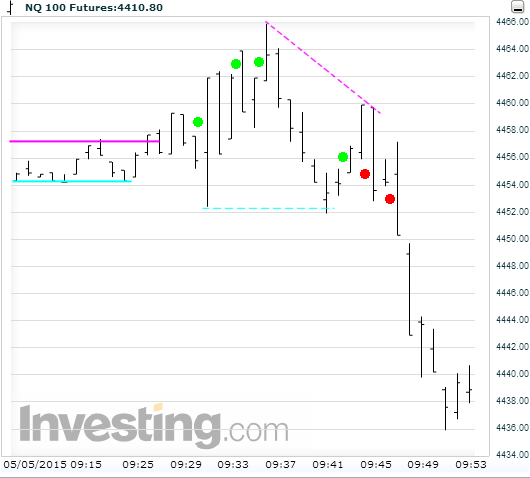
All of which is moot, of course, if you had entered far earlier when price dropped out of the opening range at 0945. Then you wouldn't have to fool with any of this.
I went ahead and annotated this opening because it was and is interesting and is typical of the kind of real-time confusion that can assault the SLAer if he isn't completely confident in what he's doing.
You start with the range, which is usual though not every session begins with one. But every one of these entries gets stopped out. According to the SLA, you ought to stop after one, but people keep going.
Then the demand line is broken but there's no retracement on the way down. So no entry. Then you have what appears to be a double bottom, so you go long off that. This earns a few points, but the price goes nowhere and forms what appears to be a lower high. By the time the LH is confirmed, you're stopped out again.
If one can keep himself from becoming annoyed, and this is far from easy, the next trade, the first short, can work if one can hold onto it and not exit the trade when the next plus one bar heads all the way up to 57. But, if he can't, and tries re-entry on the next short off the retracement, he finally gets the payoff.
All of this seems like a monumental PITA, but if one includes the context, it becomes far simpler. You'll noticed that there is an overnight range, not posted, from 64 to 70 that begins at 0630 and isn't broken until 0830. Knowing that that range is there would most likely prevent the SLAer from any of those longs as he'd be more likely to wait for the "extreme". When he sees price fail at 64, he'd be likely to short the break of the demand line at 61 or 60. This avoids the whole shorting mess described above. Result? One trade, short, at 61 or 60.

-
Many people associate being wrong with being stupid. And no one wants to be stupid hence the resistance to accepting the loss and cuttingit quickly or taking a stop out without the need to prove yourself right again quickly. Traders need to realize that being wrong has nothing to do with how smart you are. You will have losing trades even if your a genious period. If your following your plan and you are consistently losing take a closer look at your plan.
-
Great post. The outcome of your trade has nothing to do with who you are as a person. Neither does the outcome of your trading day. The sooner we BELEIVE this the sooner we can start looking at our methodology ina an objective way and learn to improve each and every day.
-
Steve,
Just curious , about how many trades do you average a day, watching just one market. I found that watching just one market was limiting the opportunity as sometimes the one market is not moving very much or not setting up, while one of the others is providing an opportunity. Has this been a problem for you? Or do you pretty much get some opportunities every day?
-
The way I approach is to to scale out of most of the position as if I was scalping it, 4-10 ticks, and then try and keep a portion on for a larger move. Sometimes I can catch a good one, and if not I don't lose on the last portion, I just get out for a small gain or b/e. If you can get your percentages up, you will find that very quickly you will be at a decent profit for the day. I also tighten the stops as soon as possible to reduce the risk.
-
I monitor 4 markets, with a moving average, pivots, and volume on each. One time frame, but i will usually switch back and forth to a larger time frame to spot s/r levels.
For me monitoring one market made me feel anxious as when i started i could not trade a full day because of work. So by watching different markets I can usually find an opportunity to trade in at least one in the short time I had to watch the market. I have found that the simpler the better, especially when watching more than one market. If your just watching one I think with a bunch of indicators would probably be okay, but not multiples.
-
Do not quit just yet. At this point you are not losing money. I think that you have done the right thing in going to a simulator. Second i think it is also good that you have figured out that you have no written plan and no money management technique. You have found your weakneses. Now what you must work on is two things. First you must write out what is going to get you into the market and what is going to get you out. This does not have to be perfect but it must be detailed enough that there is no second guessing yourself about whether or not you should pull the trigger. Now this could be simple not something fancy. Actually the simpler the better. Now you must firmly beleive that following this entry strategy is THE ONLY WAY to your success. Commit to this for 30 days. Do not worry about making money or if your trades are positive or negative. Just focus on only taking trades that are permitted by your plan that is it. No other trades allowed.
The firstbfew days are the hardest especially if your trades are losers. Do not focus on the money just the process.
Once you get this going start analyzing the losing trades and constantly ask yourself if there is a common theme among the losers. If you observe somethng then write it down and try to adjust. You can adjust your setups but this work has to be done after the close not during the trading day. In time probabaly a few months you will star nitcing little nuances that will help you bring your winning percentages up.
Everything that you have written in your post i have personally experienced and i felt lost and frustrated witout a clue. It was not until i committed myself to only taking predifined trades based on my plan that i started to turn the corner. Now the lsoing days are much fewer than than the winning days
One last thing dont blame yourself for losses. Congtratulate yourself for following the plan. If you lose consistently iys not your fault if you are following the plan, it is your setups. Blame them and then try and fix them. Check out my thread called "i used to blame myself" in the psychology section.
I know this will help you. And let me know how it goes. PM me or just post here.
Make that plan write it out and follow it
Good luck
-
I think one of the reasons most traders lose money is because they don't have a firm belief in the process of what it takes to become successful. They do not test their plan on a simulator before going live. What ends up happening is that after a few losses the trader throws the plan away and starts all over again buying another system or plan. And the cycle repeats after some losers. While this is happening frustration and anger are slowly building up inside as the next system fails them.
The trader needs to learn the system , and test the system analyzing losses to figure out how to improve on the plan. After a few months of positive results the trader can then go at it live with real money with small size. Few people have the discipline to do this, since they want the quick money, and their emotions take over. People get frustrated and angry, a deadly combination in trading.
Think about about why people lose their discipline in trading and do things like, add to losers, revenge trade, or chase the market. The real reason is that they are tying the results to who they are as an individual. When in reality it has nothing to do with who you are, and everything to do with the quality of your setup. You might have a plan or setup and if you have a loser and your thinking starts going negative, and you start saying to yourself, "I am stupid", "I need to get that money back", "This will never work", "I have wasted all these years trying to figure this out". Your emotions take over and you start making mistakes like chasing or adding to losers etc. Which in turn leads to blowing out your account and a huge draw down day. One day of anger can end your trading career.
A trader with just one belief can begin to turn things around rather quickly. What is the key? In my opinion , convince yourself that the only way, the only way, to make this work is to choose a setup or plan, and stick to it for 30 days , no matter what the results are. Re affirm that belief every single day, forget about the results and see what happens. Do it on a simulator. Once you train yourself to do this for thirty days the next thirty days will be easier. I said easier not easy though. And soon you will be thinking about improving your setups and plan, since you will not feel personally responsible for the losses and your emotions will be in check.You will stop blaming yourself and start analyzing the setup for clues as to why it didn't work. Did you follow it exactly as you should have? Or was there a nuance that you notice that makes this particular setup inferior at times. This takes work and patience, but well worth the time and effort. When compared to spinning your wheels, going from system to system, guru to guru without any results.
I can go on and on, but this is getting a bit lengthy. I hope it helps some.
-
A note of sticking to your plan. A while ago I read a book by T Harv Eker, where he talks about this concept that really made sense to me. Basically he states that your beliefs lead to thoughts, and those thoughts lead to feelings, and those feelings lead to actions, which in turn lead to results. When trying to follow your plan, you must absolutely believe that following your plan is the only way to properly evaluate it. You must believe that one trade alone will not determine whether your plan is good or bad. That one or two or three weeks will not be enough. With this belief in mind your thoughts about losing trades will be more positive and you will be able to use the losers in a creative manner to either adjust the setup or toss it. Without this belief you will fall into the trap of , emotional trading once you have one or a few losing trades, throwing the whole plan out the window, and finding yourself asking what happened at the end of the day.
-
Today was a good example of what I am talking about as far as my experience. On my first trade , which was a valid setup, I got stopped out , without having a chance to move my stop , so the stop out was a full one. In the past i would have quickly re-entered the market trying to get back what I lost. This time I put my emotions in check, continued to analyze the market and shortly there after another setup occurred which hit two of three targets. It put me back close to break even for the day. Patiently waiting for the next setup, which took quite a while to appear, I did nothing. Once it happened I took that as well and was able to get back into the black for the day. Everything based on my trading plan. I did feel some negativity about the stop loss early, but I was aware of the feeling and did not allow it to cause me to break my trading plan guidelines. All the while reminding myself that its more important to follow the plan than not to follow the plan, win or lose.
-
Phantom,
I think what you are posting here is great. They way you trade conceptually is very similar to the way I approach the market. I can tell this thread is going to be a good one. I will be following with much interest and am looking forward to it.
Thanks
SRspider
-
biko,
absolutely correct. What matters here is that you follow the plan. Because only by following the plan , can you make it better and more statistically in your favor. By adjusting what needs to be adjusted, if need be. Otherwise, those trades that were taken by not following the rules, will be very difficult to reproduce as you may not know why you took the trade, other than "I felt it was gonna go up" . And most people do not have the intuition to trade successfully that way, not in the beginning years at least.
-
$ , Thank you for the positive remarks.
Market Scientist,
Yes with all that information it is difficult. But what you must do is, take that information when the market is CLOSED and then do your work then. Choose your setups, develop your plan, really detail out the information. Example. The setups need specific criteria for entering and also exiting. Also you need to determine how much size you are going to trade. What markets are you going trade. These are just some of the questions that need to be addressed BEFORE you trade, not DURING. Once you have that you must, must, follow your plan and just take the setups, don't worry about winning or losing. Just focus on taking those setups you defined. Now the result of what happens you must constantly monitor, what setups you took and how they worked out. Can you change the setup to make it better or should you just throw it away and look for others. You do need to give them sometime. 1 week is not enough, you might have to observe the results over 4-6 weeks to really know.
Start with only 2 or 3 , whatever you feel comfortable with. Treat them like they work for you, if they do something wrong try and work with them to make them better , if they are not performing and there is no hope for improvement, you must let them go.
I hope this makes sense.
SRspider
5_8_2015.jpg.32ae6efcf7c54988f32b348c6f0e3000.jpg)
5_7_2015.jpg.45649df955a0069fe6a435e805e54268.jpg)
_TICK(3Min)5_6_2015.jpg.ffe6514bd068ad3f7130f69770cfa683.jpg)
_TICK(3Min)5_6_2015-1.jpg.c732f75b262fa6c3f9b6ee887182d898.jpg)
Off-topic Posts
in The Wyckoff Forum
Posted
Some Observations today. I see we broke through the hinge that was forming and then retraced back which looked like an opportunity to possibly short. An we are near a SL on the Daily Chart.