
Welcome to the new Traders Laboratory! Please bear with us as we finish the migration over the next few days. If you find any issues, want to leave feedback, get in touch with us, or offer suggestions please post to the Support forum here.


justlurkin
-
Content Count
54 -
Joined
-
Last visited
Posts posted by justlurkin
-
-
Okay here it is... in a standard indicator in the Market Delta Software. Results directly mimic those of the one I was duplicating, with less noise. Although I have a feeling it will be attacked by the original creator (Which I can understand, after having attracted so much forum attention with it)
Results speak for themselves.


become,
For non-I/RT users it seems that this would simply be ( (TotalTicks * TotalTicks) / Bar Time in Seconds ) according to Investor/RT Tour - Volume Breakdown (VB)
However, I don't see results anywhere near UBs indicator.
Tooker,
Can you post a pic of todays action with the indicator. I'm going to have to run replay over the weekend to post a pic.
ps: TotalTicks = Total Trades (not volume) for the current bar (1000 Volume in this case)
-
Very cool. Just fyi I never liked it as much on a min chart. The candles are typically too long that's why I use it with a range bar or volume chart. Why do you think it's buggy?Yeah, volume chart is much better in this case. The bug is related to scrolling. When scrolling left to view previous data the indicators fire an overflow error and disappear. This is usually the sign of a minor oversight, will check into it.
It seems the indicator is nothing more then 50% retrace level using scalper peaks/troughs. The additional smoothing introduces a little lag but removes jumps caused by minor peaks/troughs. How would you use this trading something like the YM?
-
This looks more in line with your description, although still buggy ...
-
I think this makes more sense now. The previous code averaged all points between swing high/lows since it uses a dataseries. This means, that if there are 4 swing points across 100 bars, the midpoint series would be 100 bars wide and an average using, for example, a length of 4 would average the last 4 points and tack it on. However, it seems that you are looking for average of 4 midpoints only, regardless of the number of bars, making the actual dataseries of midpoints much shorter and out of sync with the bars series, an array or list perhaps. This would get you a flat line between swing paints. This probably sounds incoherent but I'll look into it, seems simple enough.
This implies that the following are not equivalent:
Tradestation:
theavg = average((( s_low + s_high) /2 ), len);
Ninja:
Midpoints.Set((s_low + s_high)/2.0);
theavg = SMA(Midpoints, pLen)[0];
The Tradestation version is adding to "theavg" only when a new swing is detected.
The Ninja version is adding a point on every bar, hence the extreme smoothing.
At least this is my assumption.
-
maybe someone can chime in and clarify how this statement works in Tradestation:
theavg = average((( s_low + s_high) /2 ), len);
I would assume that average requires a series as input. So what happens when s_low + s_high) /2 is inserted instead? Is this truly equivalent to the following ninja statement:
Midpoints.Set((s_low + s_high)/2.0);
theavg = SMA(Midpoints, pLen)[0];
-
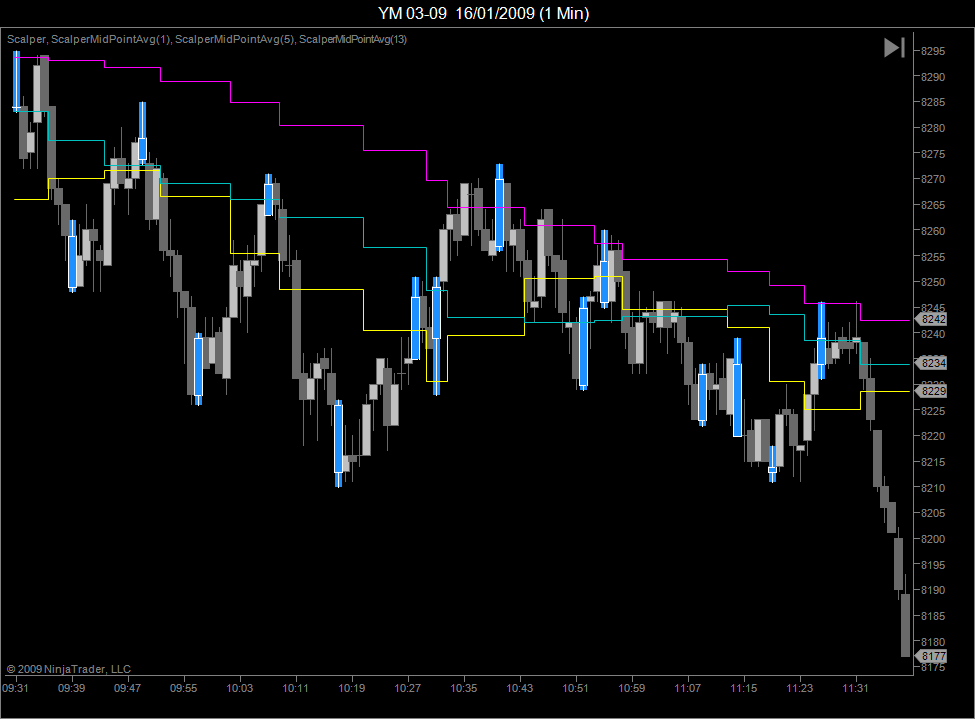
Here's a good example. The cyan line is a 4 length and the yellow is a 11 length. In the box the scalper code fires a cyan bar, both averages make a step down when that cyan bar appears 2 bars later. Then a magenta bar fires and the average reacts a few bars later. But as you can see cyan line makes it back to price faster and the yellow becomes resistance. This is only one scenario but there's many possible. But as you can see the longer length line doesn't smooth like my new Ninja version.I see. The image is much clearer. I can assume that the period is also being used in the swing function within Ninja, but I'll investigate.
-
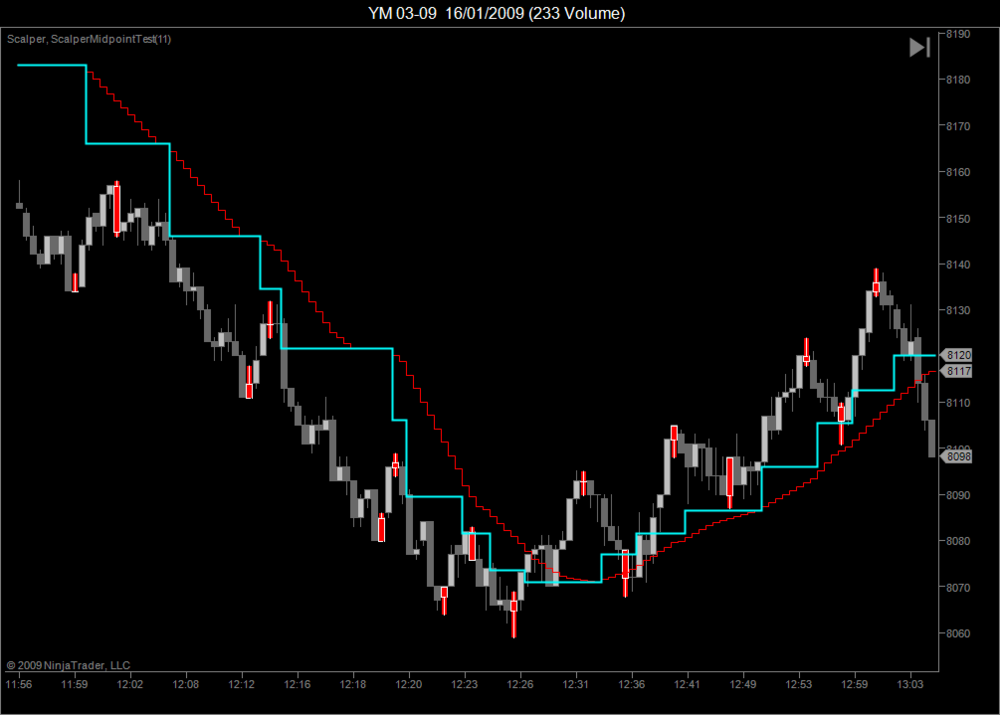
And here's one with the 11 period smoothed version.
-
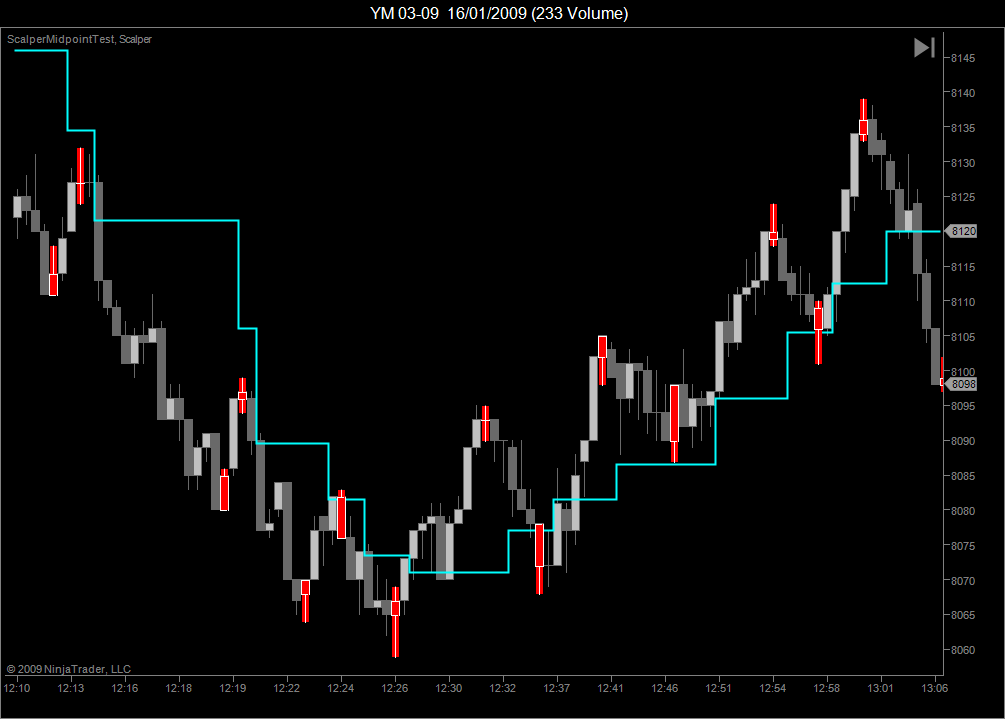
here's an image of actual scalper peaks and troughs. From that the midpoint is calculated and plotted (No smoothing is done). Changes in the midpoint are done at the time a peak/trough is detected. While scalper paints in the past based on the confriming bar, the midpoint paints at the time of the confirming bar. Does this look closer to what you had intended?

-
A couple of things. The code does not use ttm scalper code to define swing highs and lows. It uses Ninja's built in Swing indicator which is not the same thing. The square line is also not just a simple average of the swings as there are points in between which I can't figure out. Some more details would be nice. The code seems to be averaging using a user length on a series called midpoints. Midpoints of swing high and lows is straightforward, but what is used in between? if I had more patience I would decipher the code but I'd rather know a description of that line from you and see what I can do from there.
-
Not quite sure what you want here. Can you explain the indicator in plain english step by step?
-
Analysis of volume is best done "on the job" sitting next to someone who knows what to point out to you...Absent that I suggest you look for tools that will allow you to see how volume fluctuates at critical points in a chart. If there is interest I can point out some of these tools later.....Would like to hear more on the tools used to decipher volume. I have noticed on the YM 1 minute a good 2 bar reversal can be consistently seen if:
(for tops) bar 1 is an up bar with a tail at the High along with exhaustion volume peak and bar 2 is a down bar with much less volume. This can be seen over and over again. The reverse holds true for bottoms. I usually tend to enter on pullbacks but this theory doesn't seem to work for pulllbacks so I second guess the trades. In an uptrend, once an exhaustion peak is observed, a simple pullback could follow and then take off....
Just my observation...
-
Wish me luck! Can have up to 500 ct's out there & I am going for broke. Going to pyramid into a position and let it ride.Hopefully will teach the kids what not to do.

Awww. Forget the kids man! Teach me. Me me me me.:missy:
Good luck.
-
You have choicesYou can enter "at the market" on the re-test (I do this all the time) or you can wait for that doji (pin) formation and enter on the open of the next candle (again using a "marketable" order). I use "marketable" orders about half the time. I don't really care what the slippage is, because I am in the trade for 10 points (or more). After all these years, I pretty much know when I have a good entry point and I just want to get filled.
If you decide to wait for the open of the next candle (after the re-test) you have less desirable trade position, and frankly just a much chance of getting stopped out (in my opinion). There is a lot of nuance to the entry, for instance, if you take a moment to look carefully you may see that in some instances the 80 period ema penetrates the 200ema just prior to the signal (you would probably want to use a limit order there). If you wait for this feature to occur, you get fewer but more reliable signals. One thing for certain, you are going to get stopped out periodically, thats just how the game goes.
Hope this helps
Steve
I see your point with the 200 ema being powerful turning points but I don't know if I could pull the trigger in real time without quite understanding why this happens (any reasoning appreciated). I read over at ET you used a WMA. Is ther any specific preference to EMA over WMA?
Having said this, perusing over the last few weeks' charts, I would feel comfortable fading the 200ema if there has been at least one test and failure to break during the day. i.e. take the second retest with much more confidence. Is there any merit to this method in your experience? Would I miss too many good moves?
Jumping in right at the EMA, although scary also would require a valid stop loss. I see that for ES you use a 2 pt stop based on the current volatility. Is it safe to assume that for other products a similar volatility based stop is also valid? Would the first scale out have to be at entry + Volatility in order to get the correct R&R?
thanks
-
Hi Dave,Something I do, is to normalize the volume and then X% above the norm is a volume spike. If you would like more clarification, I can post you my neoticker code for it.
All my best,
MK
Please do MK, I'd like throw that into Ninja.....
thanks
-
Steve.
Could you elaborate on entry on test of EMA method. Do you just enter a limit order and hope not to catch a falling knife or is there something more to look at for confirmation (bar pattern, shorter ma, etc.)
thanks
-
Can anyone post a screenshot of what this indicator looks like. I'd like to see if its worth the port to Ninja.
thanks
-
FWIW, my 2 cents:
I've traded FX with IB in the past with no reasons at all to complain. Spreads are tightest I've seen on most popular pairs because they have a flat fee (i.e. their commission is transparent and not hidden in the spread). Also a 1 lot transaction (Volume = 1) represents 100000 units of the base currency in any pair. (EURUSD = 100000USD). I've used MT4 as a platform but executed all my trades through FXTrader (IB tool) and I always immediately got better fiils commission included.
-
davem1979
Here is my quick hack at it. Seems simple enough. I've added the possibility of setting a period in the indicator in case you want to experiment with extending the Volume lookback. In its default state, it should be identical to yours. attached is a pic of the indicator on YM 1 min timframe although not sure how you would use it for entries/exits. I've also noticed that if the current bar is a doji you have to be careful before jumping in. Personally, I am looking to find a way specifically to enter on a breakout from pullbacks.
Here is the OnBarUpdate routine for Ninja (attached is the full zip)
protected override void OnBarUpdate() { // Use this method for calculating your indicator values. Assign a value to each // plot below by replacing 'Close[0]' with your own formula. //HIGH VOLUME SPIKE LONG SIGNAL if (CurrentBar > period) { if ( (Low[0]<=Low[1]) && (Low[0]<=Low[2]) && (Close[0]>=Close[1]) && (Close[0]>=Open[0]) && (Close[0]-Open[0])<(High[0]-Low[0]) && //(Volume[1]>Volume[2]) && (Volume[1]>Volume[3]) && (Volume[1]>Volume[4]) && (Volume[1]>Volume[5]) && (Volume[1]>Volume[6]) ) (Volume[1]>MAX(Volume,period)[2]) ) { BackColor = Color.Green; //Spike.Set(1); } if ( (Low[0]>=Low[1]) && (Low[0]<=Low[2]) && (Close[0]>=Close[1]) && (Close[0]>=Open[0]) && ((Close[0]-Open[0])<(High[0]-Low[0])) && //(Volume[1]>Volume[2]) && (Volume[1]>Volume[3]) && (Volume[1]>Volume[4]) && (Volume[1]>Volume[5]) && (Volume[1]>Volume[6]) ) (Volume[1]>MAX(Volume,period)[2]) ) { BackColor = Color.Lime; //Spike.Set(1); } //HIGH VOLUME SPIKE SHORT SIGNAL if( (High[0]>=High[1]) && (High[0]>=High[2]) && (Close[0]<=Close[1]) && (Close[0]<=Open[0]) && ((Open[0]-Close[0])<(High[0]-Low[0])) && //(Volume[1]>Volume[2]) && (Volume[1]>Volume[3]) && (Volume[1]>Volume[4]) && (Volume[1]>Volume[5]) && (Volume[1]>Volume[6]) ) (Volume[1]>MAX(Volume,period)[2]) ) { BackColor = Color.Crimson; //Spike.Set(-1); } if( (High[0]<=High[1]) && (High[0]>=High[2]) && (Close[0]<=Close[1]) && (Close[0]<=Open[0]) && ((Open[0]-Close[0])<(High[0]-Low[0])) && //(Volume[1]>Volume[2]) && (Volume[1]>Volume[3]) && (Volume[1]>Volume[4]) && (Volume[1]>Volume[5]) && (Volume[1]>Volume[6]) ) (Volume[1]>MAX(Volume,period)[2]) ) { BackColor = Color.Red; //Spike.Set(-1); } } }.thumb.png.622653bbd05741d2a376a92a9098820a.png)
-
For computation of mode, mean or median of the volume distribution function you need to keep an array with volume at each price.Such an array needs to have exactly that number of elements as how many different prices are there in evaluated period (in this case in one day). So if tick size is 0.25 and current daily range is 10 you need to maintain an array of 41 elements. You dont need to care about concrete trades.
To calculate median of such an array you need to order its elements by size and find the middle one in this sequence. If there is an even number of them you can take any number between and including the middle two. Search Wikipedia for median.
Ahh, the missing link being sort by size and not by price. I knew there was a simpler way, just couldn't get my head around it. So effectively it is the middle value of the volume numbers in a sorted list. Once found, the price at that volume is noted. I kept thinking of median in terms of price. Thanks.
-
This would be correct only if the number of trades at each price were identical, which is usually not the case. To determine the median, you have to order all the trades from low to high, add up the total number, then find the price where the half way point is located.Example: 1,2,2,2,2,2,3,4,5. There are nine trades between 1 and 5. Half way point is 2, not 3.
I was afraid of that, but just to make sure, a contract that trades 100000 units and for example each trade was 10000 units at each price point. Then the Median would be (price range $1 - $10) the middle value of 1,1,1,1...(10000 times),2,2,2,....(10000times), .........,10,10,10,10 (10000 times)?
this example is easy since all volumes are identical but when each volume at price is different, the list gets huge if I have this correct?
thanks
-
In http://en.wikipedia.org/wiki/Skewness there are two calculations as a measure of skewness suggested by Pearson :(mean - mode) / standard deviation
3 (mean - median) / standard deviation
the first one is using with PVP I was using till now, the second approximation is using the median instead of PVP. I switch the calculation using median and seems it provides similar qualities as the 3CM method. The Skew does not change abruptly as PVP change but change gradually along the day, this provides a nice head up when PVP is about to jump, the skew slope is a good proxy for the market direction and in some cases provides nice heads up that a change is on the way.
The attached picture is yesterday ES action, in the first pane the purple line around VWAP (blue) is VWAP+Skew*SD, The yellow is PVP, the second pane displays the actual skew
Karish.
I'm trying to plot this in C#. Is there a simple way of calculating the median of the price distribution? I'm thinking of creating a list double that will insert each price point repetitively until all volume is accounted for, and then sort and figure out the median. This seems tedious, is there a simpler way?
thanks
-
Can you also post the text version as I don't use TradeStation but should be able to read the code.
thanks
-
apply to a prop shop in Canada, no credentials required. Trade remote.Northern Boy, this seems interesting. Would you have a list of decent prop shops in Canada. I'd like to research them myself...
thank you
-
Oh yeah, just remebered. You can hook up TradeStation Feed to Ninja!

.png.60fd1bb404356016b025c2410578c3b5.png)
Backup Power Supply
in Tools of the Trade
Posted
I use APC Back-UPS XS 1200 Model BX1200. Never had an issue and would definitley buy it again.