
Welcome to the new Traders Laboratory! Please bear with us as we finish the migration over the next few days. If you find any issues, want to leave feedback, get in touch with us, or offer suggestions please post to the Support forum here.


gassah
-
Content Count
316 -
Joined
-
Last visited
Posts posted by gassah
-
-
I think I've read everything Wyckoff has put out. Of the Wyckoff material I only read the original course annually.
-
Apparently Wyckoff came up with what is SMI's Force and Momentum indicators but called them by something else (I can't remember what). Bob Evans added the Technometer and OP Index. I don't see a similarity with the OP and OBV. The OP, and all the other SMI indicators, break the intraday chart into 5m swings and tally the up and down swing volumes. Using EOD volume, as OBV does, isn't similar, IMO.
-

He says there is no indication of big distribution. Is this because the volume on this climax is lower, relative to the previous selling climax in mid December?
The one bar on the 9th isn't enough to say there is significant distribution. He states that the preceding days are more likely a lessening of demand at the top of a rally, which doesn't concern him too much.
If he sees a corrective reaction in the future, why not close the long trade now, and either go short, or buy more at the bottom of the reaction? He says to hold onto the long position, even though he expects a pullback..Because he isn't looking to only trade the swings. He wants to hold through reactions trying to capture the larger moves, and unless there are signs of significant distribution he will hold.
-
How does he conclude that the supply is now exhausted? How can he be sure that on the next bar, selling re-commences? And how does he say that the demand is good quality, while the supply is poor?[/b]
Wyckoff is talking in probabilities. He isn't concluding at the moment of the SC bar that it is, in fact, a SC. As he states, he needs more evidence. Given the background decline and the heavy volume and bar he believes that odds favor the probability of a climax and suggests buying only if you see the demand intraday. If selling re-commences then the buying was only temporary, but you can't know this in advance.
But why can't it be viewed that this huge volume spike was the last of the support buyers being taken out, and that the move will continue downward?Following an extensive decline it's far more likely that sellers are exhausted. In general, buyers are exhausted after a prolonged advance. The context of the bars has to be taken into consideration.
-
Hi Mikew,
I'll have more to say later but I'll post this chart of the DJIA from the same period to provide a broader perspective of that selling climax.
gassah
-
I'll try again. I asked Ray for assistance because sideways vs. corrective was throwing me a loop. Here's his response:
A sideways correction is one form of a complex correction.
Your question raises two issues:
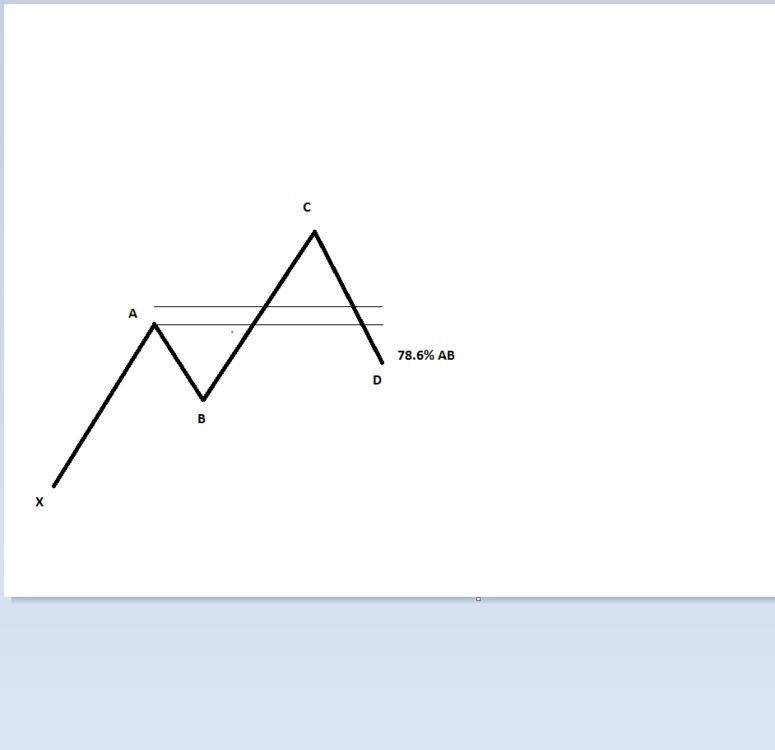
1) when do we relabel a new extreme as being part of sideways structure? A: when the market retraces at least 78.6% of the boundaries of congestion.
2) when the market creates a new extreme (in your case when the market goes above (A) and returns to congestion, at what point do we say the BC leg is corrective and not impulsive? A: when the market accepts beyond the Primary Zone.
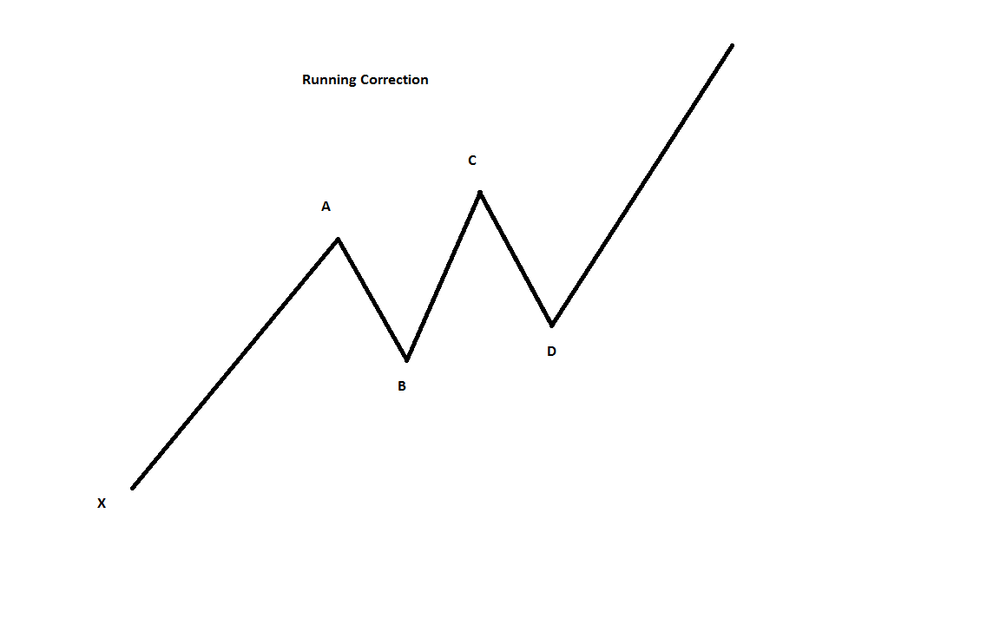
Note that the two conditions are not mutually exclusive - e.g. you can accept below the Primary Sell Zone (D) without reaching the 78.6% retracement. This would make the structure a Running Correction rather than an extended SW structure.
Hope this helps
ray
-
I replied last week but I don't see the response now. Did I not? I stopped drinking a few weeks ago.
-
Hi Rob:Yes, I am interested to know about running corrections. I saw this term in Ray's Blog, but could not find in the book. Thought I slept through a chapter....

How do we go about doing the explanation from Ray's webinar?
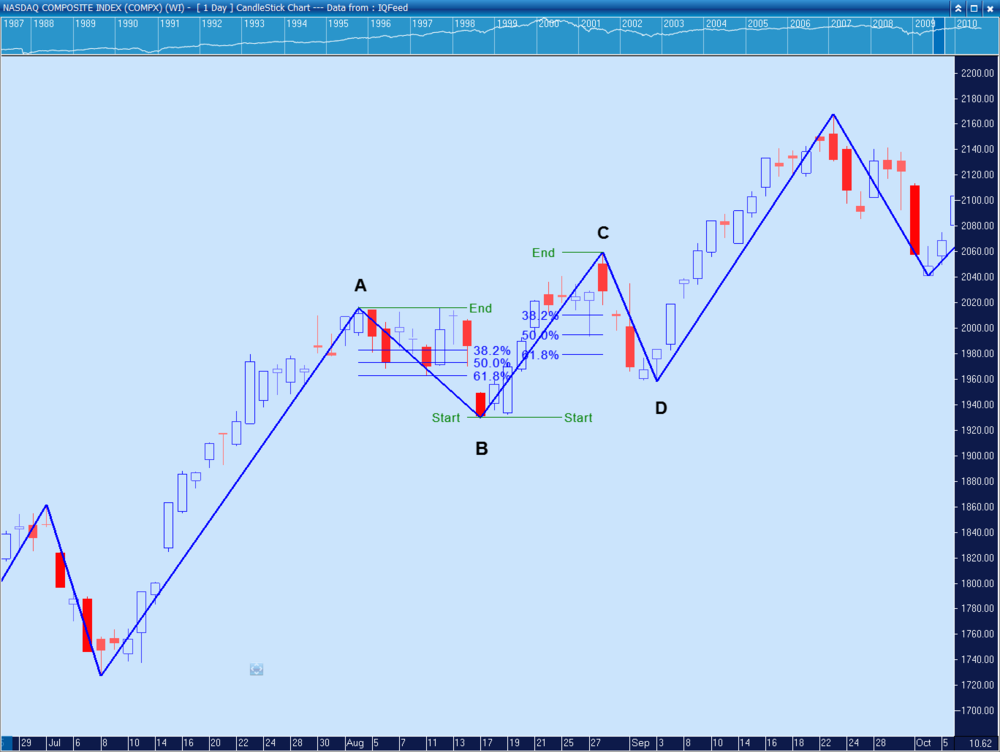
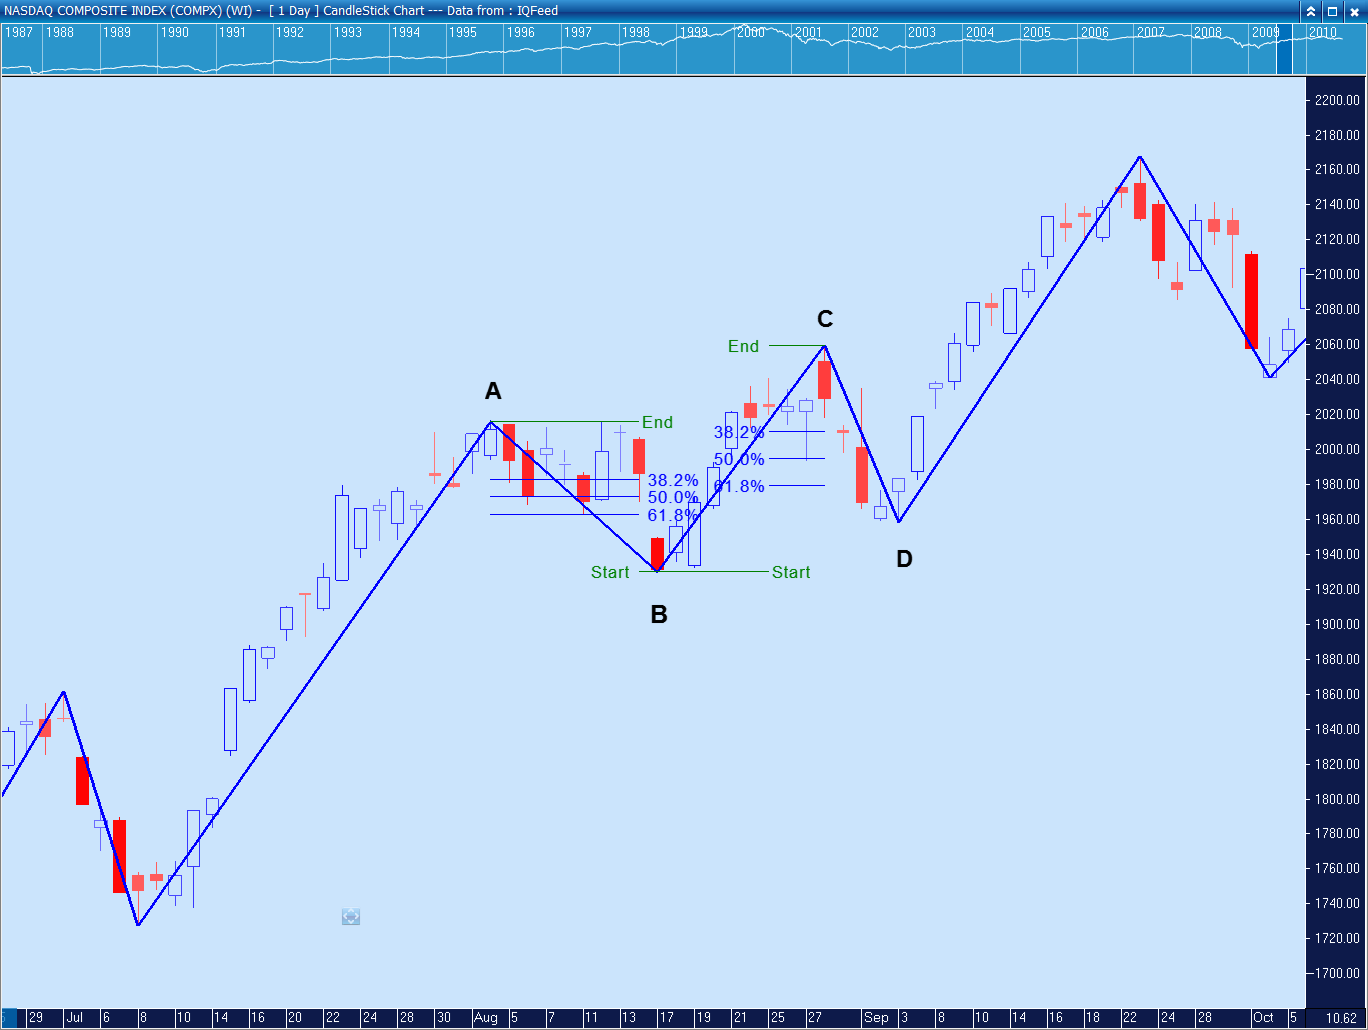
I’m using the Nasdaq 8/09 as an example. Take the 38.2, 50, 61.8% fibos between AB and BC. Look for where there’s a confluence of zones. In this case I erased the top 38.2 and 50%. Take the lower 61.8% and change it to 67%. After you buy a bull bar off these levels place the stop below the 67%.
The RC can be thought of as a sideways correction that is too strong to make it closer to B and should lead to a strong impulse move. It’s stronger than a single line, zig-zag or sideways correction, and not as strong as an irregular correction or R0.

-
Do you have a link to his webinar? Do you need to pay for it?
The webinar is over a year old now and about 20 sessions. He might offer a discount. I'd ask his assistant Kwok @ oikwok@gmail.com.
Rob
-
Is there a difference if it comes down to D at 78.6% of BC instead of 78.6% of AB?
I need to make a correction. CD does not need to come down to 78.6% of AB in order to label it a sideways market and to make changes to the ME. All it has to do is have a one bar acceptance below the PSZ of AB (like an upthrust). If it turns up to challenge C then I'd change the boundaries from AB to BC. It doesn't matter how it goes up. What I said about changing the boundaries if it continues lower still applies.
If it comes down to 78.6% of BC but stays above the PSZ of AB then you just have a continuation of the uptrend. The BC measurement does come into play with running corrections and R0 patterns. I don't think running corrections are in the book. I can try to explain them from Ray's webinar if you are interested.
-
I'll address the first chart with different labeling. If it comes down to D at 78.6% AB and turns up and you want to see how price behaves around the PSZ and upper ME then I would change the boundaries to BC. If, instead, it continues down toward B then I wouldn't change it yet because you want to use the old PBZ and lower ME. If it then comes back up above the PBZ then I would change it to BC at that point.
-
I have some questions regarding the relabelling of XAB.
I have attached 2 jpegs for my question.
Referring to pic1.jpg, first I label XAB. Then a higher high form at C with acceptance above ME. If the market retraces such that the price is
- below A but at or above D, how should I re-label XAB?
- below D but above B, how should I re-label XAB?
Referring to pic2.jpg, first I label XAB. Then market consolidates and is followed by a breakout with WPC above ME at C. If the market retraces such that the price is
- below A but at or above D, how should I re-label XAB?
- below D but above B, how should I re-label XAB?
Hi dandelion,
I don't make a distinction between the two charts. Once a swing accepts below the PSZ of AB it continues to be considered a corrective structure. I wouldn't label either one D until it hits the 78.6%R, though I'm not absolutely certain Ray would agree.
Rob
-
I find it easier keeping the labels as consistent as possible and using 345 as XAB. The other labeling Ray used is more of an anomaly. As long as you know 7 is springing 5 you're fine.
-
In addition, Ray's labeling the counter-trend reaction with XABC and using AB to generate the ME. C cannot accept beyond the ME if a spring is going to occur.
For the upside 5d breakout you'll have to re-label and in this case use the XA or XC as the boundaries which move the ME back above X.
-
Ray might have used the labeling you mention to identify the PBZ for the spring. He'll use the latest inside swings for this purpose.
-
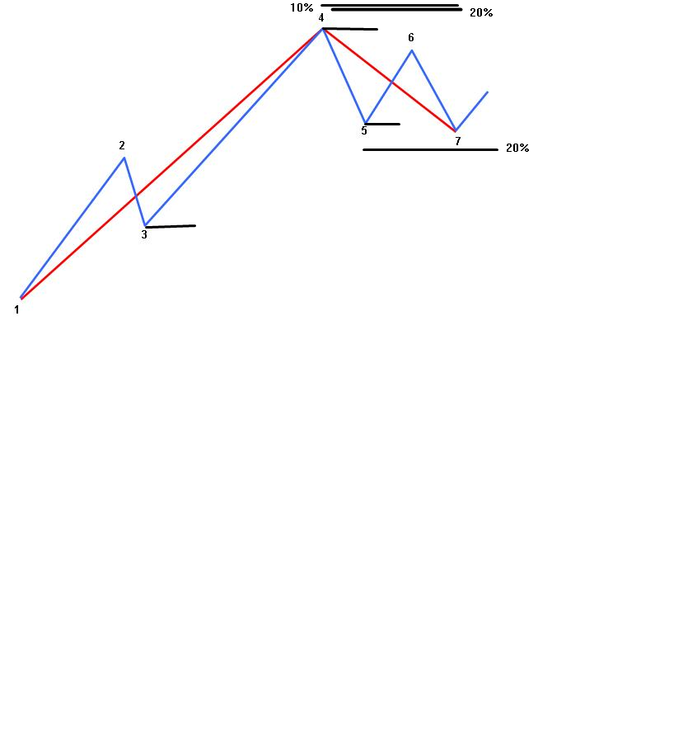
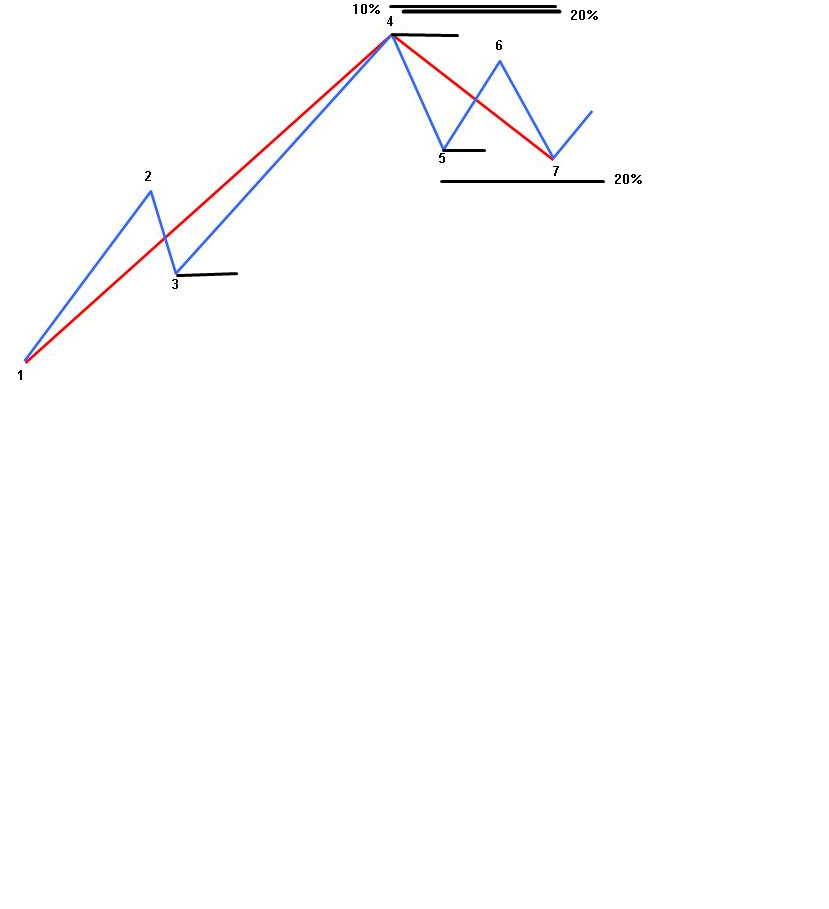
The opposing boundary always uses 20% AB. 10% XA is only in the direction of the trend. I'm pretty certain of this, unless you can point out where it says otherwise. Thanks.
-
I'd use 4 and 5 as A and B in the second example.
I'm assuming you are looking at the 5d swings only. In example 3, 7-8 are AB. 4 to 9 is a downtrend, not congestion, because 8 did not retrace above the PBZ of 5-6. Therefore 7-8-9 is its own entity and the ME is 20% of 7-8. You can also use 10% of 6-7 if its impulse mean but it might not be. If it isn't then move back to 10% of 4-7.
-
Hi,
The upper boundary is either 10% of 3-4 or 20% of 4-5, whichever is greater, assuming 3-4 is at least impulse mean.
The bottom boundary doesn't use 3-4, i.e., you don't take 20% of 3-4 and apply it at the bottom boundary. In this case 4-5 marks the boundary of congestion because 7 hasn't retraced far enough back into the range to count as a point to consider.
I'll address the rest later.
-
This question is related to Ray's description about R0 subnormal on page 19 of the NOT book. Ray said:
For example, in an 18-day up-move, the 18-day impulse move will be below mean and the 5-day impulse moves will be less than average. (An 18-day impulse move is usually comprised of more than one 5-day impulse move). In Figure 1.17, we have an 18-day impulse move commencing October 10, 2002 and ending on December 2, 2002. After the 5-d line turned down, we find that the impulse move is below average. Were there any moves that indicated this may be so before the 5-d turned down? The first 5-d move -- from October 10, 2002 to October 28, 2002 -- is mean. However, the two succeeding 5-day moves are below average, giving us a clue that the 5-day impulse move will also be below average.
I also find the R0 section difficult to decipher and Ray has acknowledged it is the worst written part of the book. I wish he'd come out with another edition. I've edited the quote to something I think makes more sense.
Here's some more infomation taken from one of his webinars:
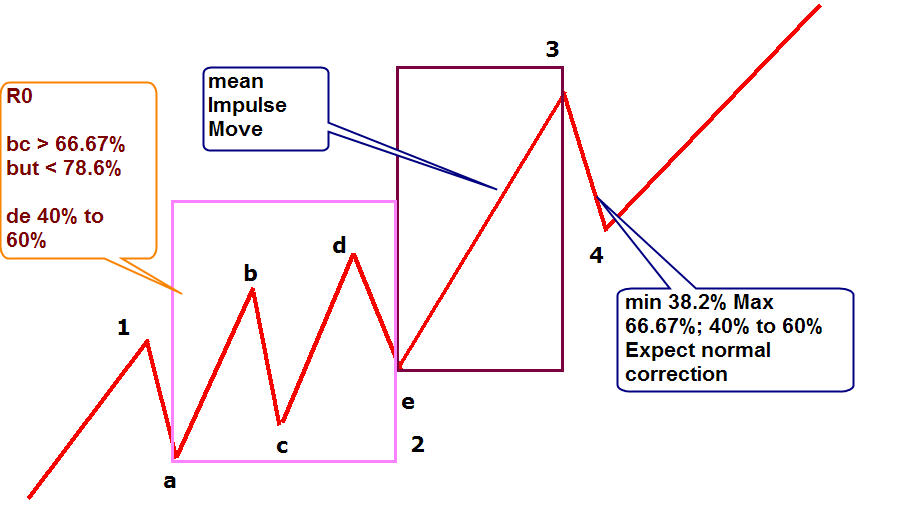
R0 CONDITIONS
(Assume a new uptrend)
1. Takes place usually as a Wave 2; if it takes place after the trend has been an existence for some time. then it is a 50-50 bet it will be a failed move and hence a CIT; or the correction signals that the impulse to follow will be the ultimate high of this time frame.
2. Wave 1 is below normal (i.e. less than mean -1/2)
3. Wave 2 is a deep correction greater than 67% retracement of Wave 1.
4. Wave 3 breaks above high of Wave 1 (may or may not form a WPC).
5. Wave 4 is a deep correction greater than 67% retracement of Wave 3. Sometimes this marks the end of the R0. If not
6. Wave 5 breaks above Wave-3 high (may or may not form a WPC).
7. Wave 6 usually corrects 40% to 60% of Wave 5.
8. When R0 completes the corrective structure we should see strong legs up.
9. The breakout above wave 5 high is usually a Wide Range Breakout Bar.
10. A 6-wave R0 is an exception to my rules to trade responsively. I will take a WRB breakout without a WPC.
11. If a 6-wave up R0 fails expect strong downside continuation.
In addition:
The strength of an impulse move is related to its correction - from weakest to strongest impulse move: Single line, 3 wave zig-zag, Sideways, Running, Irregular, R0.
-
Yes, BC is corrective. BTW, this info is very important for stats calculations.
-
Hi,
Is there any reason why the type of B-C in the second chart is not mentioned:question:
BB-C isn't mentioned because there isn't anything special about it. It's just a normal correction. I used the chart you posted.
Are BB-C, C-D and D-E corrective:question:Yes.
This question is related to Ray's description about R0 subnormal on page 19 of the NOT book. Ray said:For example, in a 5-day up-move, the 18-day impulse move will be below mean and the 5-day impulse move will be less than average. (A 5-day impulse move usually comprises more than one 5-day impulse move.) In Figure 1.17, we have a 5-day impulse move commencing October 10,2002 and ending on December 2,2002. After the 5-day line turned down, we find that the impulse move is below average. Were there any moves that indicated this may be so before the 5-day turned down? The first 5-day move -- from October 10, 2002 to October 28, 2002 -- is mean. However, the two succeeding 5-day moves are below average, giving us a clue that the 5-day impulse move will also be below average.
There is repeated mentions of 5-day which confuses me. Are the underlined words meant to be 18-day instead:question:
I'll have to take a look at the book tonight.
-
Ray makes a distinction between springs in uptrends (continuation) and springs that occur as reversal patterns. A repo is borrowed from Joseph Hart's Trend Dynamics and stands for reverse potential, and they are the continuation springs. The reversal springs happen after a prolonged downtrend.
""So in an uptrend, the continuation patterns occur at the bottom and the CIT pattern occurs at the top."
I believe he means the continuation springs are by definition at the bottom of the range and the CIT pattern in an uptrend or upthrust, occur at the top of the range.
Another interpretation is that continuation springs are more likely to happen early in an uptrend, early in the mark-up phase, and CIT patterns (upthrusts) occur after a prolonged mark-up and distribution (the top).
This point about only looking for CIT patterns after a prolonged trend is important. Apparent CIT patterns are much more likely to fail, with the trend continuing, if the trend is immature. This is why shorting upthrusts too early in a trend is not a good idea.
-
Right, just use the regular trading hours.
-
For active 24 hour markets then it's the daily (1440m), 290m, 60m,15m. If you're only going to trade the Dow during US market hours then it's still daily, 80m, 15m. I'm assuming the overnight Dow futures aren't that liquid but I don't know.
Rob


Trading The Wyckoff Way
in The Wyckoff Forum
Posted
Try this: The business of trading in stocks - Google eBookstore