
Welcome to the new Traders Laboratory! Please bear with us as we finish the migration over the next few days. If you find any issues, want to leave feedback, get in touch with us, or offer suggestions please post to the Support forum here.

tawe trader
-
Content Count
147 -
Joined
-
Last visited
Posts posted by tawe trader
-
-
So, would the VSA indicator be available in NT or ProRealTime code?I ve seen bits and pieces al over the Internet, but since there is a firm discussion going on over here I was hoping to find some latest developments.
Hi Dutchy,
I have read pretty much all of the VSA posts here and I can't remember anyone talking about VSA indicator code for NT or ProRealTime, sorry.
Tawe
-
Sleepy,
You could also wait for a clear break of the ND low before entering. ie let the mkt activate your short entry. It's not a 100% guarantee of success but it you have kept you out of this losing trade.
Also, similar to what Eiger mentioned, the longer a decline (or rally) goes on the higher the risk in taking a no demand. The best risk v's reward ND's are after a top and a sign of weakness.
We have also recently discussed seeing ND's in the wrong place on this thread and I think the conclusion we came to, was that best option is to kind of ignore them.
Have a look back at the posts regarding this VSA topic, starting with Tasuki on post #2092 page 210.
Regards
Tawe
-
......NT or ProRealTime codeDutchy, I'm not sure by what you mean by NT and ProrealTime code for what ?
Regards
Tawe
-
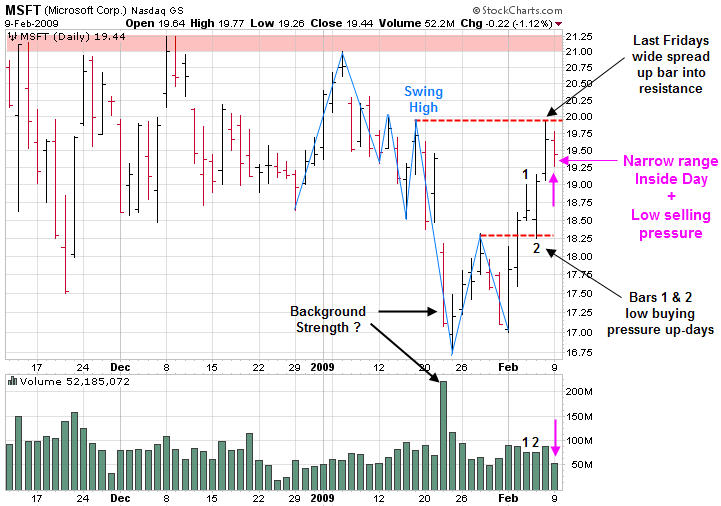
Microsoft update - daily chart
It's been a couple of days since I lasted posted a chart, as you know, MSFT and the Nasdaq have been acting pretty bullishly.
MSFT is coming up to an area ($21 - highlighted in pink on the chart) that Eiger mentioned that may prove a tough nut to crack.
The stock nearly got as high as the $20 mark last Friday but found some resistance from a previous high. Looking at yesterday we have an interesting bar. Does the mkt have a breather before rallying on up, or are we going to pullback to the lows ???
I have made some notes on the chart.
Tawe
-
This looks like an uphill climb to me.Eiger, thanks for your multiple timeframe analysis. I tend to agree that it also looks a tall order for the bulls.
You will see that William Gates III sold shares from MFSTCheers wunderlich for this info ........ fancy Bill Gates selling some shares near to a multi-year low !!!
I have updated the daily MSFT chart with my current point of view and again any and all comments are very welcome.
-
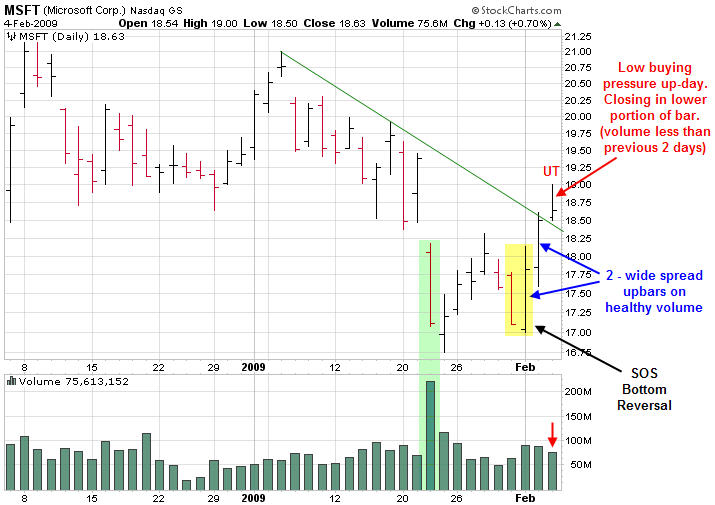
Microsoft update - daily chart
Well I never planned to do a regular MSFT update but seeing as it's a mkt bellweather stock and there is some interest in it, on this thread, I'll carry on, unless someone else would like to chip in.
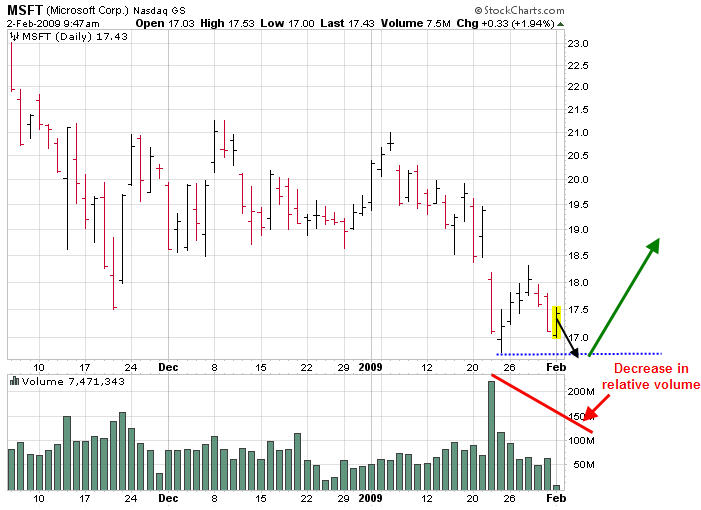
MSFT didn't drop down to the 16.75 level but it did go as low the 17'ish area, which was the low of the ultra high volume wide spread down-bar. On the return to this 17'ish area the relative volume was a lot less than 6 days earlier.
We have now had 2 up days on higher volume than the previous 2 down days, which can be seen as possibly bullish. Also it's broken and closed above the point #2, so we have our 1-2-3 bottom in place and it has also closed right on the descending upper channel line.
It is looking fairly bullish but it now needs to try and hold this level without giving too much back and any retracement needs to be on low volume if we are to see any sort of reasonable bull run.
Any thoughts anyone ?
BTW, I had tried to post this about 3 hrs ago but there was attachment problems on the TLab website, which thankfully are fixed now

-
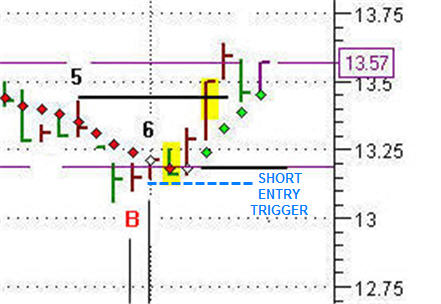
Taz,
What I mean by a multi-day test is nothing really new and ground breaking. It's just that if we are looking for a possible long trade in MSFT then maybe the next time prices return to the lows, down into the ultra high volume area, then over a range of bars (instead of the typical VSA one/two bar test) we need to see relatively lower volume.
I have attached a possible future scenerio for MSFT.
After knowing about double bottoms and triple bottom for years, it wasn't until I learnt about VSA that I understood why they happened ie a double-bottom is formed after a successful re-test of the lows but if this fails because there is still supply in the mkt, the mkt returns back to the lows again. If this is successful then we see a triple bottom.
Obviously for double and triple bottoms to be successful there must have been professional accumulation by the big players as prices declined.
-
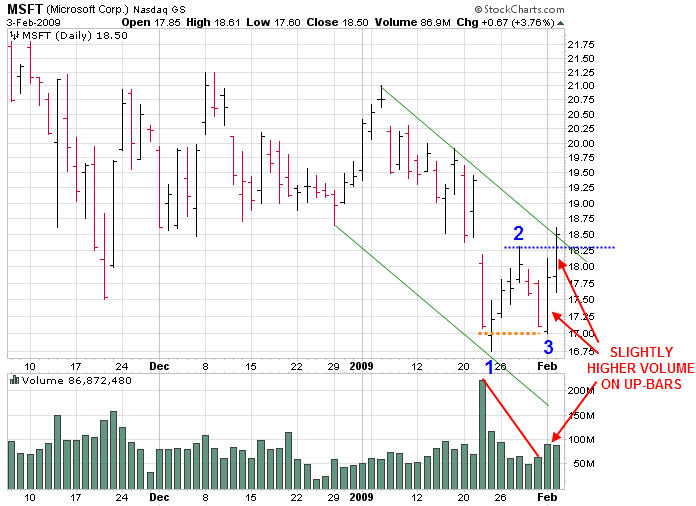
Brilliant, tawe. So, what sort of confirmation would you like to see to make MSFT a longterm buy (we are at multiyear lows)? A test, right?I think for trading the long side with Microsoft there are perhaps a couple of things to look for.
1. Individual bars showing a confirmed VSA test / no supply, or
2. The volume (over a range of bars) of a possible down-leg back into the previous area of ultra high volume ...... a multi-day test, so to speak.
3. If this retracement is on lower volume and the stock turns back up, then maybe a confirmed 'test in a rising mkt' could be an entry point.
I think it's a case of watching MSFT on a daily basis and seeing how things unfold.
If there is a successful re-test of the ultra high volume multi-year low, then a good old fashioned 1-2-3 bottom (breakout above point #2 ..... say 18.3) would also be a possible entry.
-
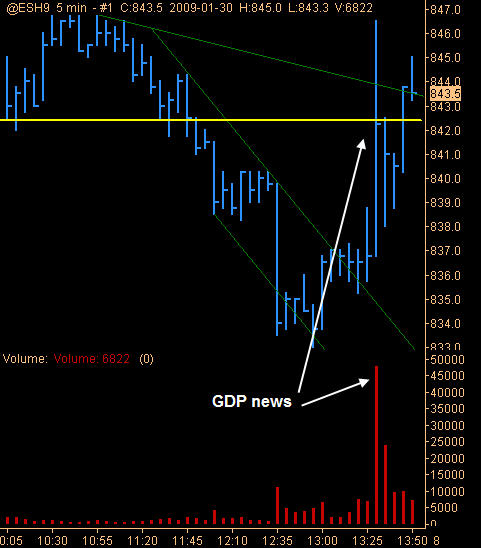
Some fairly predictable ES action thus far today, prior to US GDP news. The mkt was down nearly 10 pts from yesterdays close and around an hour before the news was due there was some pretty big pre-mkt volume.
The 'talk' on Bloomberg and CNBC websites this morning was that the GDP figures were going to be the worst for over 25 years ......... surprise, surprise the news was better than expected and the mkt jumped.
Now I wonder if the market taken down so the so-called smart money can load up long on some ES contracts and make a quick buck ?????
The charts tell the full story.
Tawe


-
Yes Tasuki,
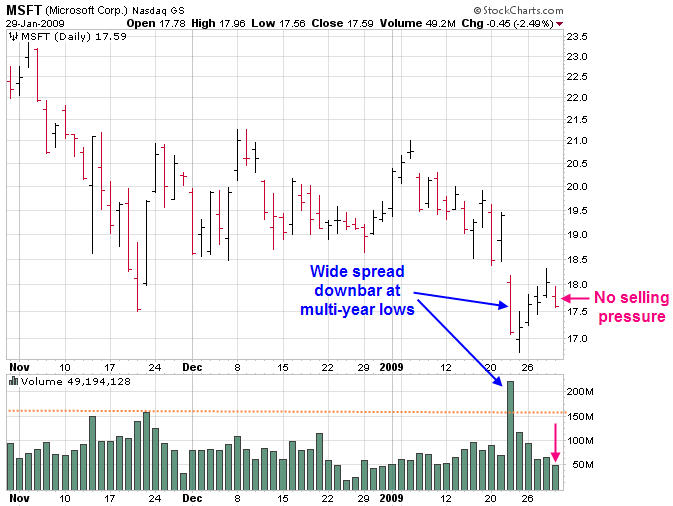
I agree on both counts, it has been quiet here with some odd stuff going on and yesterday does look like a NSP (no selling pressure) day on the OEX.
There's a similar situation with Microsoft (MSFT) with the added bonus of ultra high volume in the background six trading days ago.
Regards
Tawe
-
Shamal, no probs.
There was another example again this morning on the 5 min ES.
Regards
Tawe

-
Was that not pointed out rather succinctly by monad in response to tasuki few posts backShamal, yes I guess it was, but I didn't see the harm in giving my 2p worth's and a current chart / example, of these 'polar bears in Hawaii'.
-
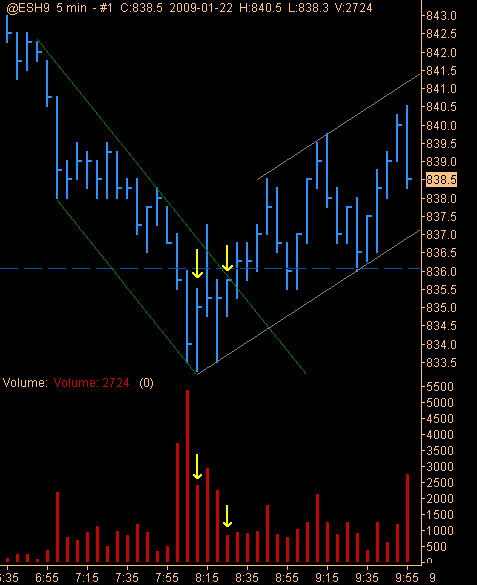
Why IS it that No Demand, and No Buying Pressure, so often show up at the beginning of up-moves??? This is when I'd like to get in long, but these contrary signals keep my finger off the trigger, and I miss the move.I see these ND or no buying pressure bars (coming in before a rally) frequently occuring in all timeframes, especially after a long decline and with a sign of possible strength in the background. I now see it as activity (buying and selling) temporally drying up and another reason to be in the long camp.
There was a similar situation on the 5 min ES this morning, when the London markets opened.
The charts say it all.
Tawe

-
From your charts, notice you only use 8a.m-4.30p.m data for Ftse and the various fib levels etc,the market trades to 9p.m (London time), although volume tapers off but the price does follow the US markets.
Yes, Hakuna I set nearly all my futures charts (various timeframes) to finish at 4.35pm around the FTSE100 cash mkt close. As I think I mentioned before, I believe the cash mkt hours, when UK shares are traded and future volume is at it's highest, is the most important time period.
I do take note of the futures evening chart, so I can see where it's been during the US session, highs and lows etc.
Here's a fine example in the 7 min chart I have attached below. It's today chart with yesterdays close at 4.35pm and my std floor pivots calculated from this close. The mkt bounced off this S1 level and if I'd set Sierracharts to calculate the pivots off the whole future session (last night 9pm close) then S1 was at a different level and didn't really have any effect.
This is only my own opinion but I've found the 8am to 4.35pm prices and volume are the ones to follow, work from and I end up with 'cleaner' charts.
I don't know if it was coincidence or whatever but todays S1 was at the same level as the 45min (multi-day) 50% Fib retracement level, where I exited a large portion of my short trade.
Regards
Tawe

-
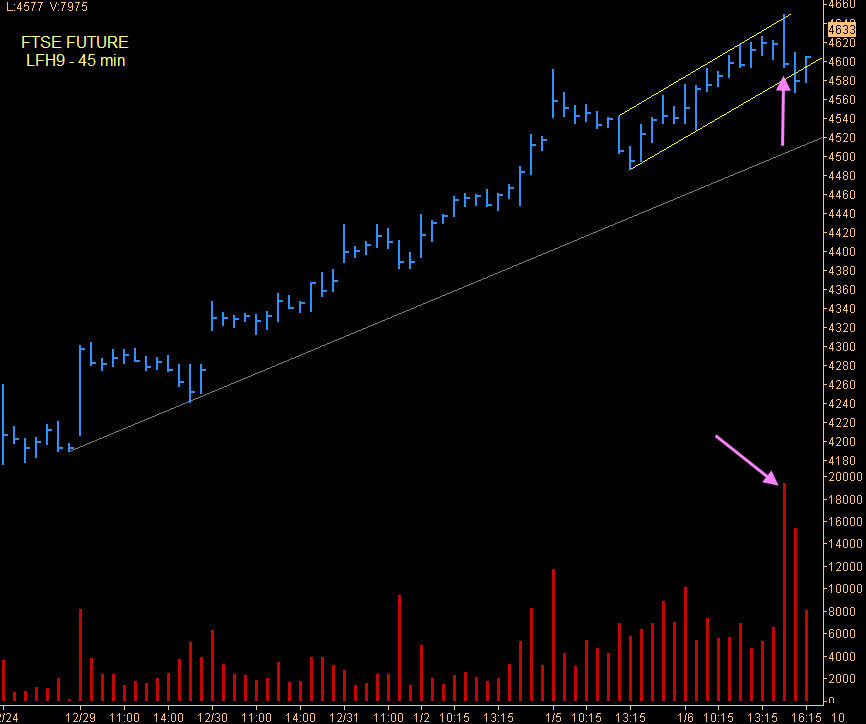
FTSE March Future - 45 min chart - UPDATE
After the mkt formed that weak looking ultra high volume upthrust on Tuesday afternoon after a fine six day rally and at the top of two up-channels, it did indeed fall back quite a bit.
I have closed out 85% of my short position at 11am this morning, just off the morning lows and near to the 50% Fib retracement level. There is, potentially, fairly major support just below, from an old mkt high.
It was also one hour before an interest statement was due from the Bank of England.
Tawe

-
I don't want to toot my own horn but..........CW, go ahead and toot your own horn as much as you wish
________________________________________________________________
FTSE March Future - 45 min chart
The mkt has been having a good rally and closed up again today, so that's six consecutive closes, most days on very light holiday volume.
As you can see there was an ultra high volume upthrust this afternoon, which to me, doesn't look too good and signals some possible weakness.
I am short the mkt and looking for at least a reasonable sized retracement / pullback in this rally.
Tawe
-
BF, thanks for the link to Todd's recent post. Has he 'invented' a new form of TA ....... WCVA - Wyckoff candle volume analysis ????
I look forward to seeing his new website up-and-running:- http://www.traderscode.com
Personally, I still like only HLC bars on my charts and the candlestick Doji's that Todd's has highlighted can be spotted fairly easily on intraday HLC charts. The bars close will be at a similar level to the previous bars close.

-
You all have nice holidays ...I second that and in case I don't post again, everyone have a great xmas and a Happy New Year.
There are some first class contributors to this VSA thread, so hopefully the quality postings will continue in 2009 and we can all keep on learning.
All the very best to you price + volume traders.
Nadolig Llawen from grey and damp Wales.
Tawe
-
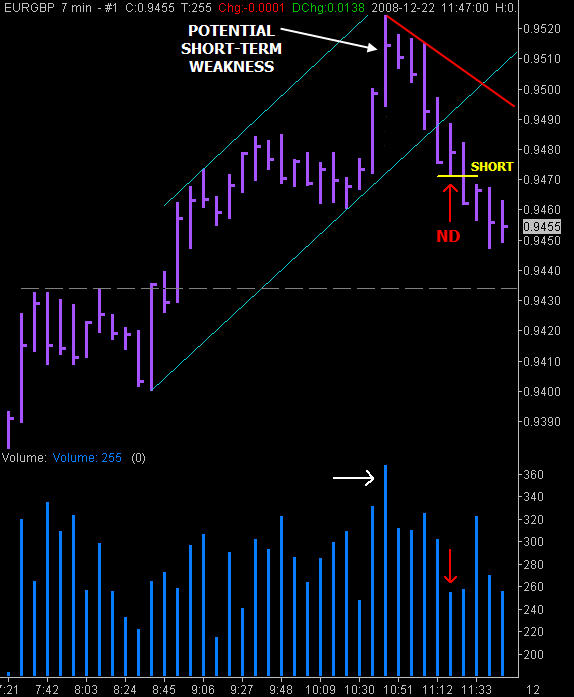
EUR/GBP Forex trade - 7 min chart
As regular visitors here would know, I pretty much focus on the FTSE 100 index but currently in the UK, the value of the British Pound to the Euro is in the news nearly everyday, due to the fact that's it's getting near to 1:1 parity. Seeing that we are going into the xmas holiday period and the FTSE future volume and activity was fairly low this morning, I thought I'd have a look at the EUR/GBP currency pair, out of interest and I noticed a potential VSA setup.
At 10.44am this morning we have a wide spread up bar on high volume closing off the high, signalling possible weakness.
Next we have a channel break to the downside, followed by a no demand in a falling mkt, classic VSA.
I went short after the low of the ND was broken and I exited for a quick 20 pips, a couple of bars later.
In hindsight I should have held on for at least another 20 pips and used an old high of 0.9433 (dashed grey line) as a exit target, as the mkt declined to this level before going sideways.
Tawe
-
Delta,
It looks pretty good to me. Thanks for posting and sharing.
Regards
Tawe
-
Pip-tastic VJ,

Great live trade and follow up comments.
Thanks
Tawe
-
where was your stop, how many points.Say which datafeed yu using, on my 7min charts , mine looks somewhat different via esignal feed.
Hakuna,
My 'mental' stop was above the upthrust by 5pts. I like to give the FTSE some room, especially considering current mkt volatility.
I use DTN IQfeed as my data supplier for my Sierracharts.
An entry below the break of the upthrust low (in hindsight) may have been a better risk v's reward trade.
Regards
Tawe
-
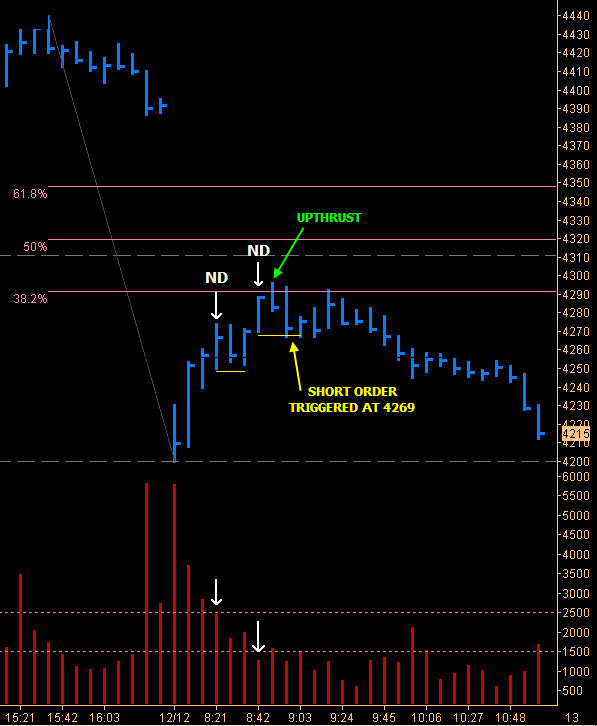
FTSE Future - short trade _ 7 min chart
Not surprisingly, the mkt gapped down this morning, following the US sell-off yesterday and a weak overnight Asia session.
There was a very high volume opening bar, followed by a rally. I was a bit worried about the opening bar volume and if it contained any buying. I didn't want to go long but I was looking for a place to go short and waited for a confirmed no demand (ND).
There was a ND on the 8.21am but it's low was never broken.
There was another confirmed ND at 8.42am and I placed a order to go short at 1 pt below the ND low. The ND was followed by an upthrust into Fib 38% retracement level before the mkt turned down and eventually my trade was activated.
The mkt went sideways for a while before eventually rolling over and declining. I picked up 35pts on this trade, not as much as I could have. :crap:
Tawe
-
Yes VJ,
I and I guess, many others got the message that you were trying to convey, thanks. To be on the lookout for VSA buy / long setups when the Taylor method is calling it a buy day and vice versa for shorts.
The other would be the "inversion phenomenon"Let's not go down this route.
I have also tried to combine VSA with Wells Wilders Delta Phenomenon mkt turns and cycles.Tawe
[VSA] Volume Spread Analysis Part I
in Volume Spread Analysis
Posted
Januszom,
Thanks for posting, maybe you could re-post on the latest VSA thread where there are more followers.
http://www.traderslaboratory.com/forums/151/vsa-volume-spread-analysis-part-ii-3428-218.html#post60610
Also, I would like to see a chart of your volume sticks, as they say:- a picture paints a thousands words.
Regards
Tawe