
Welcome to the new Traders Laboratory! Please bear with us as we finish the migration over the next few days. If you find any issues, want to leave feedback, get in touch with us, or offer suggestions please post to the Support forum here.


primetrader
-
Content Count
7 -
Joined
-
Last visited
Posts posted by primetrader
-
-
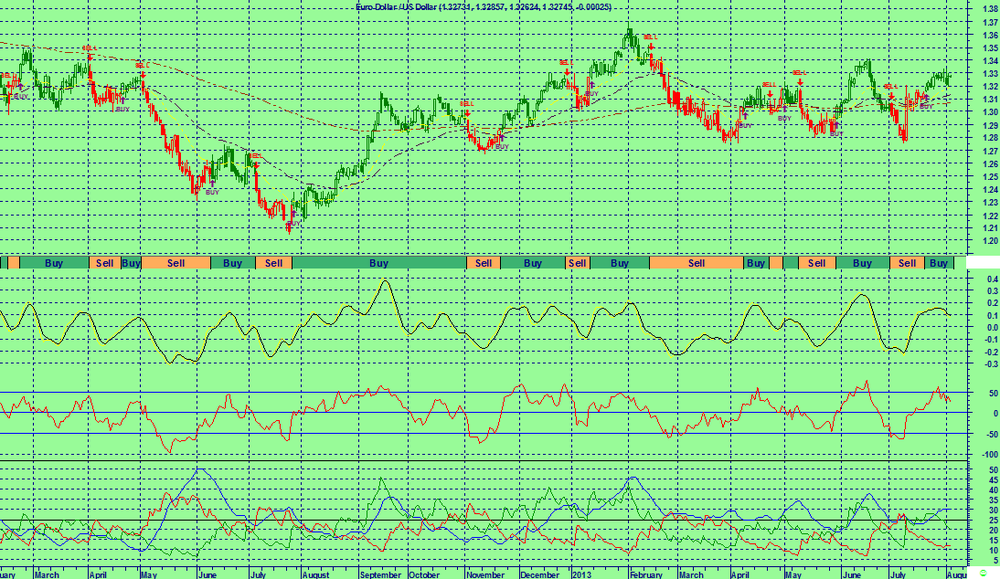
Trend Analysis
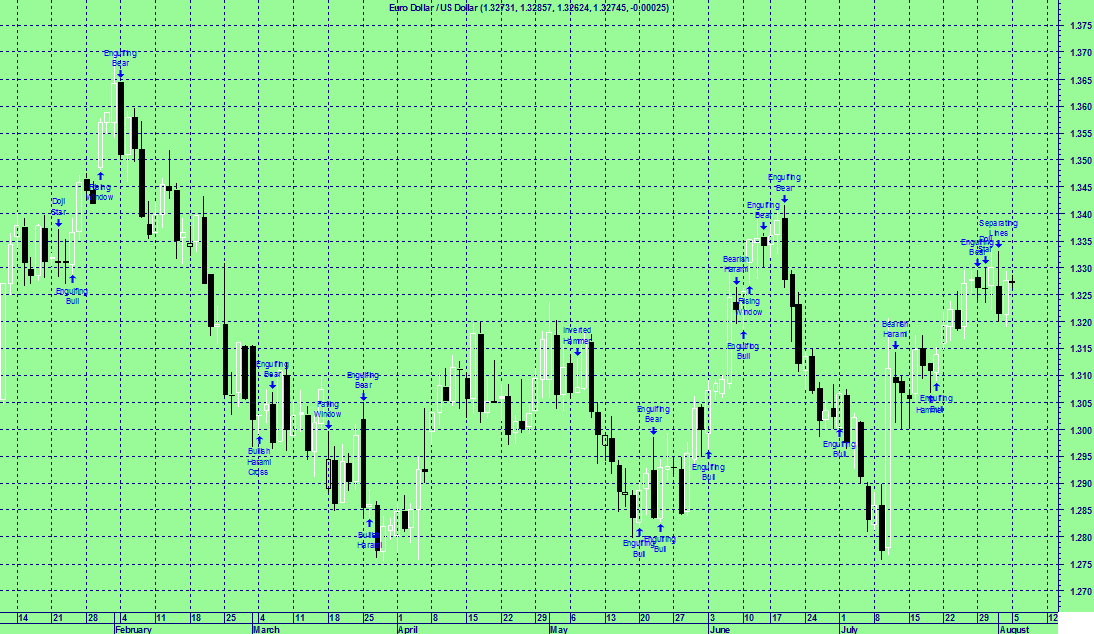
EURUSD prices close
HIGHER than the 200 Moving Average
HIGHER than the 50 Moving Average
HIGHER than the 20 Moving Average
The current trend for Euro Dollar / US Dollar is Extremely Bullish
The most recently confirmed up trendline for Euro Dollar / US Dollar has an ending point currently at 1.28. Expect prices to have some difficulty falling below this trendline. A break below this trendline particularly on heavy trading would be a bearish sign.
SAR
No SAR signals triggered today. SAR triggered a Buy signal 18 period(s) Ago.
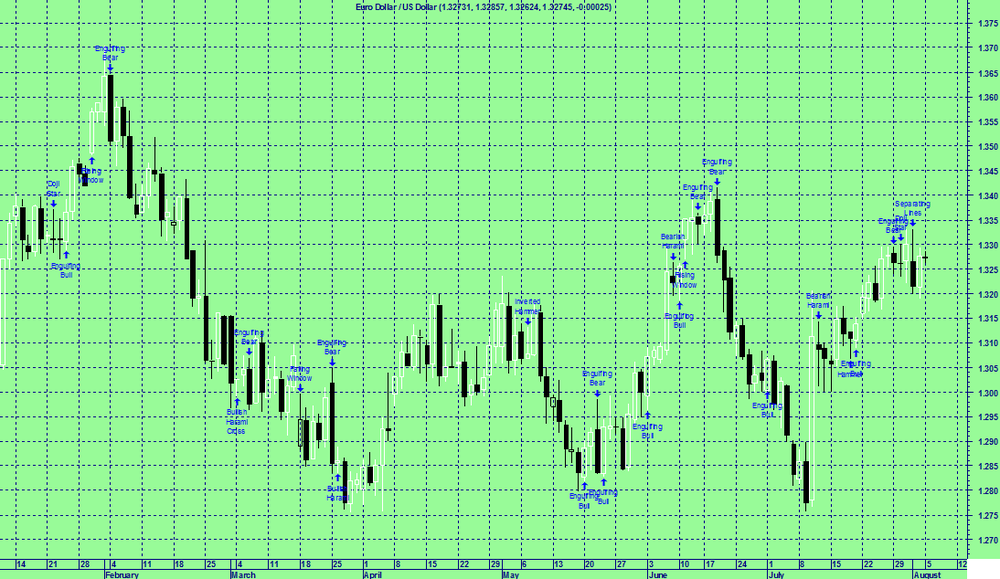
Japanese Candlestick
White Body has formed as prices closed higher than the open.
The past 10 candlesticks there are 7 white candles and 3 black candles with a net of 4 white candles.
The past 50 candlesticks there are 27 white candles and 23 black candles with a net of 4 white candles.
Bollinger Band
Euro Dollar / US Dollar closed below the upper Bollinger Band by 27.5%. Bollinger Bands are 7.14% wider than normal. The current width of the Bollinger Bands (alone) does not suggest anything conclusive about the future volatility or movement of prices.
Elliot Wave Analysis
Elliott Waves High Volatility has detected a possible point 4 of a WolfWave (21%) pattern for Euro Dollar / US Dollar. This pattern is an expanding triangle and trades from the next point. When the peak or trough will form, usually after crossing or touching the extended line of points 1 and 3, the price will move in the opposite direction towards the target line formed by the extension of points 2 and 4.
An Inside Day Narrow Range was detected by our Elliott Waves High Volatility on 05/08/2013. This is usually a trade set-up opportunity
Elliott Waves High Volatility has detected an Isolated Low at 1.32 one bar ago ; this is usually a bullish sign
The present wave patterns are:
fast amplitude (8%): bullish wave 1
moderate amplitude (13%): bullish wave 3
-
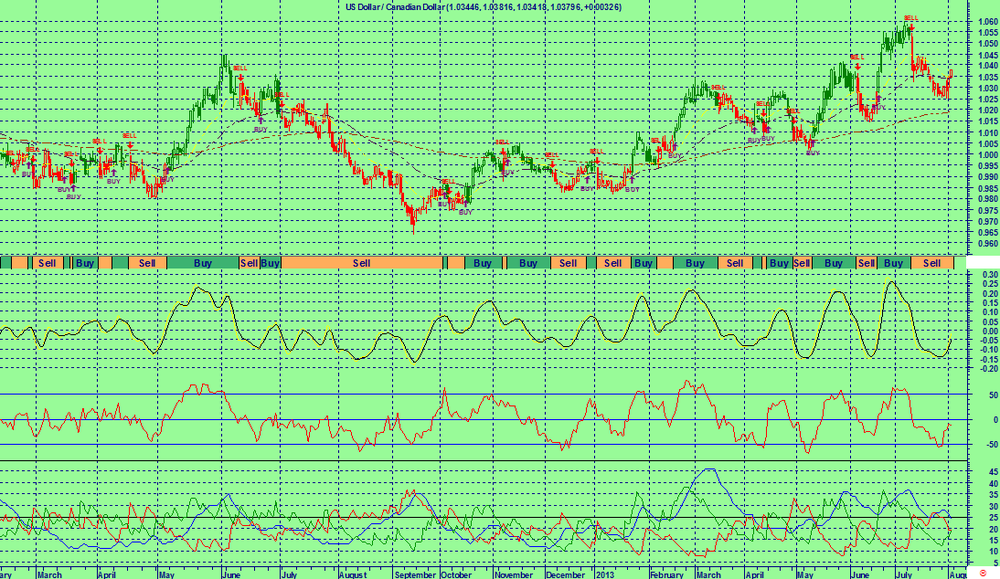
SAR
SAR triggered a Buy signal today. Exit positions if short.
Trend Analysis
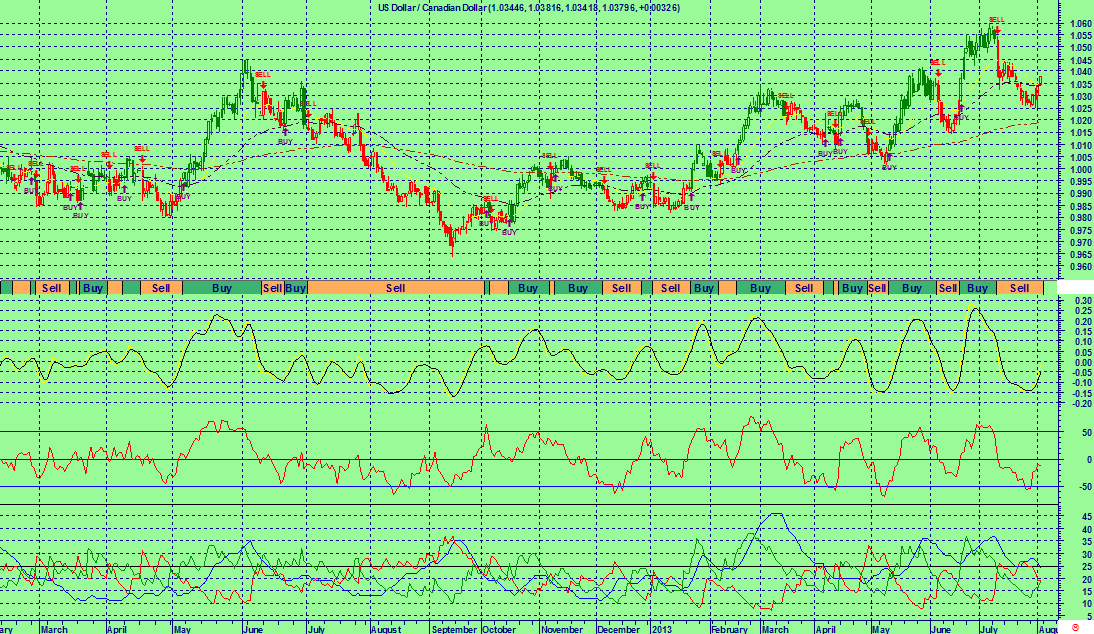
USDCAD prices close
HIGHER than the 200 Moving Average
HIGHER than the 50 Moving Average
HIGHER than the 20 Moving Average
The current trend for US Dollar / Canadian Dollar is Extremely Bullish
US Dollar / Canadian Dollar broke above the upside resistance level of 1.04 today. This is a bullish sign. This previous resistance level of 1.04 now provide downside support. The most recently confirmed downside support level for US Dollar / Canadian Dollar is around 0.98. Expect prices to have some difficulty falling below this level. A break below this level particularly on heavy trading would be a bearish sign.
Bollinger Band
US Dollar / Canadian Dollar closed below the upper Bollinger Band by 45.4%. Bollinger Bands are 14.87% wider than normal. The current width of the Bollinger Bands (alone) does not suggest anything conclusive about the future volatility or movement of prices.
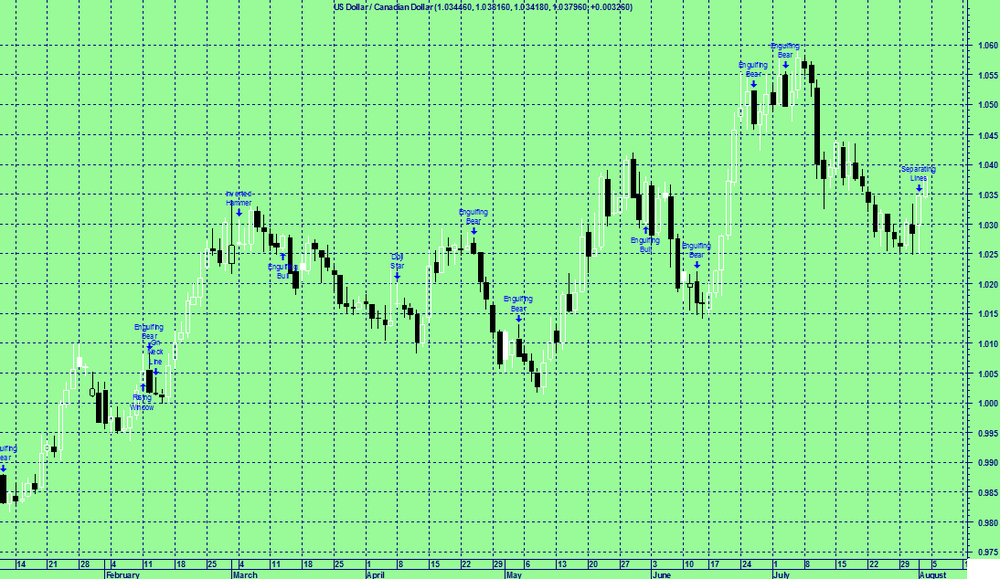
Japanese Candlestick
White Body has formed as prices closed higher than the open.
The past 10 candlesticks there are 4 white candles and 6 black candles with a net of 2 black candles.
The past 50 candlesticks there are 25 white candles and 25 black candles .
Overall, the bias in prices is: Sideways.
Short term: Prices are stalling.
Intermediate term: Prices are ranging.
The projected upper bound is: 1.05.
The projected lower bound is: 1.02.
The projected closing price is: 1.04.
Technical Outlook
Short Term:Neutral
Intermediate Term:Bearish
Long Term:Bullish
-
Japanese Candlestick
White Body has formed as prices closed higher than the open.
The past 10 candlesticks there are 7 white candles and 3 black candles with a net of 4 white candles.
The past 50 candlesticks there are 27 white candles and 23 black candles with a net of 4 white candles.Spinning Top has formed with a small real body. Spinning tops have little price action defined by the difference between open and close. During a rally or near new highs, a spinning top is a sign that prices are losing momentum and the bulls are in trouble.
Bollinger Band
Euro Dollar / US Dollar closed below the upper Bollinger Band by 23.9%. Bollinger Bands are 36.29% wider than normal. The current width of the Bollinger Bands (alone) does not suggest anything conclusive about the future volatility or movement of prices.
Elliot Wave Analysis
Elliott Waves High Volatility has detected a possible point 4 of a WolfWave (21%) pattern for Euro Dollar / US Dollar. This pattern is an expanding triangle and trades from the next point. When the peak or trough will form, usually after crossing or touching the extended line of points 1 and 3, the price will move in the opposite direction towards the target line formed by the extension of points 2 and 4.
An Inside Day Narrow Range was detected by our Elliott Waves High Volatility on 31/07/2013. This is usually a trade set-up opportunity
Elliott Waves High Volatility has detected an Isolated Low at 1.32 one bar ago ; this is usually a bullish sign
Elliott Waves High Volatility has detected an Isolated High at 1.33 one bar ago; this is usually a bearish sign
The present wave patterns are:
fast amplitude (8%): bullish wave 1
moderate amplitude (13%): bullish wave 3
-
I am a starter in online trading. I want to find a broker which has cheap broker. But how good are they?You can try primetradefx, they have very small spreads. You can try their demo accounts and their demo account have no expiry even after you open live account.
-
Do not give stress and pressure when trading forex. Trade in a comfortable enviorment but not to cozy of course with some very light music. Do not set any target or force yourself to meet any target. The trend is our target.
-
To become a successful trader you need to constantly upgrade yourself with forex knowledge as well as technical analysis. You cannot master overnight as it takes times. You must gain more practial experience.


Gold/US Dollar Broke Resistance on 16/08/2013
in Forex
Posted
Trend Analysis
XAUUSD prices close
LOWER than the 200 Moving Average
HIGHER than the 50 Moving Average
HIGHER than the 20 Moving Average
The current trend for Gold / US Dollar is Slightly Bearish. Gold / US Dollar broke above the upside resistance level of 1,354.70 today. This is a bullish sign. This previous resistance level of 1,354.70 now provide downside support.
Bollinger Band
Gold / US Dollar closed above the upper Bollinger Band by 4.6%. This combined with the steep uptrend suggests that the upward trend has a good chance of continuing. However, a short-term pull-back inside the Bollinger Bands is likely. Bollinger Bands are 26.83% narrower than normal.
MACD
Presently the MACD is BULLISH as MACD is moving higher than the signal line. The MACD crossed above the signal line 4 period(s) ago. Since MACD crossed the MACD moving average, Gold / US Dollar’s price has increased 3.95%, and has ranged from a high of 1,369.720 to a low of 1,305.190.
RSI
RSI has just reached its highest value in the past 14 period(s) indicating a BULLISH signal.
DMI
Directional Movement Indicators (DMI) currently not indicating any specific price direction. Directional Movement Indicators (DMI) signal was a SELL 11 period(s) ago.
Elliot Wave Analysis
The present wave patterns are:
fast amplitude (8%): bullish wave 1
moderate amplitude (13%): bearish wave 2
normal amplitude (21%): bearish wave 1