
Welcome to the new Traders Laboratory! Please bear with us as we finish the migration over the next few days. If you find any issues, want to leave feedback, get in touch with us, or offer suggestions please post to the Support forum here.


lajax
-
Content Count
16 -
Joined
-
Last visited
Posts posted by lajax
-
-
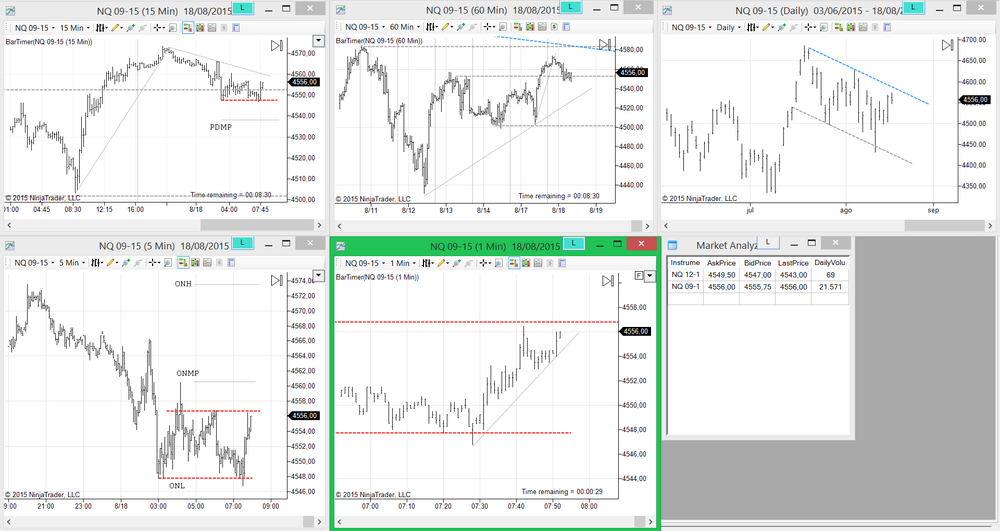
CONTEXT 18/08
I see you picked up on the daily trend channel. I've stopped posting these because so many people cling to them like life preservers, and they shouldn't become the focus. But this one is pretty hard to miss.
Hi Db
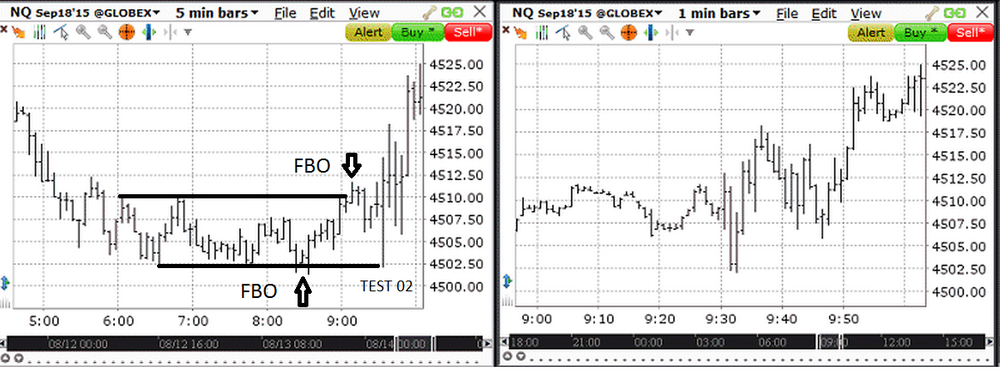
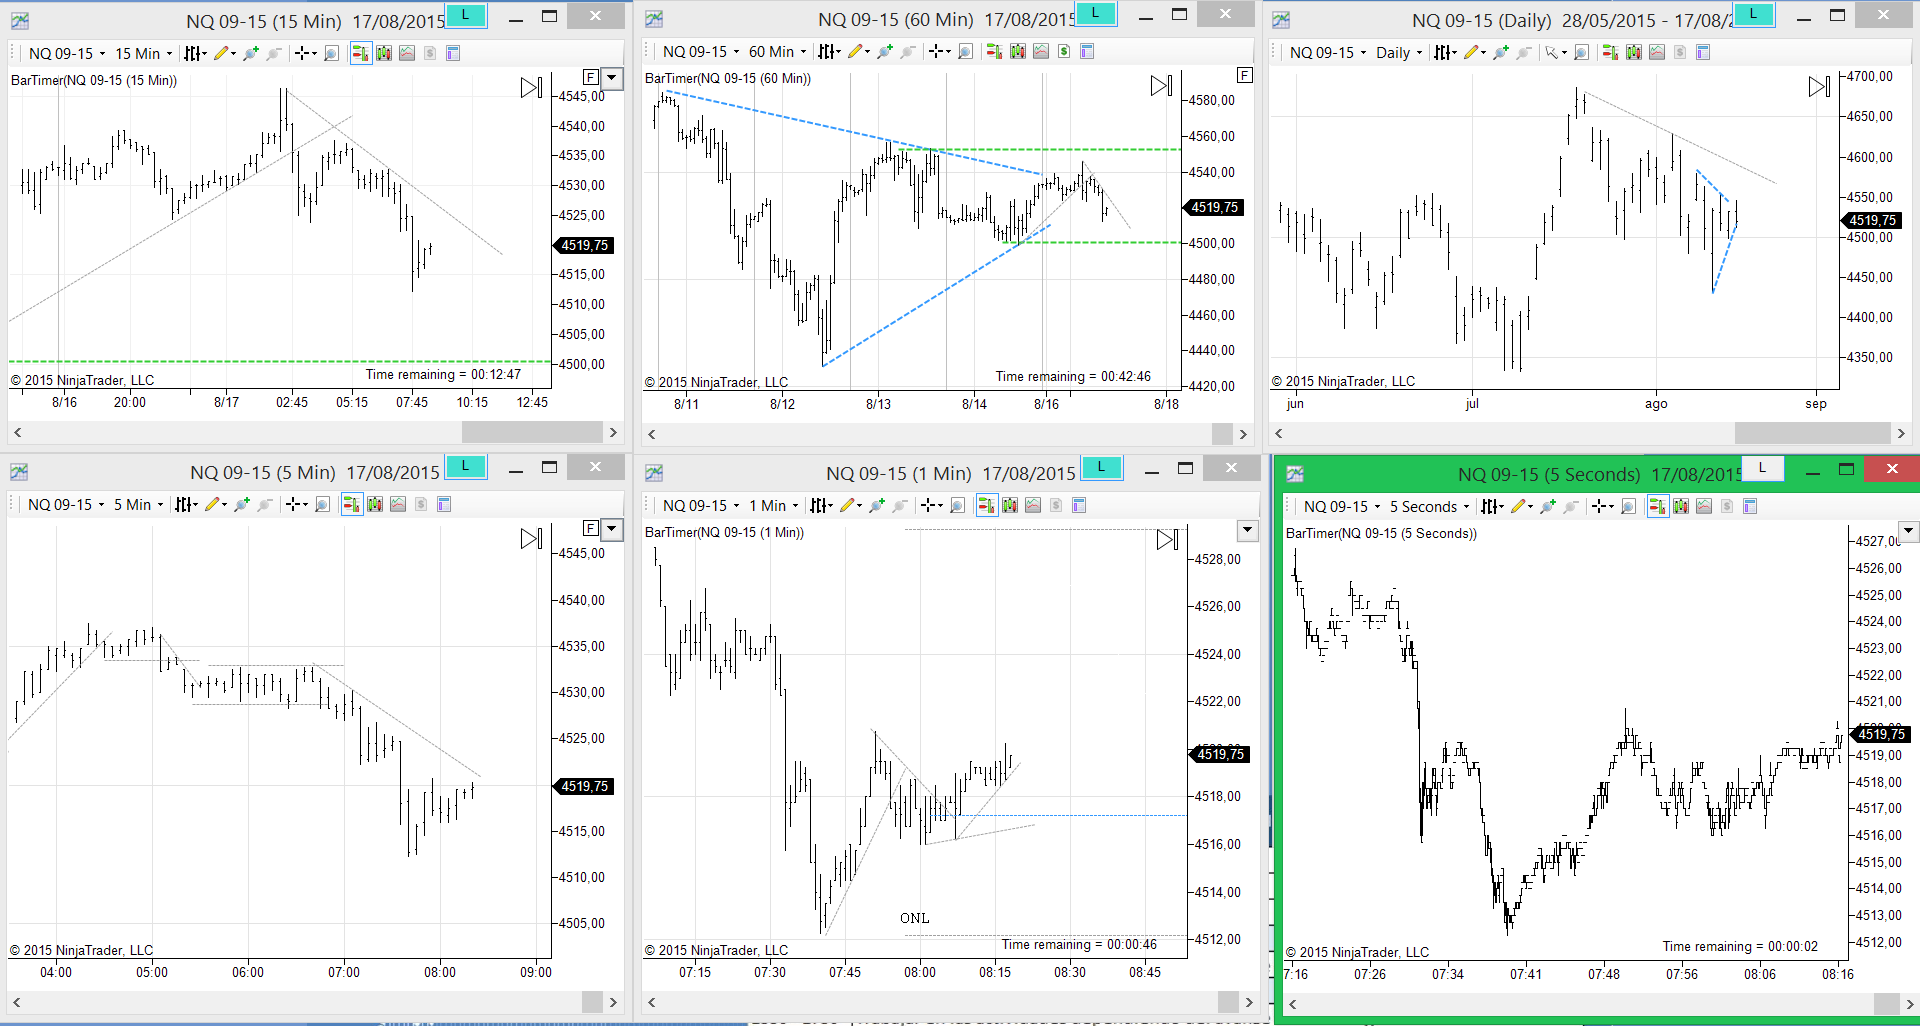
Thanks for the feedback of yesterday really appreciate your point of view. For today I think the PA at the beginning after the open was pretty similar (to yesterday), notwithstanding, I was more careful about it; first because we have been in a well-defined TR (Almost 5 hrs), in this context I was looking for a RET after the BO of the TR, however, the Price did not take a clear direction and maintained its movement framed most of the time around the boundaries of the TR.
For the second trade I try to Stop and reverse de position, in order to trade the TR after the unwillingness of the traders to push the price to the upside (this could be consider as a REV of the RET right?), notwithstanding because I am trading the 10k combine, the max position allowed is 1 contract therefore I had some issues and I could no enter (It was maddening because when I try to put the order my stop Loss was closed and I had to close the trade manually); in this context I preferred to Stop trading.
Note: Maybe today was a good trading day for reversals, notwithstanding because I am learning I prefer to stick to one strategy only and even more now that I put some money at risk (price of the combine)
Note 2: About the exercise of been trading the combine is little different because one starts to feel certain type of feelings such as an increase of the heart beating rhythm or sweaty hands, notwithstanding, I know that the only tool for me to face the markets is to trust in my trading plan and follow the rules.
I hope tomorrow be a better day :missy:
-
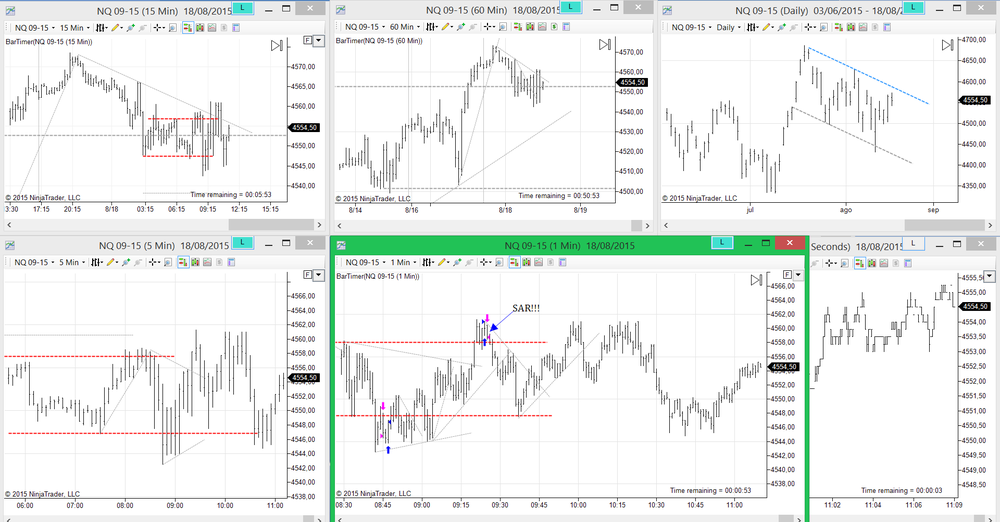
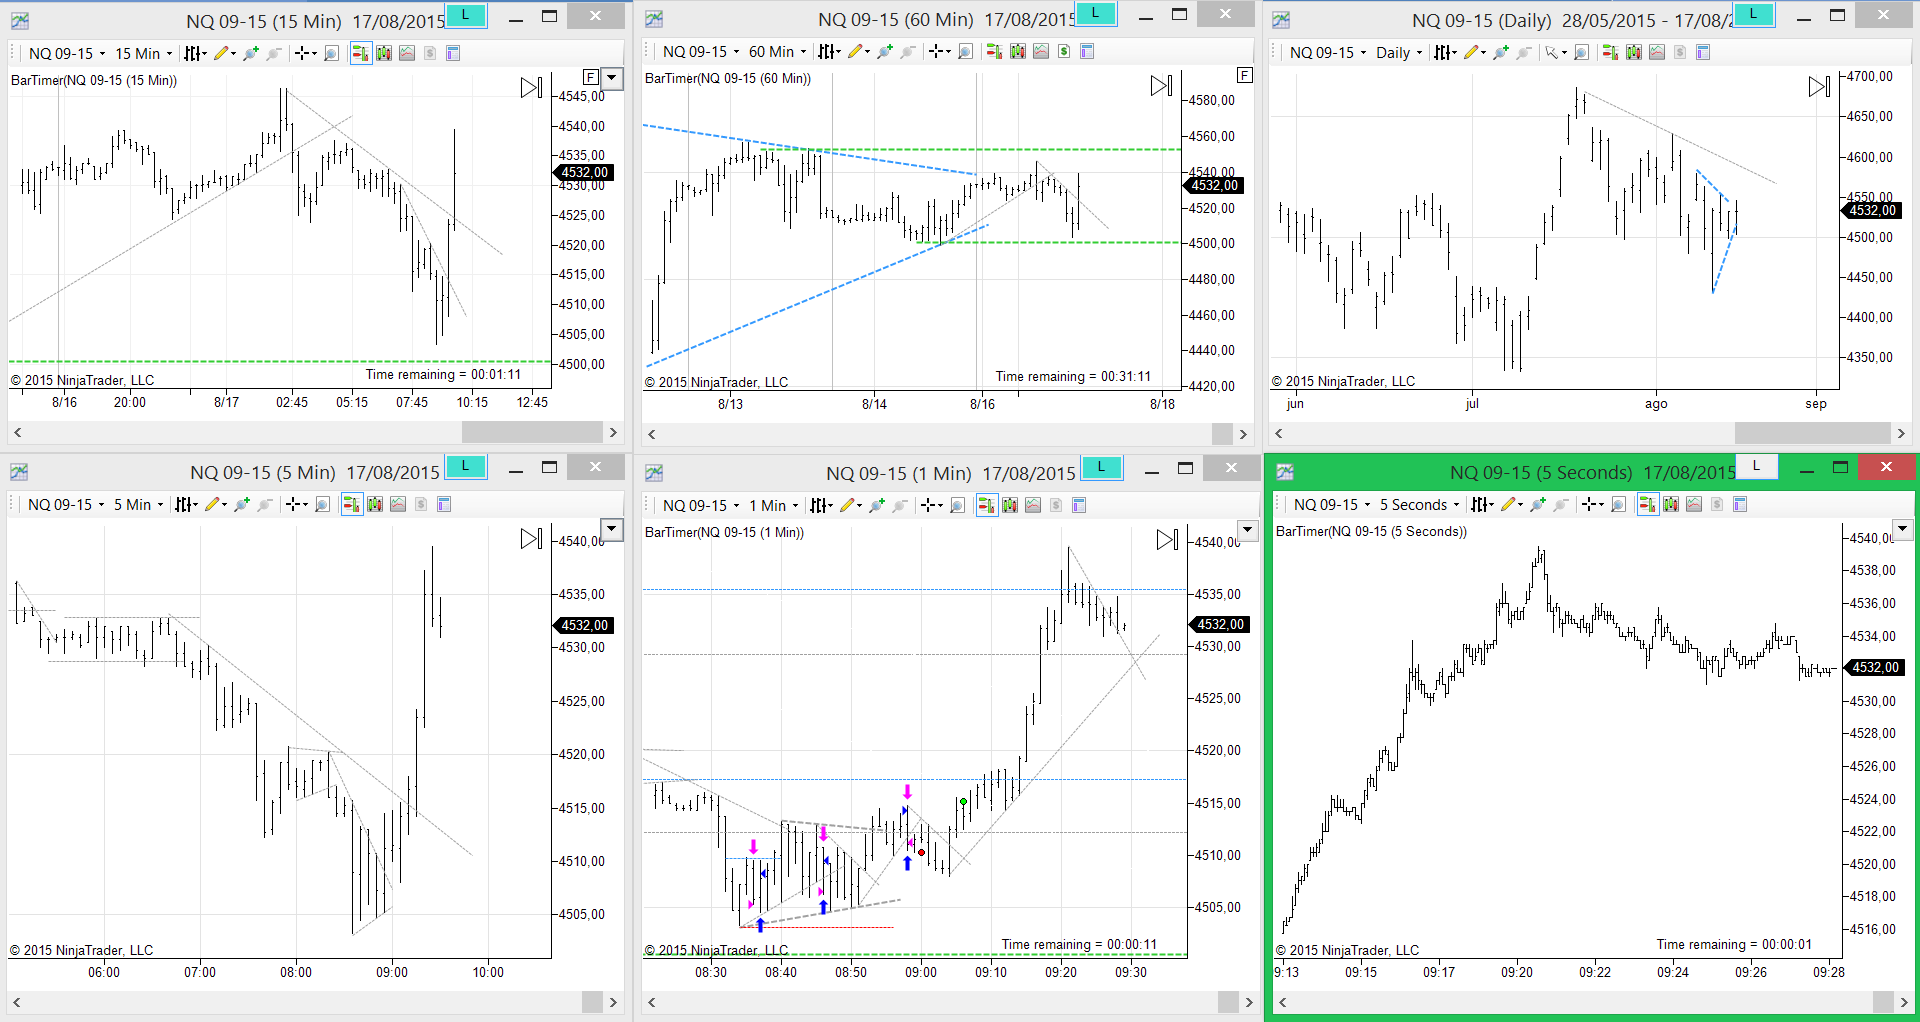
So far 3 loser trades in a Row therefore I prefer to stop trading.
FYI, I am participating in a continuous trading combine in Top Step Trader and this is my first day, I am trading a 10k account.
Any comment or feedback is welcome.
Thanks
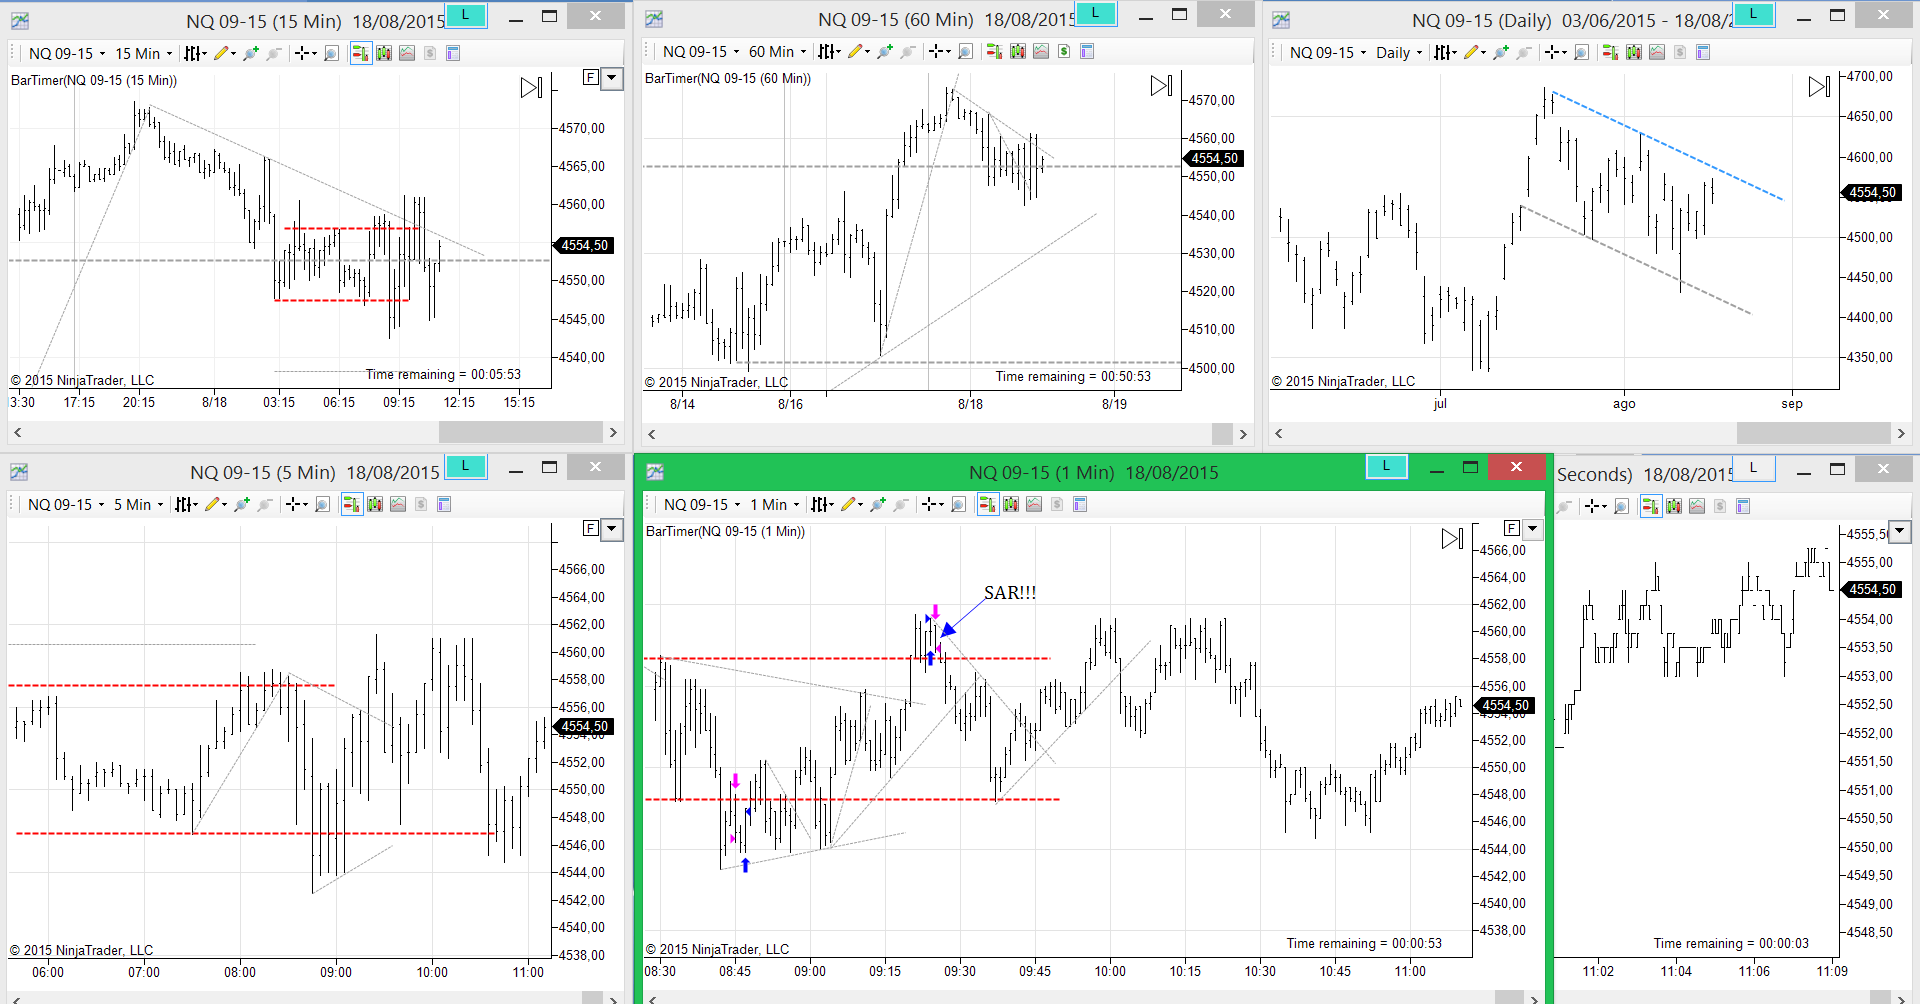
The consequence of limiting oneself to only one strategy is that one applies this strategy inappropriately, losing out not only on the misapplied strategy but on other trades that would have been successful if the other two strategies had been included.
Here you look to enter on a retracement, and your first trade is technically a retracement; however, it is the third one and it's more than ten points below the first. By reducing your information risk, and by declining to trade outside RTH, you greatly increase your price risk, and the trade fails. By the time what you view as the next trade opportunity occurs, you're in chop, and there should be no trades taken at all (this is to be expected as you are in chop on both the daily and the hourly, so the levels you're choosing as reference points are not necessarily pertinent). The third trade is technically legitimate, though not compelling given the depth of the retracement. Either way it should have been your first. As it was your third, you left the field, and the next retracement turned out to be the winner.
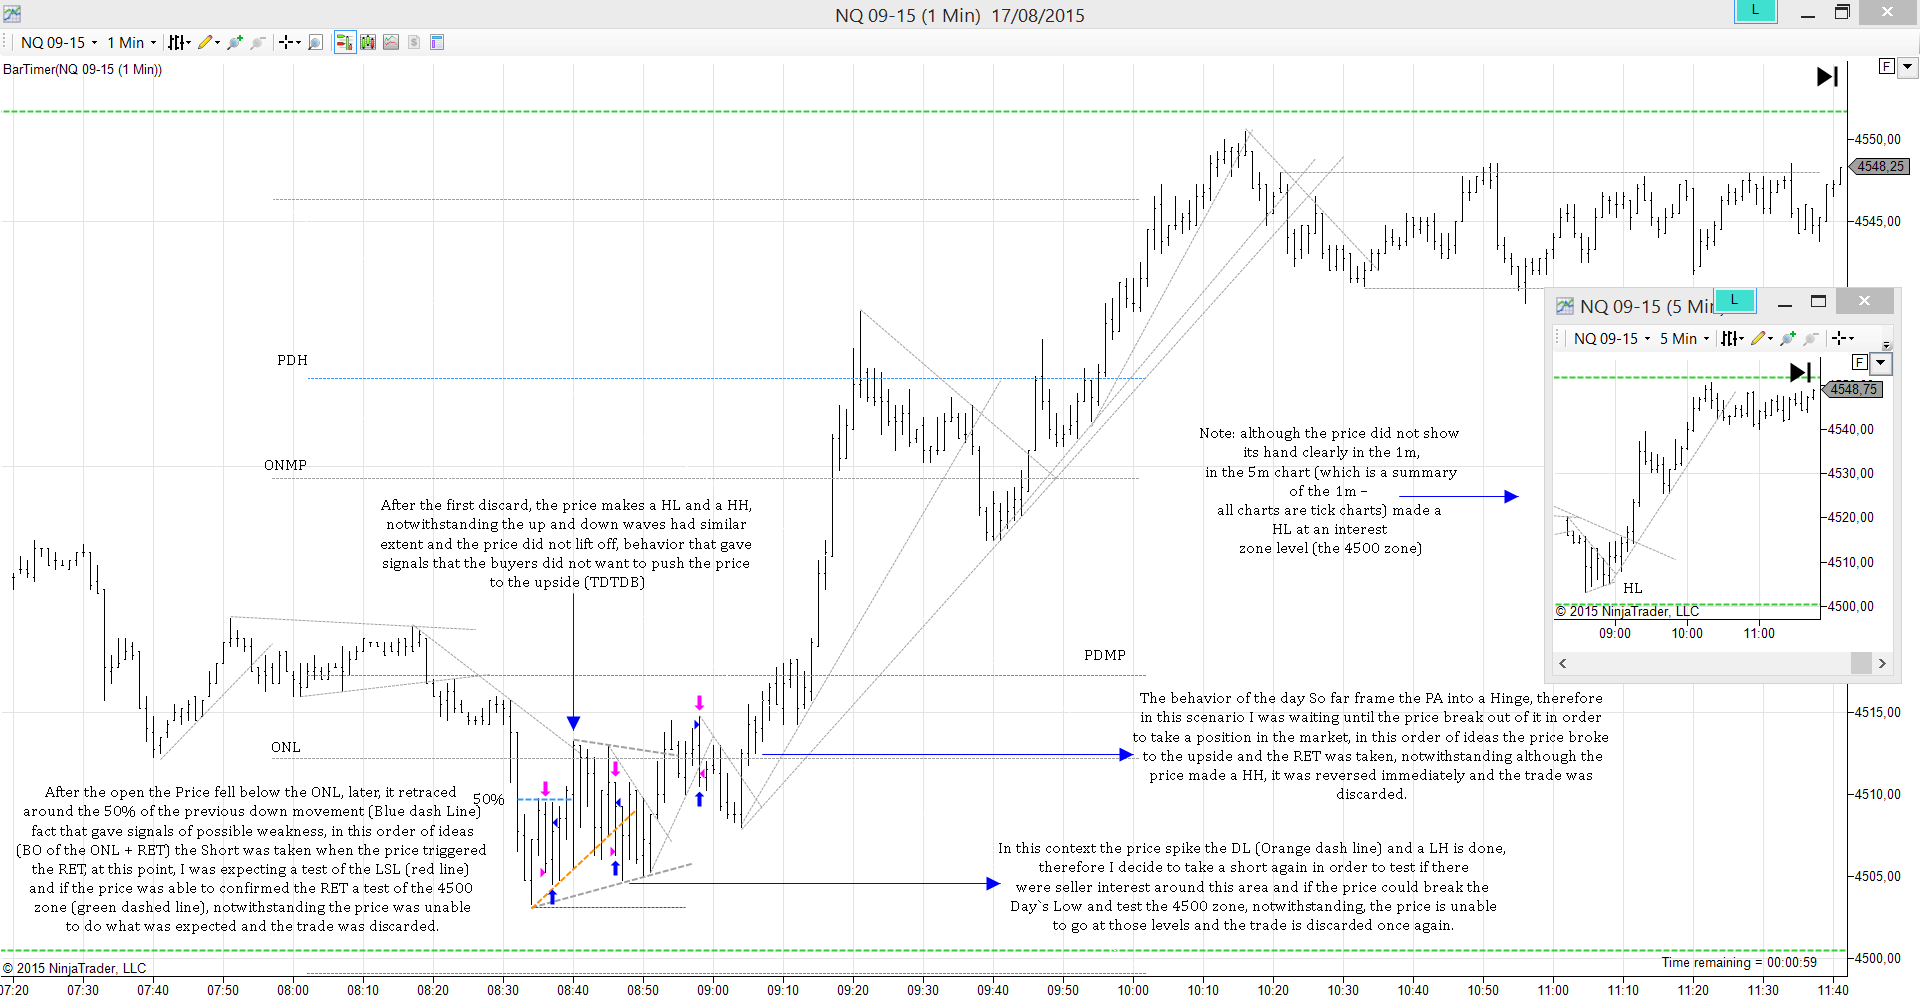
By looking at so much, and by drawing so many lines, you're not seeing what matters. The lines, rather than guiding you, are blocking you. There is only one line here that is of any use, the SL beginning at "0815". You're willing to pay the price, but your judgement of whether or not to pay it at all is faulty.
The fact that price got to the apex of the hourly hinge tells you that you're ranging, the limits of which are 4500 to 4545. The preferred course is to trade the extremes. You don't get to the lower extreme at the open. Instead you again have chop. If you feel that the opening low was low enough, then there is nothing to do until the SL is broken at "0852". If and when this occurs, it will tell you whether the OL was low enough. That the trade taken after this break fails should come as no surprise given the chop you're in at longer bar intervals. However, if you apply a two-loss rule, it can be taken, along with the next, which, as I said above, turns out to be the winner, at least with regard to trading this range.
By not including reversals in your strategy set, you're viewing what are reversals through retracement lenses. You are not therefore benefiting from either. You are of course not required to trade reversals, but you should study them and understand them so that you do not mistakenly trade them as retracements.
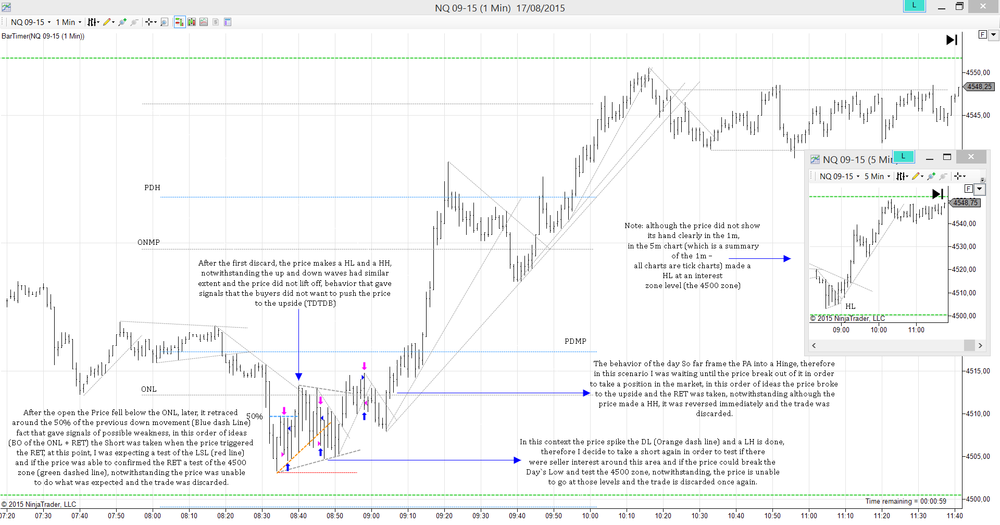
Following the rules of my trading plan a Review of the trades executed today must be done, therefore I prefer to do it in the chart in order to be easy to read

-
So what do you see here?
Db one question, when you say:
The first thing here is that price is dead center of the last upmove on the daily
when you characterize the location of the price in a "dead center" maybe do you take as reference, maybe, the slow pace, slow activity and the overlapping in the bars (daily bars)? or what criteria do you take as reference in order to mention that statement (dead center)?
See the blue lines I drew, the solid line from the swing low to the swing high and the dashed line through the middle. I don't much care about the rest of it. All that you mention contributes to where traders end up, but it's on the periphery of my awareness. We aren't at the swing high and we aren't at the swing low, which would be great. Instead, chop. At least from a daily perspective. This "range" is over 300pts, so there's plenty of opportunity for daily gains. And it's something that everybody sees. They also see that we're at the middle of it. To see the possibilities that this middle represents, the hourly may give a clue, particularly if it has been ranging, as here, which in this case is about 40pts. 40pts is worth paying attention to.
As I've said, I prefer taking trades that are going toward the median rather than away from it. But if one is alert and careful and doesn't allow biases to encourage him to do stupid things, profits can be made relatively safely.
-
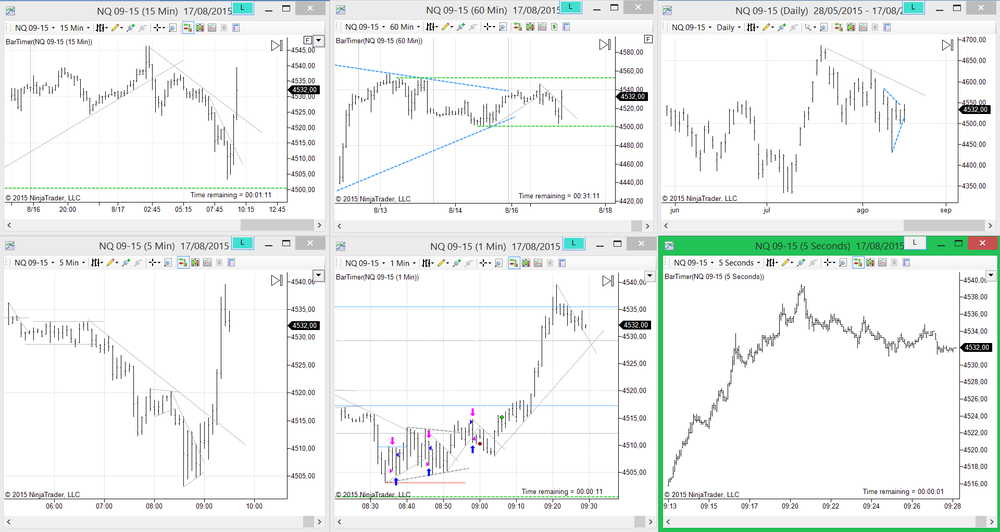
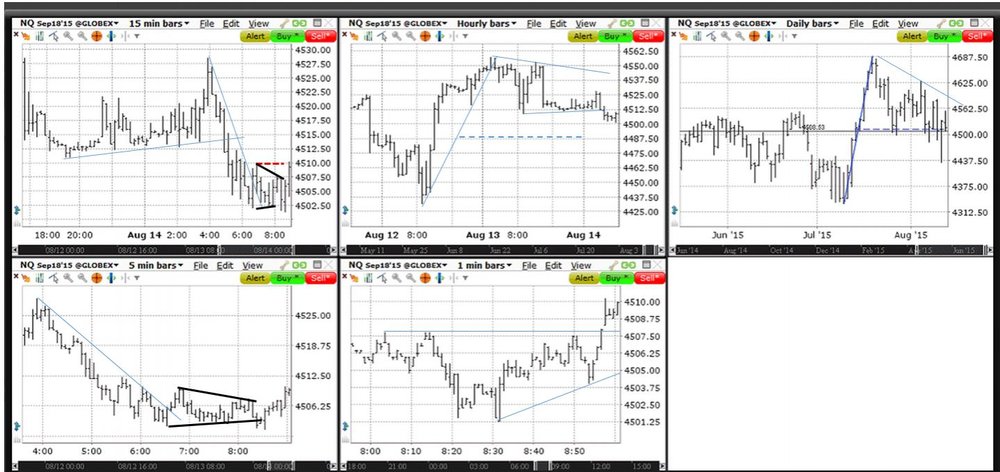
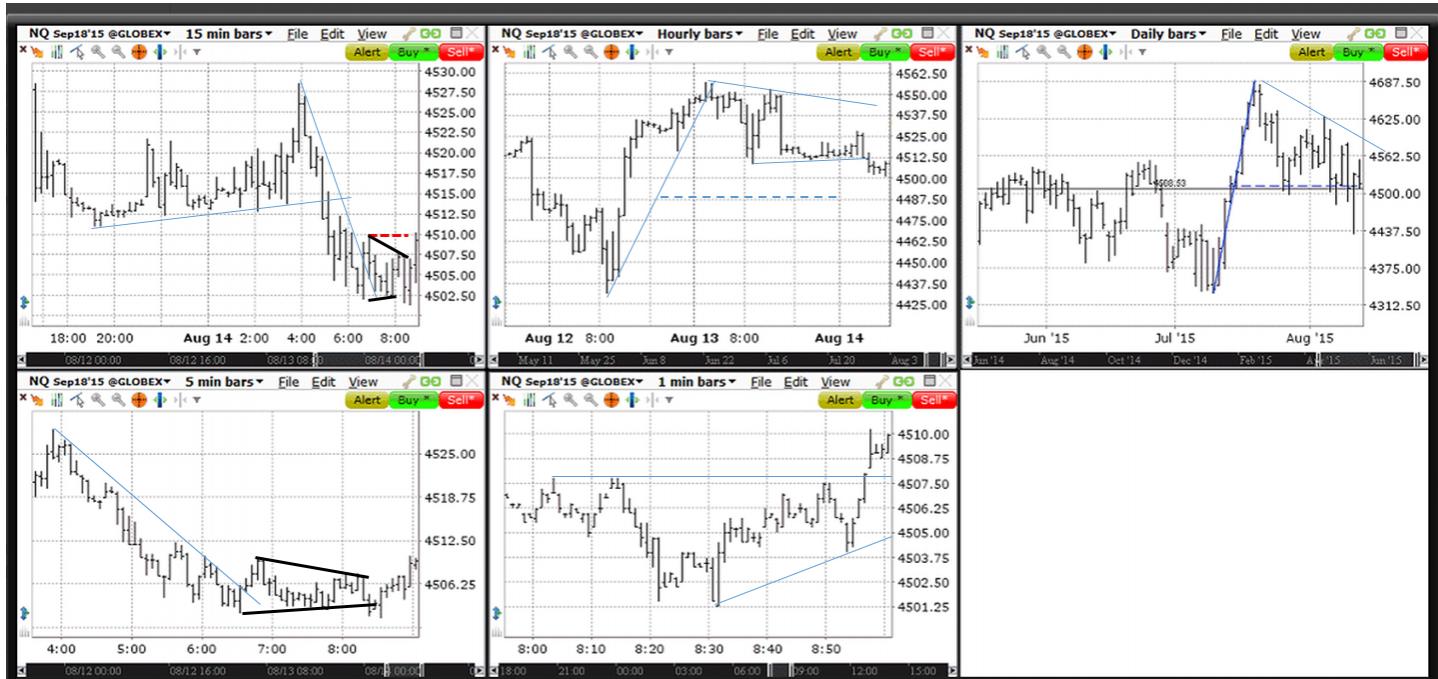
Daily Bar
Although the price is in a downtrend, there is no ease of movement to the downside and although the Price fell below the 50%, was unable to maintain at those levels, therefore this shows certain level of Strength in the price and perhaps the unwillingness of the traders to keep pushing the price to the downside.
Hourly Bar
The price is in a downtrend, once again there is no ease of movement and a Hinge is formed, notwithstanding, the price breaks the Swing Low around 4512,50 therefore one should expect that the traders go to test the 50% of the previous up movement in order to identify signals of weakness or strength.
15 min bar – 5 min bar - 1m bar
The down trend seems to decelerate its movement and a hinge is formed, notwithstanding the sellers try to test the Swing Low around 4502.50, but they are unable to maintain the price below this area and the price rebounds, situation that gives signals of strength
Therefore in this context I would wait for a retracement after the break out of the hinge.
I would like to know your thinking process and what would you do in this context?
We'll see who else gives it a shot. You and Gozilla are all who are actively working on this.
BTW: thanks for this kind of practical exercises, I really appreciate it,
-
-
Here is the Excel file of my backtesting process, I uploaded here because in ET is not possible.
-
Hi Db
For now I want to start my phase of testing the entries and exits, obviously I want to apply the SLA/AMT approach; however, I would like to know your opinion regarding which documentation would you recommend me to start this phase?
What do you mean by "documentation"?
I mean documents, articles or texts to take as reference, for example the sla/amt pdf, So the question is what others articles or texts I could read in order to start the new phase (entries and exits)?
At minimum, the Wyckoff Lite material in the stickies, esp Section 7, and you've already read the Developing a Plan pdf. That's really about it. There is such a thing as reading too much.
-
Hi everyone.
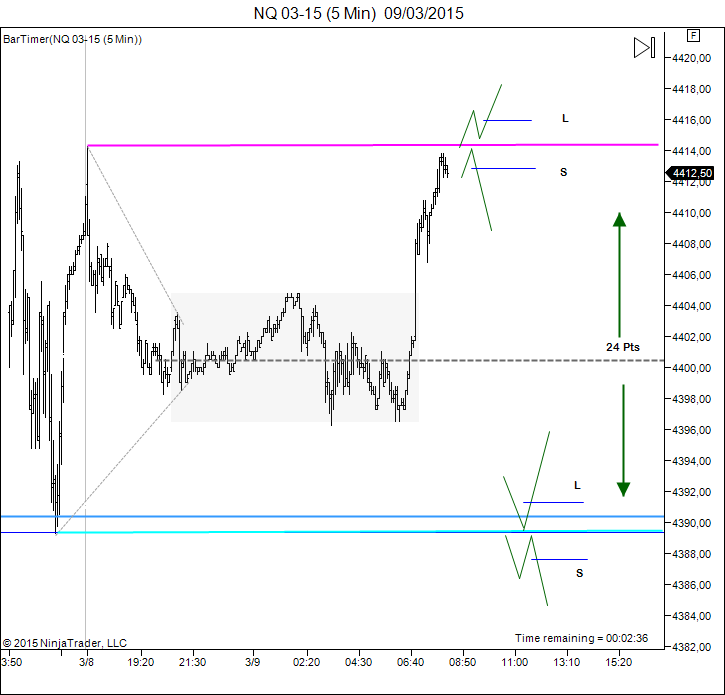
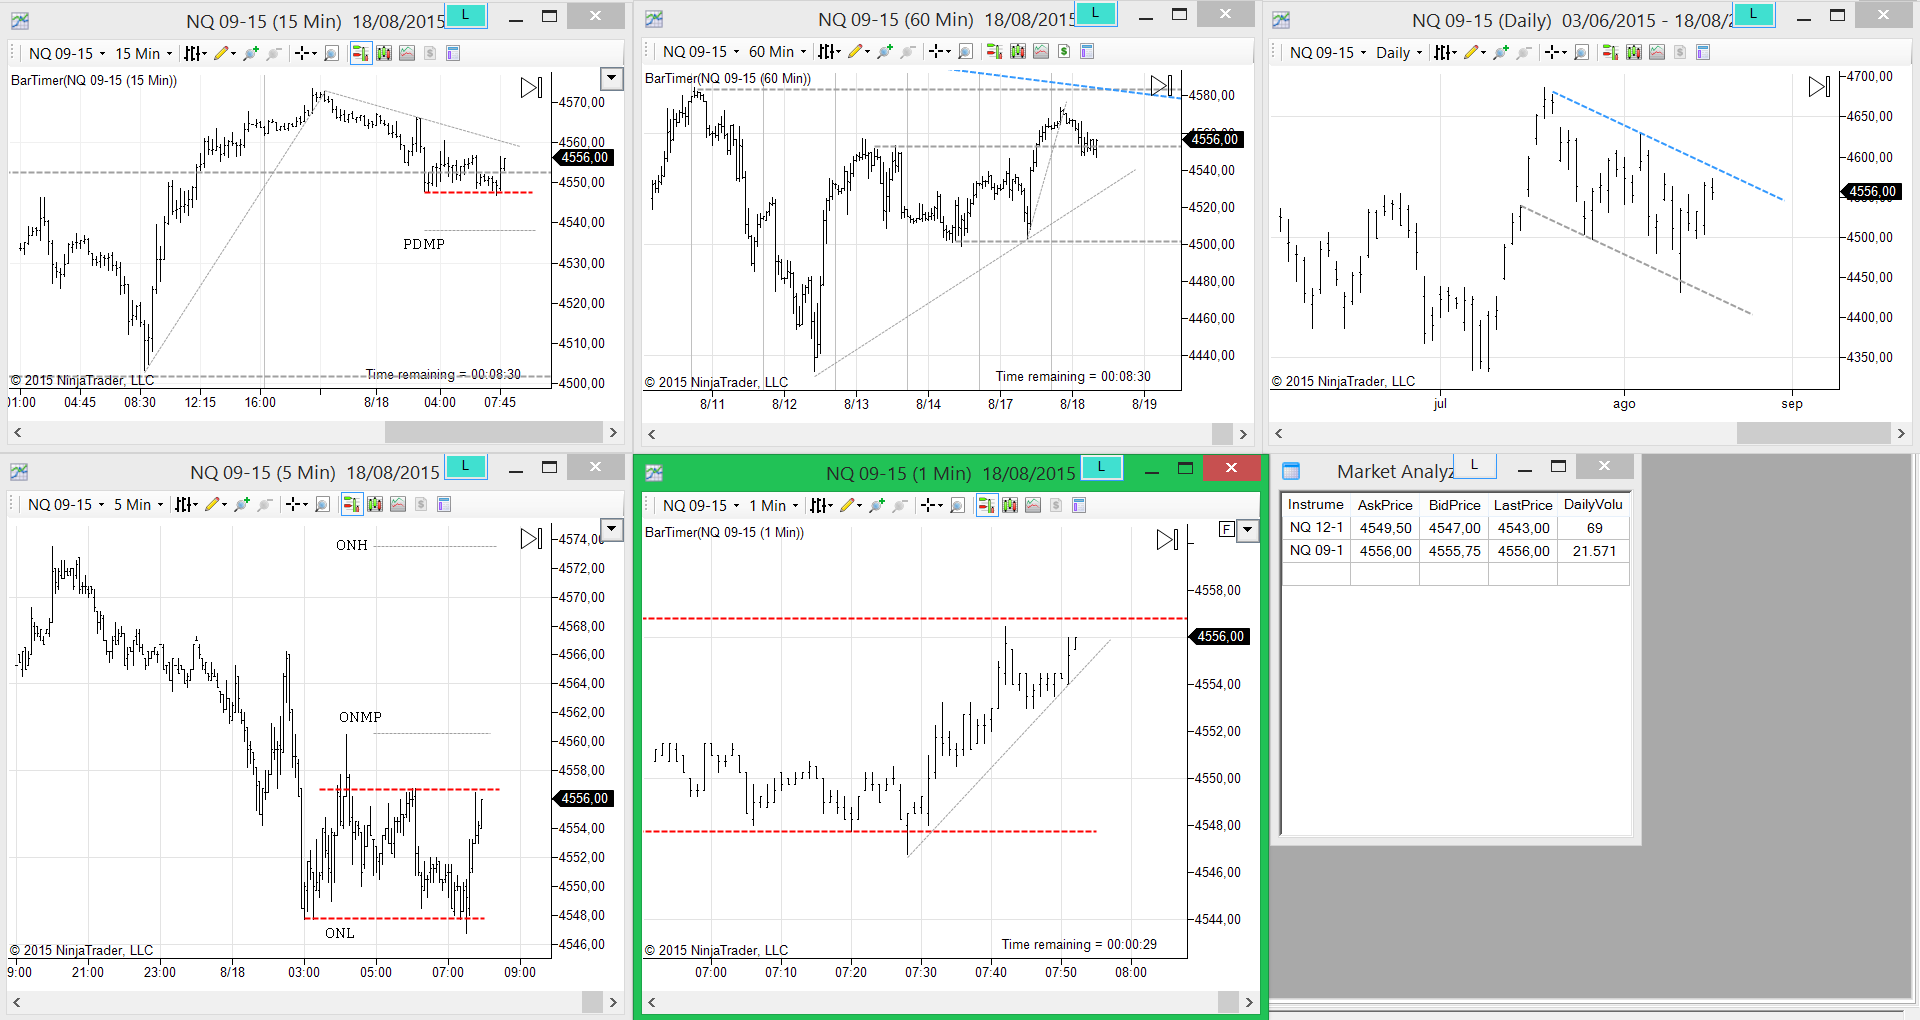
Here are my PM Levels.
Daily/hr
15m/5m
Although I am in the observation phase I will “venture into hypothesizing about what price is most likely to do ” as Db said. All of this in order to make sense of the PA in interest zones. Here is the chart.
0833: The buyers test the UL of the TR, but they didnt hold an the price falls
0834: The price is close to the MP of the range
0837: If the reversal was taken, at the open maybe now that the trade has lifted off then we could change to a higer bar chart 5m
0840: the sellers found demand in the MP of the TR (grey zone)
0842: the price makes a LL, waiting to see the next action
0845: Next level 90
0847: A decition must be made
0853: the price makes a HL, after reaching the 91,75, close to the LL of the TR AT 90
0855: A HH is done and an uptrend is going on, however note that the PA is around the MP of the TR
0859: If the long was not taken you must wait until the extremes for other oportunity
0903: The price is unable to keep going higher and it remains around the MP 00
0905: Hinge - maybe
0910: the price continues its upward movement (waiting for the UL)
0914: LH - LL
0916: The price falls again around to the MP of the TR
0921: Hinge within the TR
1003: Looks like a BO from the Hinge
1008: FBO
1017: BO to the upside - 1021: FBO
1037: The PA is listless and I am losing focus so I am done for today.
04_03_2015.thumb.png.a4af09e1eefe182fac6e42d52b84c0fd.png)
04_03_2015.thumb.png.df7537405768a7e44fe1eae2239eb7ad.png)

-
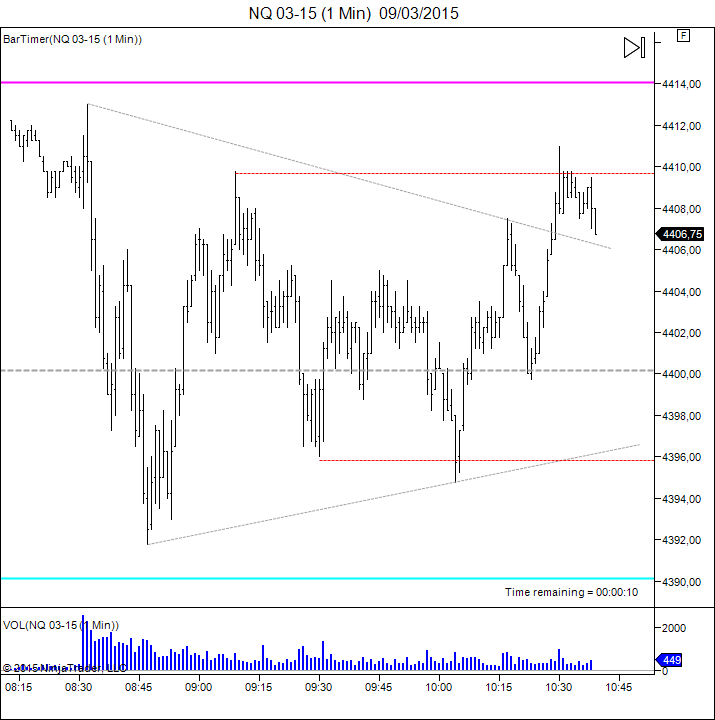
I got some issues with my connection but here is my PM levels
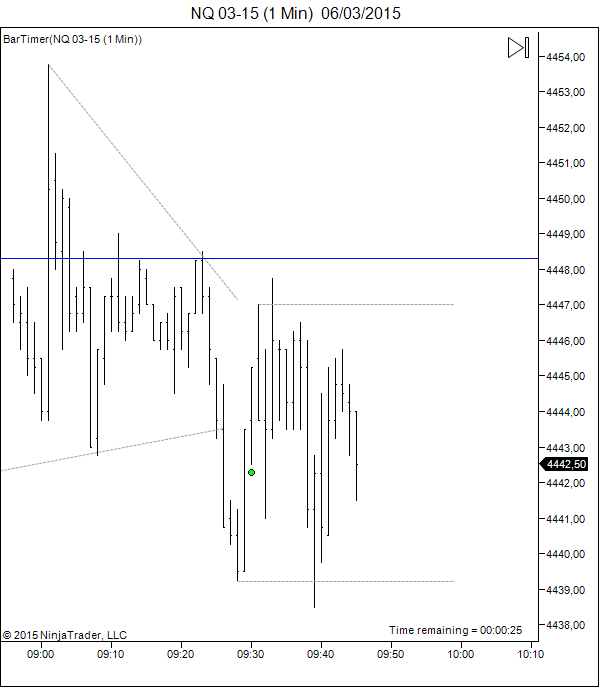
0930: At the open the sellers try to take the price out of the hinge, however despite the fact the RET is triggered the price rebounds to the MP of the hinge
0938: The sellers make a new LL, waiting to see what happen next
0940: there is no follow through and the price is retracing
0945:
0945: Hinge
0949: price BO from the hinge and is approaching to the PL
0950: new LL RET needed in order to confirm the sellers willingness
0951: Note: close to the PDL 32,75
0953: the sellers found R at 34, waiting for the RET
0954: The price reversed almost all the previous down movement and a HH is done (V reversal)
0955: The price breaks above today high
0956: Note: at this point is at the PA is in the middle of the ON activity and the middle of the PD
0959: RET triggered
1000: RET confirmed
1002: The price reverses the up movement and a LL is done.... V reversal??
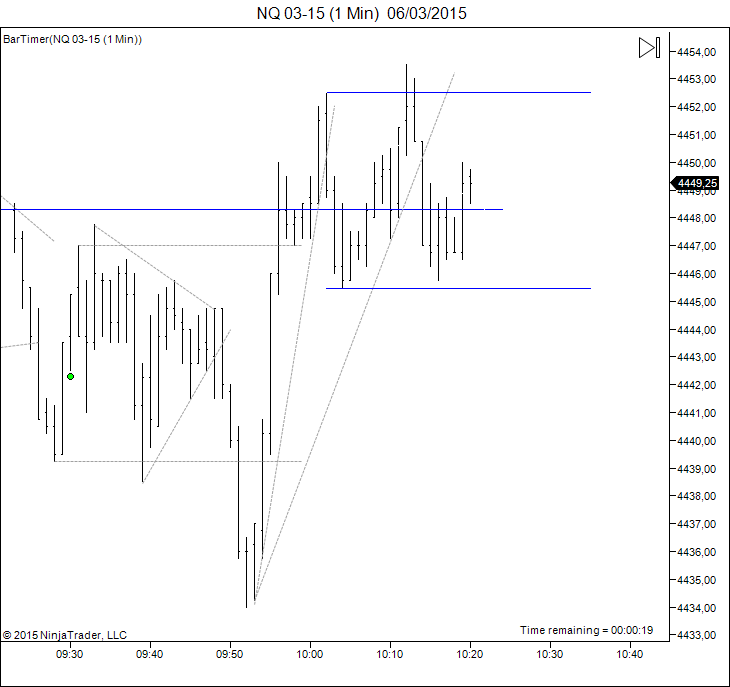
1006: A LH is done (RET triggered)
1007: RET discarded, and the price goes up
1010: HH is done
1017: DL is broken waiting for the RET
1018: RET triggered and discarded - Range is defined
1040: Hinge within the TR
1056: After a FBO to the upside the price falls
1108: the price breaks the PDL
Note: waiting to see what happens at this zone
1122: next level 19
1131: the price goes below the 19, these are the zones where the attention must be (thanks Db for your words, sometimes my focus is at the trees not at the forest.)
1143: the downward trend is consolidating
1153: HH
1158: HL --- Hinge
1205: Uptrend is going on
04_03_2015.thumb.png.4728fc430a9eba43f007b6926feb33a4.png)

-
Hi.
PM levels
Today I coudnt see the market live, but the observations for today are in ET
http://www.elitetrader.com/et/index.php?threads/price-action-nq.289300/page-8#post-4094511
04_03_2015.thumb.png.25e77831457f1a08949dcf2fd45a3aad.png)
-
Good morning.
PM levels
0928: previous to the open the price is located around the MP of the PD
0930: At the open the buyers test the MP of the ON action
0933: The sellers reverse almost all the previous up movement
0934: However the buyers try to take control and a RET is confirmed
0935: The buyers are trying to reach the ONH
0937: For the moment an uprend is going on
0938: RET triggered
0940: RET confirmed, although a HH was done there where no follow trhough
0941: The price is below the ONH
0945: the price BO the ONH, a RET is needed in order to confirm the buyers willingness
0947: The buyers are finding R in the PDH
0949: RET triggered and confirmed
0950: the price BO above the PDH. Waiting the RET
0954: RET confirmed, but no follow through
0955: The buyers show their strength and the uptrend continues
0958: the buyers make a new HH, waiting to see the next action
1000: The uptrend continues with ease of movement
1003: BO the DL or only a spike?
1007: The price starts to retrace
1008: LH, RET triggered and confirmed
1010: Although a LL was done there were no follow trhough and the price rebounds (TDTDB)
1011: The price makes a new HH
1014: Although a HH was done there were no sustantial advance
1019: A HH is done. Note: the speed of the price is lower now than in the first 60 minutes, there is a shortening of the upthrust
1030: The price found S at the principal DL and a HH is done
1031: There is no ease of movement to the upside and the price breaks the DL
1039: LH is done and the RET is triggered
1040: RET discarded, and a range is defined
1051: there is a listless downtrend in comparison with the uptrend of the beginning of the day
1053: the price found S at the previous SL
1102: Hinge within the TR
I'm done for today, thank you guys
Db one question, I´m still learning the abbreviations. what is the meaning of OS?
02_03_2015.thumb.png.ea5dd6865e7f8c071fb3241900de6da5.png)
02_03_2015.png.1e02f5ae1227f7dace7f1ef7c2c313af.png)
02_03_20152.png.db6166689ef9258662b074516166724e.png)
02_03_20153.png.7ff10cf69e23411b55d7039b6f1cabc5.png)
02_03_20154.png.77add57bce0757509f13b8aebade5b40.png)
-
PM levels
0930 The buyers test the UL of the ONR,
0931 Later on the Lower Limit is tested
0932 The buyers try to take control and BO to the upside --- the RET is needed in order to confirmed their willinggness
0935 Ret triggered and confirmed
0936 There were no follow through and the price goes to test the BO
0939 The BO is tested and the buyers take the price above the previous High -waiting for what happen next
0941 although a HH is done the price falls TDTDB
0943 The price falls into the range
0944 Testing the Lower limit of the ONR - BO - RET is needed
0946 Middle of the PD
0948 The sellers find demand and the price retrace
0950 Testing of the BO
0953 RET Triggered after testing of the BO of the ONR
0955 Ret discarded
0956 The price returns to the Range after a HL and a HH are done
0957 Looking at the 50% of the previous down movement from 62 - 46
0958 The price continues with the uptrend
1000 Trying to reach the day High also at the UL of the ONR
1004 May be a reversal could be traded here??
1005 the price seems to fit into the range again
1008 MP of the ONR the price rebounds
1012 Hinge
1013 the price continues the down movement
1015 the price starts a retrace testing the previous BO of the Hinge at the ONL
1017 All this action is made inside the ONTR
1021 The price is making an uptrend inside the range, but until the moment there is no enough strength
1025 At this point I would consider a big Hinge, until the moment of the day
1038 Hinge + Range = Observe and wait
1048 Closer to the UL of the Hinge and Range, Hinge redrawn taking as reference the gringo chart
 (attached)
1104 the price seems to BO from the Hinge, but is also around the MP of the ON range
1130: the price BO to the downside - Waiting for the Ret
1132: Ret triggered - waiting for the confirmation
1133: Ret discarded - HL is done
1135: The price is testing the MP of the ONR
1141: Is important to note that all the action is given within the range
1148: That is all for today, I need to do other things, here is the last chart until now
PS. Thank you Db and all of you guys this is a great way to learn. See you on monday
27_02_2015.png.0ca4acf958109fcc0dfccbc7248a58c2.png)
27_02_20151.png.4ad7dc0b88ace24a75306d853b0a4523.png)
27_02_20152.png.b8af0c9a9df96919aa8470cc634e24b6.png)
27_02_20153.png.12e667f8bf7843ab7d927ae116affa5e.png)
27_02_20154.png.bad35a4209a216bf7f5242e5855bb081.png)
-
PM chart 0913
A master chart is fine, but for the open, all you need is the last few hours.
1419: woud it be consider as a DTDB??

-
Hi Db, I know I am in the observation phase but I fell in the temptation to trade today
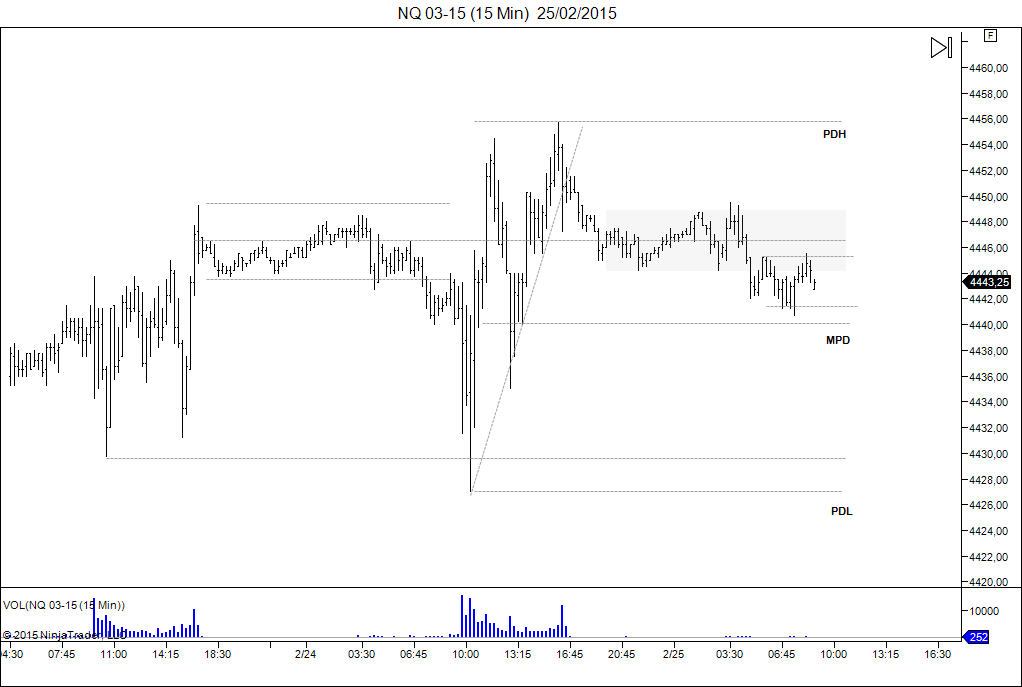
and I found it very interesting. I would like to know your opinion regarding the next chart. Especially the point 3 23_02_2015.thumb.png.fc61a3569ad903b61868dd6b2dde0bc8.png)
-
Hi Db, I know I am in the observation phase but I fell in the temptation to trade today and I found it very interesting. I would like to know your opinion regarding the next chart. Especially the point 3
23_02_2015.thumb.png.1dc5aac44743ee36fe8604cc42ce0c43.png)
http://www.traderslaboratory.com/forums/attachment.php?attachmentid=39047&stc=1&d=1424708838
Sorry Db is my first time posting here I think I posted twice ... sorry :doh:
Well, here we get into personal preference again, not dogma. I prefer not to take trades that are re-entering the range because they tend not to have much going for them, and I don't like scalping, However, this is something you'll have to test then decide whether or not to pursue it. It's easy enough to test.
Ok Db, thanks for your point of view

04_03_2015.png.554dd89cf7a2ab6528c551d637de240e.png)
04_03_2015.png.589c2659f8a79c40a237d932ec705a44.png)
04_03_2015.png.067240ea731cf4973ba079399b2a7525.png)
04_03_2015.png.9e1f1b92e81b556b84d8607580f51464.png)
02_03_2015.png.b7bce64a0c9a8c8756ad206968cd5d9a.png)
23_02_2015.png.1dafa9edbd91b471fd7d26ac9e145210.png)
23_02_2015.png.91d9b409f52a89c6f2c4f6fa06cc4b6d.png)
Trading the SLA/AMT Intraday, Part II: Questions and Discussion
in The Wyckoff Forum
Posted
Trades. 19/08