
Welcome to the new Traders Laboratory! Please bear with us as we finish the migration over the next few days. If you find any issues, want to leave feedback, get in touch with us, or offer suggestions please post to the Support forum here.


alleyb
-
Content Count
95 -
Joined
-
Last visited
Posts posted by alleyb
-
-
idetsc
Consider the following that range extention outside the first hour denotes a day structure that is anything but NORMAL. So if a ND is defined as first 60 minutes contains the day then consider how often that a ND actually occurs.. Looking inside my Data WareHouse I find that ND occur on 6.47%. Normal days are the exception range extentions is the Norm
-
The key is risk management and that is dependent on many things, sometimes Time, sometimes Speed of Movement, sometimes Volume, sometimes Dollar amount, sometime Cycles of X Number of Bars, sometimes Seasonals, sometimes Percentages of Movement and sometimes Percentages of Account with regard to Leverage and/or Drawdown sometimes external events both known and unknown
The advice of IF THIS THEN THAT is good but you also need to know how to program position sizing according to market condition. Not all trades are equal in terms of risk some are scalps some are swings. Differentiate this and then you have an ALGO to take on the very best
You state support and resistance. Define them. for me in MP then support is defined as when the buyer is able to halt the selling and the buyer is able to overwhelm the seller and stabilize the market in terms of directional trade. and obviously vice versa. This could be as simple as saying if X bar rotates in the opposite direction and exceeds then.... However how would you deal with a bar that opens on a high and closes on a low followed by the next bar that opens on the low and closes on the high
Define your Timescale, Define your Basis for Order Entry and Order Exitt, Define Rsk Proposed,
write it out and apply the logic
-
jthoma. that site comes from Erik who is one of my students from some years ago
-
RJ u will find them in the following thread http://www.traderslaboratory.com/forums/f6/mp101-mp102-alex-benjamin-5482.html
any issues let me or soultrader know
-
alleyb wrote: "Back in 1986 Pete Steidlmayer wrote about needing to wait for the first 4.5 hours in ES to pass before establishing a trade and as per usual I contend nothing has changed over the years"I wasn't aware of this. Market Profile trading per Steidlmayer generally waited/waits this long before doing a trade?
Dogpile
If I may be so bold to interpret
what Pete was trying to suggest was to isolate the Initial Auction versus the Secondary Auction. He started out life in the Bean pit and the curtailed trading hours versus the Stock Indices meant that one had less time to establish the IB. Less time to isolate what he referred to as the Other Time Frame Participant or in terms of English the more dominant guy with the longer time frame / horizon.
He observed that in Stock Indices their (OTFP) influence was early (and patient) in the Initial Auction and therefore frequently was responsive in nature where they would attempt to influence the auction. This influence had far greater impact later in the day where anxiety was introduced into other traders who started to clock watch and therefore the OTFP had greater influence and by default less patience and more initiative in nature.
The interpretation is that one wants to be on the side of the dominant trader who frequently is the commercial and therefore identified as CTi2 in the LDB and therefore be in the direction of the trend.
Clearly within the 24 hour market one needs adjustment, flexibility and evolution. The issue for many is their need to trade and trade often and the degree of volatility, which really needs to be refocused and renamed velocity (maybe more about this another time), is forcing traders into the minimum trend almost in a copy cat version of The Algo. One should as in real life learn from the mistakes of ones peers rather than copycat. Stepping back from the voodoo chart as I have frequently referred to the 5 minute chart can produce a bigger picture scenario that identifies the 5 point trade rather than the 0.5.
Pete effectively suggested that less is more in terms of waiting for the trade that had setup and probability stacked heavily in your favor and this becomes more important within a world that is demanding instant gratification rather than tantric reward.
-
I have the data but regret it is only available to my website members. I am always willing to learn from those with greater statistical analysis skills and especially from those whom have programming skills but am open to suggestions
-
The chart is annotated
-
Well I score 50/50 today cos my weekend chart above did not suggest the buy the breakup . I was focusing too much on the potential to pull back to the 1104 level but there in lies the issue of annotating charts in advance. The breakup for me today occurred at 1125.25 and then again when the Dow took out 10656 in dec
I guess the first clue was probably the lack of lower rotation in the Nasdaq
Until the mkt close back below 1124.25 and then breaks 1117 then some previously non posted upside targets exist which center around 1172. The FED tomorrow will set the tone for the rest of the week. Fully expect a liquidity mirage trade to the upside
-
The link is good when I access it
maybe use IE as your browser. Let me know how you get on
-
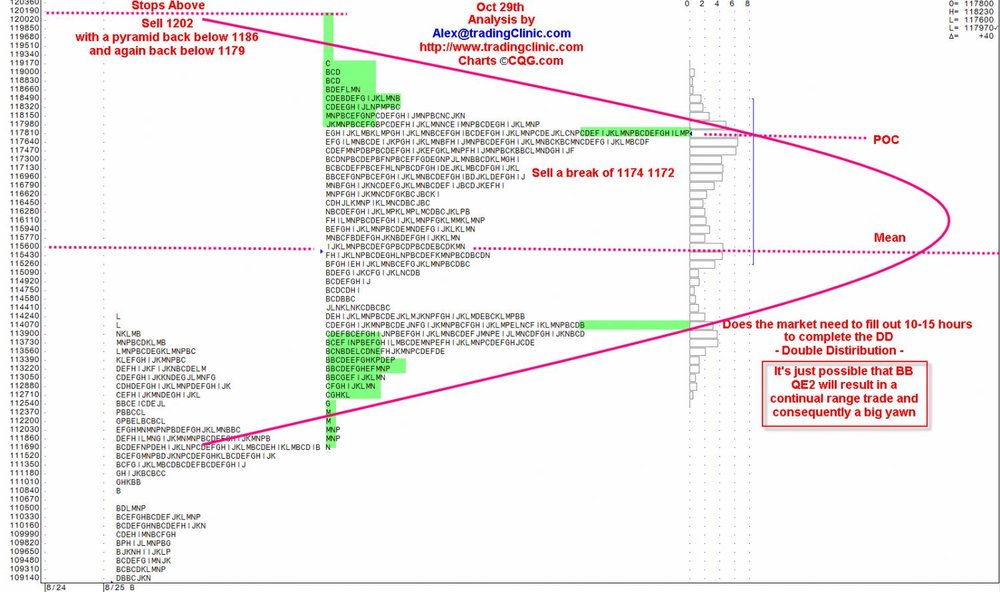
I thought the chart was quite explicit
The chart says it the break of 17......
But the chart also says that there is a symmetry requirement for time spent at the slightly higher levels of 21ish
so the trade is to fade the slight upmove and then pyramid the downmove. In the event that the upmove does not occur and the break takes precedence then either you have an initiative trade at the break or you wait for the break and sell the uptic or you wait for the downmove to occur and pick up a trade on the low 02-04 of the move for retest back to the 21-22
as to why few have commented that might be because of the thread title in that it is not attractive but I have also found and it is just one of several reasons why I have been absent from posting is that in reality people just want to be told when to sell and when to buy. They dont really care about the reasons but again read the chart comments slowly and as I said I thought I was quite explicit. Time required to be spent at............. then break of ...............
-
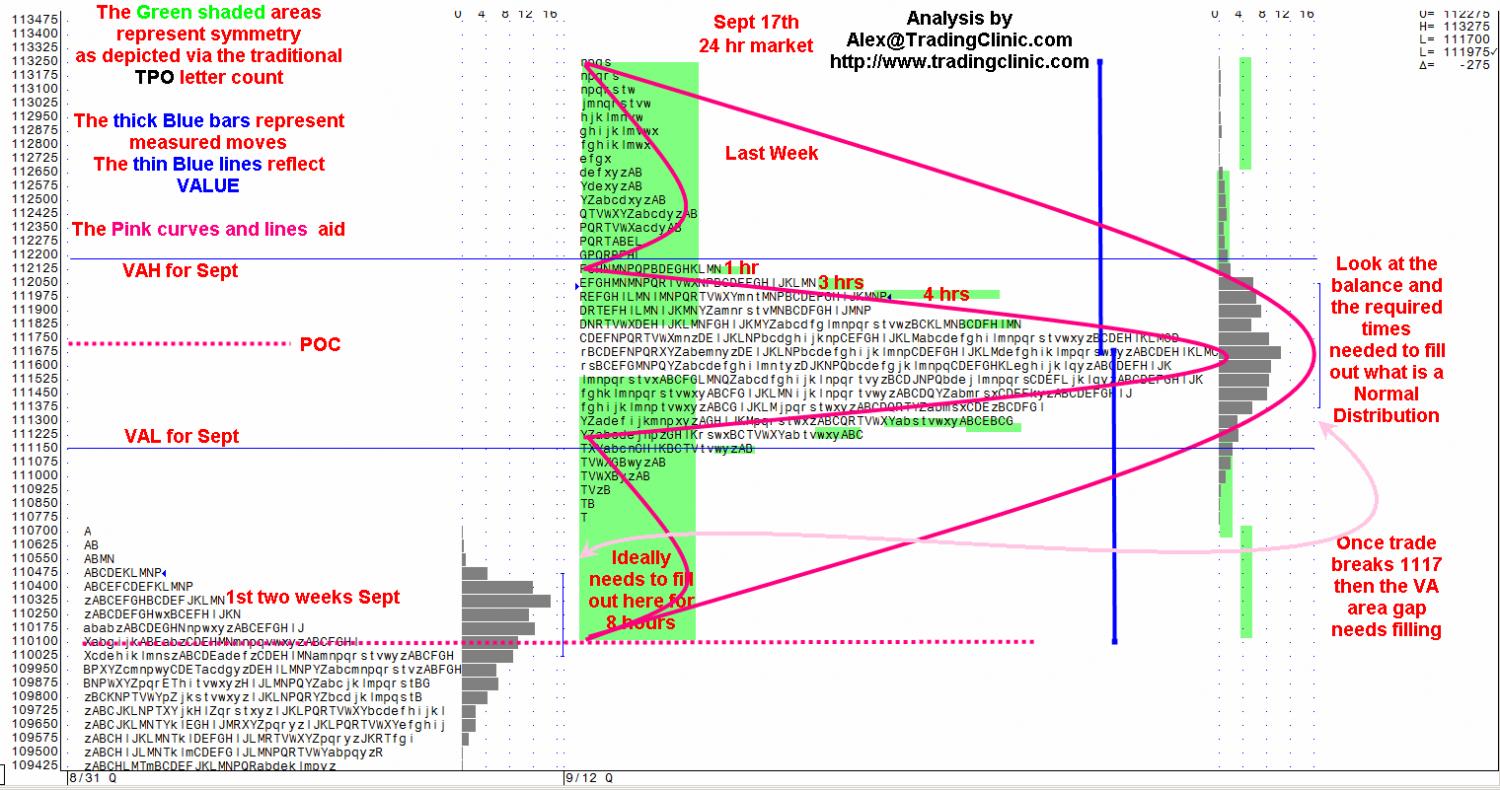
I have been conspicuous by my absence from open forums for a while for personal reasons
but I put together a chart for the December E-mini S&P500® futures contract as at Sept 17th 2010. This is a classic composite chart for the month of September 2010 splitting out the first 2 weeks versus this last week. There has been a glorious bull run where the entry was on the close of August 31st or on the open of September 1st and from which there were other long entries but all on an initiating basis (IE Going with the momentum break-outs) until finally most of the upside measured move targets were met on Friday Sept 17th. I, consequently, decided to post this chart and to try to provoke a decent conversation
-----------------------------------------------------------------------------------------------------
This question was posted on the internet in an open education forum:
Has Alex changed the way he uses and establishes targets? I am familiar with his 2 day IB for the weekly IB and the first 5 days of the month for the monthly IB but he seems to be using other forms of targets with the profile. I couldn't follow it completely due to the chart size etc........does anyone have a summary of these techniques?
-----------------------------------------------------------------------------------------------------
The discussion about measured moves involves much more than purely a mathematical equation. For one needs to involve analysis of regular session versus 24 hour markets. Is there really a difference in terms of market structure IE types of day (Day Type), direction (Horizontal vs. Vertical), so called points of control (POC), value areas (VA), so called unfair highs and lows (STDs) and even do the differences of 23.25 hours versus 7.25 hours really matter.
It by definition invokes emotional discussion about the role of the floor (CME PITs) versus Electronic Trade (Globex® Platform) - Does the floor influence trade flow or even impact it. Does the floor even need to exist, is it a dinosaur, and last but not least
discussion about traditional MP® (Market Profile) analysis versus volume spread analysis (VSA) or volume weighted average price (VWAP) or even cumulative volume delta (CVD), - (PS: a note to Market Delta® (MD) and Trading Technologies® (TT) as they battle out the patents on this one - Pete Steidlmayer actually was the first to initiate this but he called it order flow information (OFI) - as well as on balance volume (OBV) or anything else that one can think of that represents trade transacted at the price whether it be looking at aggressor trade (hitting the bid or lifting the offer) or passive non aggressor trade (Resting orders which by definition are limit buys and sales)
The basic function of traditional MP® (Market Profile) and the adjustments that I and TradingClinic.com ( Tradingclinic.com ) created versus some new way is in essence about the evolution of traditional open outcry - which had also been superseded countless times from its hey day of the coffee shop in the 17th-18th centuries, then the bourse in the 20th century, then the office with telephones and telexes then the closed network medias like Reuters dealing terminals - versus today's electronic connectivity where speed of transaction has contracted to not just milliseconds but nanoseconds. Where the order book can be analyzed on the fly and a decision even whether to accept an incoming order is figured into the algorithm.
Is traditional MP® (Market Profile) under threat and potentially obsolete as Pete Steidlmayer suggested in a magazine interview article in 2006? I beg to differ but recognize think the original basis without any change, in a world that everyone requires some formulae to operate, is probably so. After all Steidlmayer and by definition Dalton stated that the profile was just a way of organizing data. So with that in mind I decided from the mid 1990s that all one needs to do is re-tool and adapt and be flexible to the changing environment. This gave birth to my concept of incompleteness and measured moves. With measured moves one could then establish order entry IE rules for both responsive and initiative trade within any timeframe whilst taking into account the pattern of the distribution
I believe with my concepts of incomplete days and therefore incomplete distributions that I have adapted and changed and completely adjusted the original MP basis to enable MP to continue to compete with the algo whereby adding in measured moves, pattern recognition, symmetry and equilibrium creates a visual methodology which has objectivity built in that can compete with the machines in terms of where and when to buy or sell and especially importantly where to exit.
Over many years I have been building an extensive database that I prefer to refer to as a Data Warehouse (TCLDB) which serves two functions.
1. To figure the dominant and therefore largest market influence (historically referred to as the commercial or CTi2) and to establish what their position is and the degree to which they were long or short as well as to establish the change of position or market exposure
1a.This is not just related to the CTi2 but I have a methodology of viewing the others and their relative exposure incorporated within the data
2. To extract probability scenarios based off time, news and/or other external influences
The TCLDB together with my adapted MP techniques have a major difference compared to Steidlmayer or Dalton and this is to add in order entry and perhaps more importantly exit. All this together re-enforces the concept of a trading plan and aid in the decision process of being a discretionary trader
-----------------------------------------------------------------------------------------------------
Specifically to JohnE and his question
I have not changed the basic premise of
first 60 minutes = IB daily
first 2 days of week = IB weekly
first week = IB Monthly
first month = IB quarterly
first quarter = IB yearly
-----------------------------------------------------------------------------------------------------
From this stems all the measured moves however flexibility is paramount as it is more complicated than just this. To find the levels one has to look at the distribution, the VA and POC and this gives rise to additional targets beyond the pure mathematical calculation of 60 minutes or 2 days worth of data and therefore this then shifts the exactness of time. IE does a week actually begin on a Monday? and many other questions such as what is the dominant influence in terms of day trade time?
From all this someone I dare say will say something along the lines of analysis by paralysis could come about from all the above.
Several answers come to mind.
What do you think the machines are doing with their algos? and more importantly with the extensive work over the years I now have a data warehouse (TCLDB) that is unparallel in that I can compare what came before to what comes after. I can explicitly state the position of the market. I can extract a probability for tomorrow in terms of direction percentage chance for success and much more. I have automated much of the hard work needed to extract this but more needs doing and although I will get there if anyone is an excel VBA programmer and would like to get me there quicker then please get in touch alex@tradingclinic.com or skype alleyb_uk

-
I have studied MP and there are some things that I could never figure out. Maybe some nice people can answer them?1. Why is price attracted to a balance area, a high volume area?
2. What about the subjectivity with MP. You have splits, merges, profile, default 30 min, etc?
3. When you are looking at MP and you see some high volume nodes and no volume profile in between them I have heard people rationalize that its going to move between there because there is nothing to stop it. Then price moves away from one of the two high volume nodes and moves back to it its because high volume nodes act as magnets? Huh?
Dan:
1. High volume is what occurs at the nodes or POCs. It is where the majority of buyers and sellers are comfortable and perceive fair value within their respective timeframes. You will find that price is attracted to high volume areas to enable the maximum number of buyers and sellers to be satisfied because the POC represents one of several forms of Accumulation/Distribution
2. Yes there is a degree of subjectivity in MP when looking at distributions. Don Jones's concept actually originates from the CBOT Handbook of looking at distributions in terms of 5, 20 and 60 day distributions - (which in turn originated from Ricahrd Dennis and Bill Eckhardt of Turtle fame who used as just one of their entries a 20 day breakout - I should add that it was not as simple as just that though) - and as previously remarked this represents 1 week, 1 month and 2 month trading. The only issue I have with this is that it is static and markets are not static. They are dynamic and therefore frequently you will find that the distribution is shorter or longer than the aforementioned timeframes.
3. Price will tend to migrate between one set of high volume node to another. In its purest form it would represent a double distribution. Several reasons. One could be because in a rising market the shorts from the lower node are happy to regain their original sale for a breakeven cover. Another would be because people tend to remember time spent at a price. It imprints indelibly on the eye and creates a notion of value. The longer time is spent at a price the more it becomes accepted by the majority as value thereby creating a natural effect of on reversals to then revisit the high volume level - horizontal - rather than stopping initially somewhere within the speed area - vertical -
Dan to divert slightly from your questions
Value is in the eye of the beholder for different timeframes represent different behaviour patterns which also then leads one into the realm of anyone's need to transact. For example a day trader runs out of time and therefore no longer cares about exact entry or an institution looks at volume purely from the capability of being able to transact
The current S&P distribution started with the gap up on Feb 25th 2010 and possibly finished on Friday April 23rd for it reached perfectly into a MP measured move. This would be 40/41 days whereby any daily close below 1190/1191 would confirm the top.
Why?
Because 1191 is the top of Value for the current distribution
One can therefore infer that whilst above 1190/1191 and more especially closing above 1208.5 that the top is not in and a further push to 1231 or on a panic around 1241 instead
Dan you have opened an interesting discussion point that I am only really doing minor justice to for in reality a whole chapter could be written about the exact points you raise but I hope that in some small way I have answered a degree of your questions and am happy to continue the dialogue
-
If anyone is experiencing difficulties with the TraderLabs links then contact me direct via email: alex@tradingclinic.com
-
I would suggest that you also search Traders Lab threads for further answers to your question but briefly construct the Profile into segments of 240 minutes . establish the 3 time zones of the world, Asia, London, US and split at those time periods EG London starts at 2am ET although there are some who would say earlier and the US starts at 8am ET although again some would say 8:20am
Know that the Tokio fix occurs at 8:55pm ET and the London/US fix at 11am ET unless it is a quarter end when the fix occurs much earlier in the day
So now you have the outline your next question will be what about volume and the answer to that is Tic volume in FX is a better proxy. Yes one can use the futures market as a microcosm but in reality the number of times you see the offer lifted in what appears to be size and then no trade occur for 2 minutes followed by a move of several tics/pips lower will show you that volume in FX is probably irrelevant to us mere mortals who are not privy to the flows
Obiously the auction does not always follow 240 minutes and as in every market it behoves you to drill down to the timeframe that the market is auctioning and this may very well be a 1 minute at report times. A word about which: EU reports are followed avidly by US traders but in reality very few of them are relevant to EU traders where US reports hold much more sway. The reason is that although fundamental analysis is employed in FX the dominant order flow is much more important
Lastly the FX market can at times be very illiquid and whats referred to as a stop hunt occurs in the path of least resistance. These frequently occur in the Asian timezone
-
the open for a month is the first print on the first day of the month. You can for example check this by going to the exchange website . A monthly chart is constructed by taking all the daily charts and taking the open on the first day the close on the last day and the maximum and minimum amplitude in between. same principle for weekly
-
Koifan and when did you attend under my mentorship for I don't believe we know each other
-
Koifan and what you dont know is that his original study several years ago came as a student of yours truly
-
its available inside my website along with the largest source of all material on MP that can be found anywhere either web or library
-
The currency futures have a layer of bids and offers stacked which are arbitraged back to cash via the Block Trade and the EFP (Exchange Futures for Physical) facilities. Many retail accounts don't seem to understand this factor and believe that the volume is the be all end all. By way of explanation I will give an example. the market is say 1.2888-1.2889 in a 16 x 4 market. someone sells 22 lots all filled (due to a submarine bid) at 1.2888. the next quote is 1.2887 - 1.2889 in a 4 x 9 market. 1 lot trades down into the bid at 1.2889 and seemingly the market then shoots up to 1.2893-1.2894. The volume watcher would have seen volume come into the left hand side selling but the price action is now higher. this reflects the cash market where say 1.2893 is given and 1.2899 is then paid. What I find useful is not the volume per see but the pattern from the tic volume histogram that in MP terms I can associate with certain types of behavior. I agree with previous tail and dog comments. The only time knowing volume in FX is going to give you an edge is when you are a spot jockey and see the customer flow particular the orders coming from SAFE the Chinese vehicle or the Red Man (who is in fact a lady) the chief FX trader for the Russian Central Bank that is probably the worlds largest customers right now.
-
MP101 & MP102 are
MP101 can be accessed by clicking on the link. No registration is required
http://www.tradingclinic.com/mp201/mp101_benjamin_021705.wmv
MP102 can be accessed by clicking on the link. No registration is required
http://www.tradingclinic.com/downloads/mp201/MP102_media/MP102.wmv
MP103 is available but regrettably only for a fee
however clicking on the following link will give you access to a free no registration required 3 hour presentation done June 6th 2008 to my subscribers
http://www.tradingclinic.com/oneoff/special20080606/special20080606.html
-
meyer99 the world has effectively moved to 24 hours on most things so the short answer to your question is yes, BUT there's always a but isn't there.. but its also about flexibility of finding the auction time period or timeframe (that I shall refer to as ATP) of the moment. so for example global volume generally is light in Asia, heavy in London or EU and heaviest in US product in the US sessions. Please do not confuse what I have stated. Light in Asia etc I am talking all product not just US.
Re ATP then when a Government report comes out a 240 minute chart is not really going to be much use but a 1 or a 5 or a 10 minute maybe. Then again for example there are other times where a reduced ATP is appropriate for example as London opens at 7am local (2am ET) with the official Stock Market opens 1 hour later then again a 240 minute chart is useful for the backgorund but does not help with the minute to minute foreground
With regard to counting - what you referred to as Profile Evolution - this is a very viable alternative to the LDB (Which btw the CME will reenact as from Feb 9th BUT only for CBOT product and at a mega cost of 500 bucks per month). I have found that my methodology A. is cheaper, B quicker C just as accurate (for I used to check back to the CBOT raw data that I used to have access to) D. easier to understand
How far back you ask? I look at distributions in all ATP so for example in CL right now I would look at the ATP from Jan 6th to present from Jan 26th to present Feb 6th by itself
ZN I assume is the Notes in which case I would currently be looking at Nov-Jan, and Feb 2nd to present
-
With the de-commissioning of the CBOT website
Here are the permanent links to MP101 and MP102 direct from my own website
MP101: http://www.tradingclinic.com/mp201/mp101_benjamin_021705.wmv
MP102: http://www.tradingclinic.com/downloads/mp201/MP102_media/MP102.wmv
these will run in a standard MSFT player: Still having issues then let me know
-
use 240 minutes in the MP rather than the traditionasl 30 minutes and/or just use the NY traditional floor session but in 30 minutes
-
What you write about "trend" back and forth Hlm is true just as with a 1st STD there are 2nd and 3rd STDs making up the 1st, 1st and 3rd making up the 2nd and 1st and 2nd making up the 3rd.
Markets move in even the minutest Time Frame through a back and forth action where some part is Responsive and some part is Initiative creating the vertical and horizontal planes. The key to this is understanding the Dominant Trader Time Frame and therefore influence and therefore what and how your reaction should be.
Certainly your statement about Time Frame is valid and your description of a Trend day is true BUT and this is where I differ in stating that today was a Normal Variation Day with Trend Like Properties we did not close near the low but fully 1/3rd of the way back up. The Days Range was 46 points wide with the settlement 15.5 points off the low but if the close had been in the lower quadrant then I would have stated that the day was a full on Trend Day.
The original question raised was how to identify a Trend Day early on and at risk of repeating myself once the interrogation of the Data Warehouse has extracted the probabilty scenario then the proof is via the volume pattern together with the answers to the various questions of where is the market in relation to.......and yes what Time Frame....Short, Medium, Long Term.....Time Frame is about advantage, acceptance, fairness and NEED to trade.

Market Profile Confusion
in Market Profile
Posted
By definition price always preceeds Value and Value catches up to price
The question you need to answer is whether the market action is at below or above VA and therefore what is the response whether that is horizontal or vertical. Timeframe is important within this and an application to understanding the 4 steps of market activity is useful to establish the answer