
Welcome to the new Traders Laboratory! Please bear with us as we finish the migration over the next few days. If you find any issues, want to leave feedback, get in touch with us, or offer suggestions please post to the Support forum here.


piginaust
-
Content Count
4 -
Joined
-
Last visited
Posts posted by piginaust
-
-
Thanks Tams. I am using Multicharts. And thanks for the ps. I will use the code tag next time. :crap:
if you are using tick bars (ie sub-minute bars),you can only draw trendlines with MultiCharts.
Tradestation cannot do sub-minute analysis.
ps. when posting codes, please use the code tag. It is the
 key at the top of the message frame.
 -
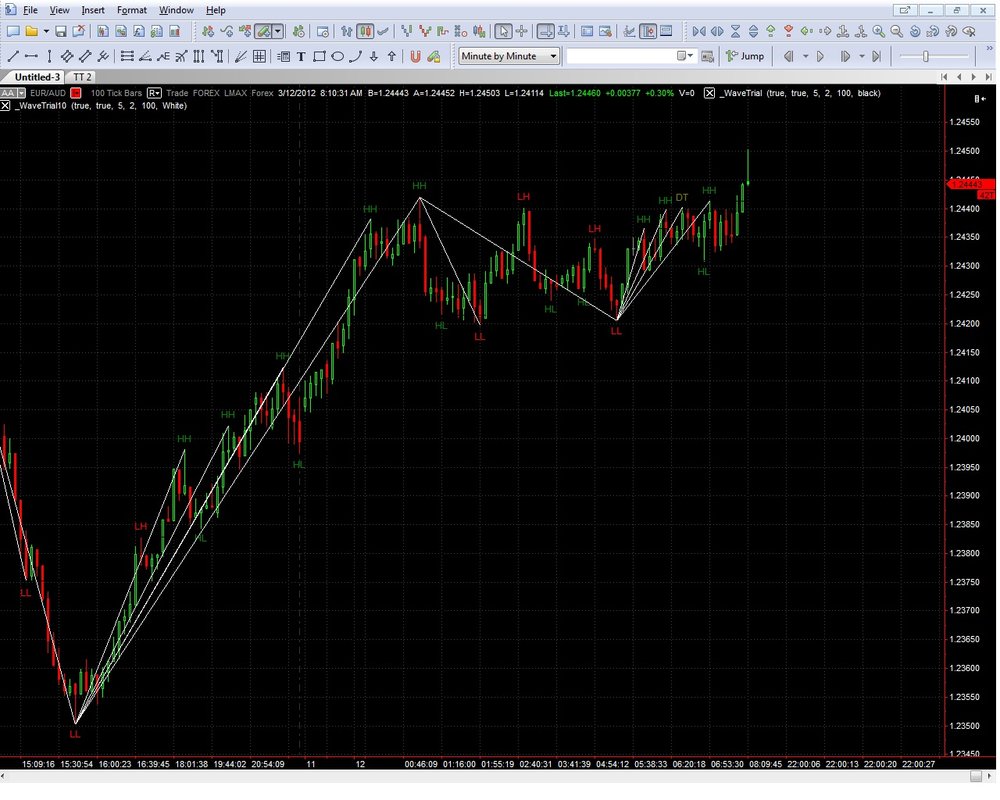
Thank you, OneSmith. I attached the result of the your code.
There are some lines which did not connect from the previous HH or LL. I will try to find the code myself and ask for help again if required.
Really appreciate your help.
input: stren(5), rStren(2);
var: hd(0), ht(0), hp(0), ld(0), lt(0), lp(0), hid(0), lid(0), HH(0), LL(0);

if PivotHighVS(1,H,stren,rStren,rStren+1)>0 then begin
   hd=d[rStren];  ht=t[rStren];  hP=H[rStren];
   if hp>hp[1] then begin
       HH=1;
       if HH[1]=0 then hid=tl_new(ld,lt,lp,hd,ht,hp) else tl_setend(hid,hd,ht,hp);
   end else HH=0;
end else if PivotLowVS(1,L,stren,rStren,rStren+1)>0 then begin
   ld=d[rStren];  lt=t[rStren];  lp=L[rStren];
   if lp<lp[1] then begin
       LL=1;
       if LL[1]=0 then lid=tl_new(hd,ht,hp,ld,lt,lp) else tl_setend(lid,ld,lt,lp);
   end else LL=0;
end;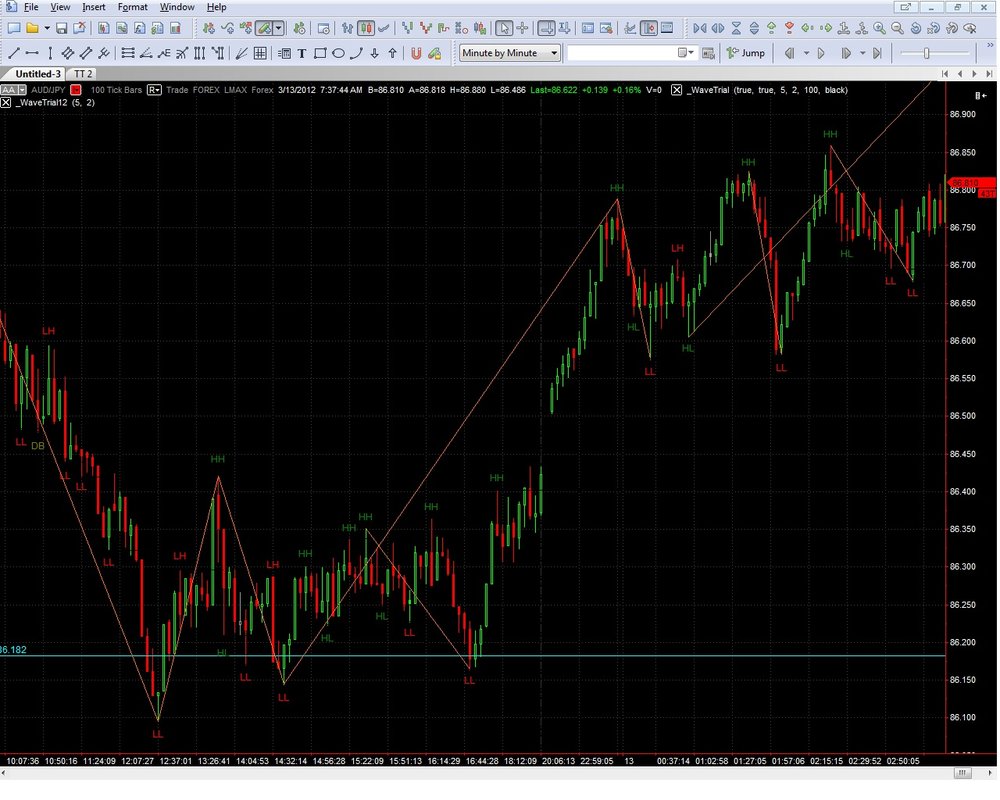
-
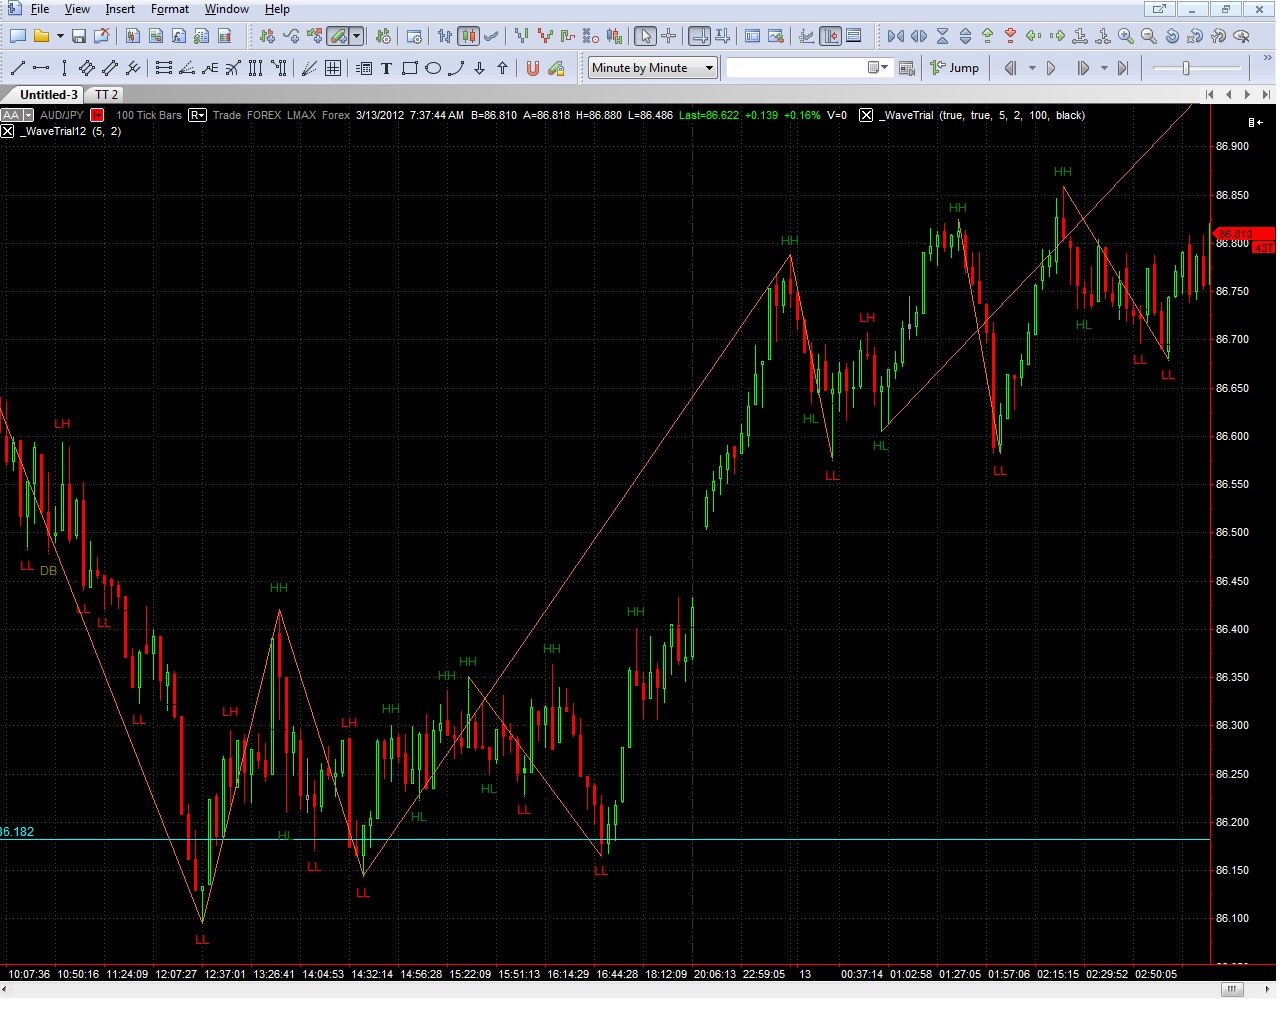
I am trying to develop an indicator that will show a trend line from LL to HH and from HH to LL.
My coding is as follows:-
inputs:
LeftStrength( 5) ,
RightStrength( 2 ),
LookBackLength( 100 ),
line.color(White);
variable:
id.tl(-1),
HighValue1(0),
HighValue2(0),
LowValue1(0),
LowValue2(0),
Var1(0), Var2(0), Var3(0), Var4(0), Var5(0), Var6(0),
Var7(0), Var8(0), Var9(0), var10(0), var11(0), var12(0),
oPivotPrice1(0), oPivotBar1(0),oPivotPrice2(0), oPivotBar2(0);
// to find the HH
if PivotHighVSBar( 1, High, LeftStrength, RightStrength, RightStrength + 1 ) <> -1 then
begin
HighValue1 = PivotHighVS(1, High, Leftstrength, RightStrength, LookBackLength );
HighValue2 = PivotHighVS(2, High, Leftstrength, RightStrength, LookBackLength );
if HighValue2 <> -1 and HighValue1 > HighValue2 then
begin
Var1 = Date[RightStrength];
Var2 = Time[RightStrength];
Var3 = High[RightStrength];
end;
end ;
// to find LL
if PivotLowVSBar( 1, Low, LeftStrength, RightStrength, RightStrength + 1 ) <> -1 then
begin
LowValue1 = PivotLowVS(1, Low, Leftstrength, RightStrength, LookBackLength );
LowValue2 = PivotLowVS(2, Low, Leftstrength, RightStrength, LookBackLength );
if LowValue2 <> -1 and LowValue1 < LowValue2 then
begin
Var4 = Date[RightStrength];
Var5 = Time[RightStrength];
Var6 = Low[RightStrength];
end;
end ;
id.tl = Tl_new(var1, var2, var3, var4, var5, var6);
TL_setcolor(id.tl, line.color);
The result of the above code is that it draws a trend line between each HH and LL (as shown in the attached JPG).
However, the indicator that I want is to draw a trend line between the latest LL and HH. I tried to find a way to do it but due to my limited programming knowledge my effort is in vain.
If I am not clear, please let me know.
Thanks everyone in advance.

Help on Coding in Multicharts
in Automated Trading
Posted
Thanks OneSmith. The code is amazing!
I cracked my head for the last two days and still was not able to find one. Now looking at your code, I don't think I can get it by myself!
Thanks again.