
Welcome to the new Traders Laboratory! Please bear with us as we finish the migration over the next few days. If you find any issues, want to leave feedback, get in touch with us, or offer suggestions please post to the Support forum here.


ThePistonDoctor
-
Content Count
4 -
Joined
-
Last visited
Posts posted by ThePistonDoctor
-
-
Holy cow, guys! I must say this is probably one of the most defensive forums I've ever posted on, and I post on a LOT of forums in all different subjects! After the first reply I actually wrote it off and just decided not to bother responding because I got slammed so quickly for posting a link to an external site, but after coming back and seeing two pages of people misinterpreting what I said I think I need to reply.
First of all, regarding Bulls on Wall Street I wasn't trying to plug them. I only mentioned the name because I have been following Kunal and some of the other members there on Twitter for months, tracking their progress, and they are great traders. Also I wanted to give people an idea of the type of trading I was doing and I thought providing a link to the site so you could check it out might give you a little more info on my style/background/habits. I have no connection with them and couldn't care less whether anyone here tries their services, it was just a friendly suggestion...lol
Whew, now that that's out of the way, let's get back to the original topic. I wasn't trying to turn this into a debate about whether candlestick indicators work or how often they work of whether candlesticks or bars or lines are better. What I wanted to understand is the THEORY.
hindsight......there is nothing about the shape of the hammer that signifies selling has reached the end.its only a visual representation of what has happened.
But don't you think that the pattern indicates something? For example at the bottom of a 4-5 day downtrend on a daily chart, if a green hammer forms, and the next day price gaps up and closes positive for the day, does that not signify that sellers have become outnumbered by buyers (that's why the price was pushed back up from the low the previous day and closed closed above the open, forming the hammer)? Of course it doesn't GUARANTEE reversal of the trend, but isn't it a good indication that the ratio of buyers to sellers has changed, and that we might want to start watching a 30min or 15 min chart for breakout opportunities?
There is some great research out there that most candlestick patterns only work around 30% of the time. As SIUYA mentioned we can find the patterns in hindsight, but have you ever tried to trade based on the patterns?Yes, I just did yesterday actually, I'll show you at the bottom of this response.
I'd agree that you cannot ONLY use these patterns, you need to combine them with many other aspects including what the market sentiment is, support and resistance, moving averages, news, political turmoil, earnings history, etc. All I'm looking for is information on why they work when they do. I don't buy that it is completely by chance that these things work, even if it's only 30% of the time. There has to be some underlying reason.I would argue that the patterns do not work consistently enough to generate overall profitable trades. Just remember that you can find a chart to prove any theory once, but can it be traded in foresight not only in hindsight. Just remember that when these "Guru's" write their books and publish their articles they only need one chart that looks good to prove their point, what about the other 500 times that it does not work?Just some food for thought.
"Candlestick Charting Explained" by Gregory Morris has a section where he discloses his research on the subject....in my opinion its useless but there you go...My question is why don't you do your own research so that the result refects your target market and most recent data?
Thanks for the reference even if it wasn't for me. I'll check that book out. You can never have too much information (as long as you know how to manage it all and weed out the useless stuff, lol)
You can talk about putting your candlestick in context,but why not just focus on context,and forget hindsight analysis?
Because I believe that hindsight analysis on the right timeframe proves that a certain type of behavior has occurred and can potentially give an indication of what will happen in the future based on that behavioral change.
Such as?The only indicators (if i would call them that) i want to use are leading indicators.
You're right, I've seen it. Of course you will see all kinds of crazy patterns on 1min, 2 min and 5 min charts and they're usually meaningless, but it doesn't mean that the information provided by the patterns over a larger timescale isn't useful. I'll provide an example at the bottom.If you want to see how many times a hammer fails drill down to low time frame charts.In other words a daily hammer on big volume could mean reversal,but what it really means is resting orders.Somebody big bought there (or maybe covered shorts) because that was the price they were willing to trade at.That is what i'm looking for,a price level i want to trade.How the price is represented on a chart can often be a sideshow..mesmerising for some.Still,you can always stare at charts for a few thousand hours "until you get it" as the advice often goes.
Yes! Thank you, this is the kind of answer I was looking for. That was one of the reason I suspect that they work (sometimes): that they signify what is going on between the buyers and sellers. In the example of a hammer, it seems to indicate that the bears tried to push the price down further, but weren't able to keep it there because there were too many buyers propping the price back up. That, I think, is what forms the hammer which is why it would be important as an indicator on a daily or weekly chart, and could signify it might be time to start looking for intraday setups to enter into a position.As we know we can't use the same indicator (or variables) for different instruments, markets because they usually show different behavior. I use candlesticks because I think it summarizes the fight between the buyers and sellers. However I don't think 5-min chart is enough for this purpose. Candlestick formations can tell you what will come next but where they occur is important as well...Personally, I think candlestick patterns and formations are junk science, or voodoo theory... whatever!Now now everyone, I know most of you probably use candles, so don't beat me up. When I started trading, there were no candles, I learned on bar charts.
Even today, if I had to start over, I would choose bar charts. I can read a bar easier than a candle, and with candles, they take up too much real estate screen space. I prefer to see much broader price history to gain a "feel" for the current trading environment. With candles, I just can't feel it.
My typical chart attached.
I think that's just personal preference. I personally like candles better because the bars seem so convoluted and provide the exact same information. I find candlesticks easier to read. Besides after all, if you drew a rectangle connecting the opening and closing ticks of a bar and filled it in, you'd have a candle...

Sorry, there will be no more of that. Already explained at the top.Hmm, first post on this forum and you're plugging a vendor. But I digress.
See, I disagree. I think it shows you exactly that. That there was a specific relationship between the number of buyers and sellers during that particular time period and that's the reason the candle formed in the way it did. Interesting you also agreed about the self-fulfilling prophecy bit. I'm sure a lot of technical analysis is really just a self-fulfilling prophecy because there are so many technical analysts.That's just it -- it doesn't signify that at all. It only tells you that within a predefined time frame (say, from 10:00 to 10:15), that the market traded down, and then at 10:15 it is basically trading at the same price it was at 10:00. Now, you may attach some interpretation to it, that selling has reached its end, or that buying is pouring in, but that of course does not make it so. I will plug my thread I started called "The Close of a Bar is Meaningless" -- search TL for it if you'd like, where members discuss items related to opening and closing prices of intraday bars, and this certainly affects how you view your candlesticks.
Another point for the "it represents the relationship between buyers and sellers" team I guess. Thanks for your response and that suggestion. I will check out Heikin Ashi candlestick charts!I think the value in candlesticks comes from turning the data into a visual representation of traders sentiment which you can then assess at a glance. One thing to try are Heikin Ashi candlestick charts. With these charts you aren't concerned with the pattern of each candle, rather the direction of the trend because Heikin Ashi take into account the prior days bar with each new candle's open starting from the midpoint of the prior candle. Check it out, see if you like it.---------------------
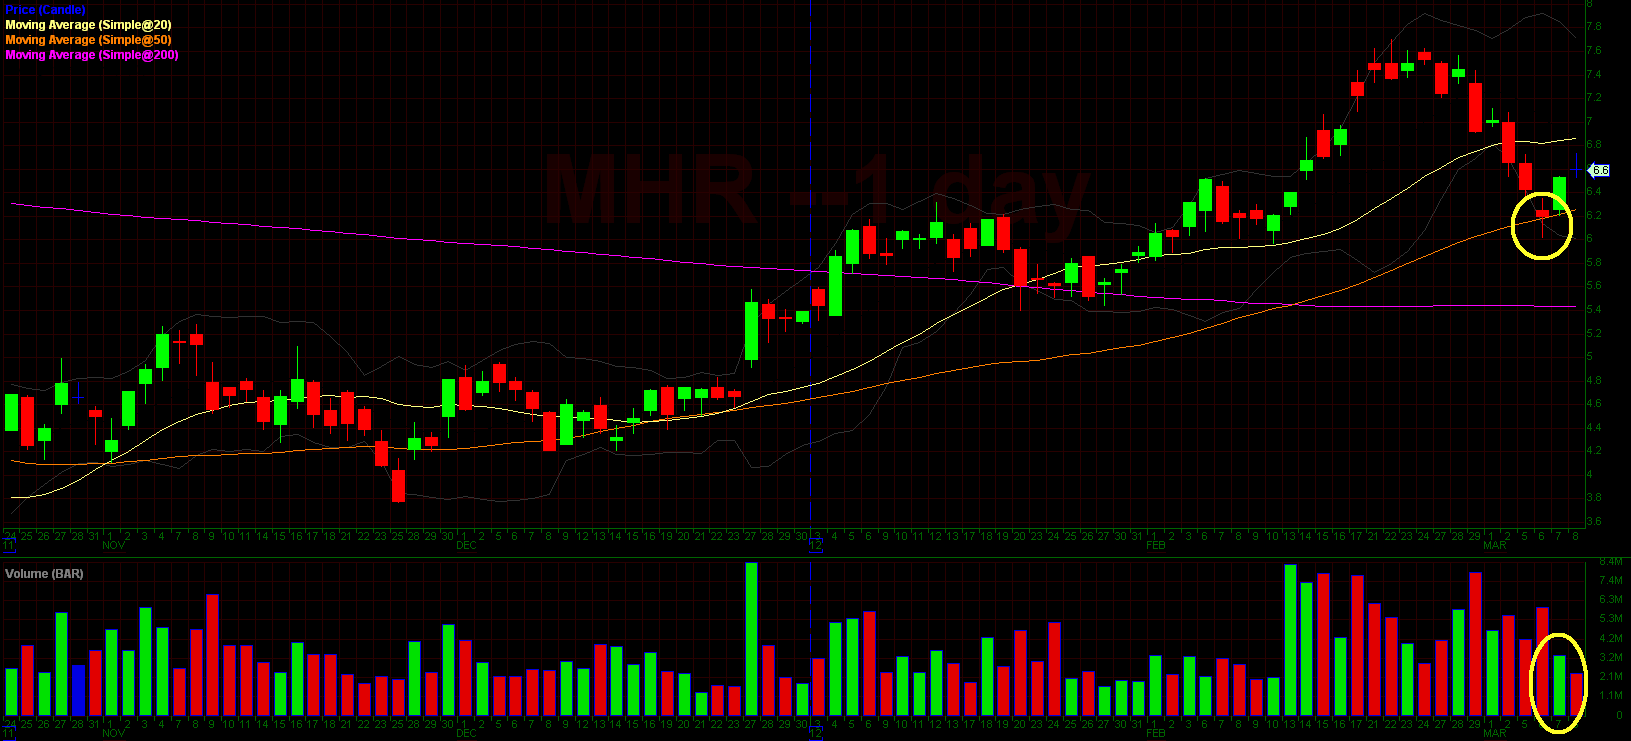
Ok now after a long post, here's an example of me using a hammer:
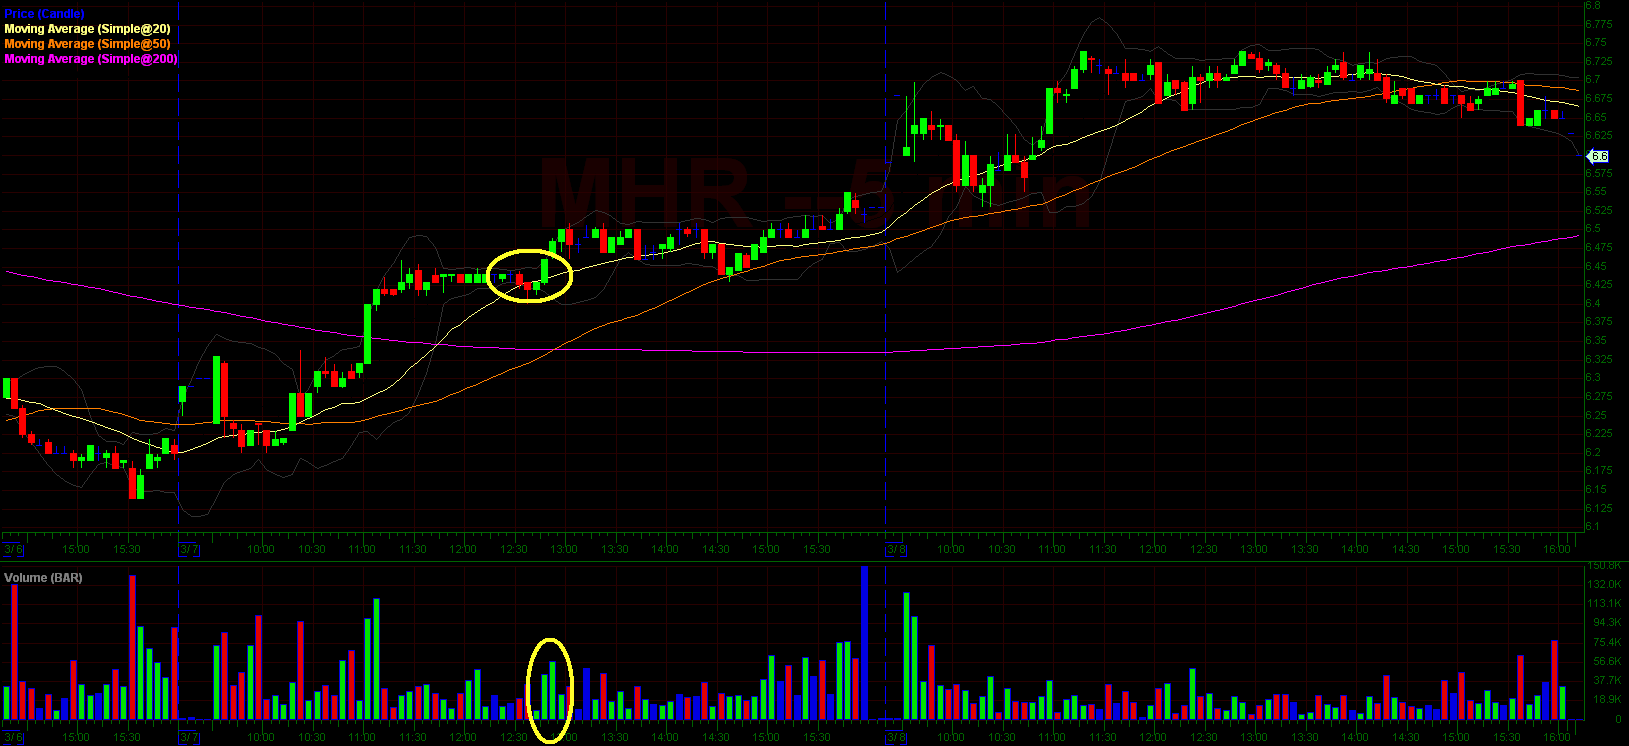
This is MHR. I noticed that on 3/7 the chart had formed a hammer on reduced volume from the days before (circled in yellow). That triggered me to watch for a breakout spot on 3/8 if the price started rising. Sure enough on 3/8 the price opened higher and so I went to a 5min chart and watched for breakout opportunities. I actually attempted to enter this trade at $6.35 because that was the break of 3/6's low, but I couldn't get filled there. I waited for the chart to stabilize again and then entered just before 1pm at the breakout of the $6.43 level. I sold some of my position this morning for a small gain at $6.73 and am still holding the rest. So I guess all I'm saying is it seemed to work this time, and I don't buy that it was just due to chance. I have done this many times in the past with this pattern and am almost always successful. BTW when I said I am a fairly new trader I meant a fairly new daytrader. I have been swingtrading for years.
Anyway, here are the charts (as attachments so they're not gigantic in the post), sorry for the looooooooooooong post!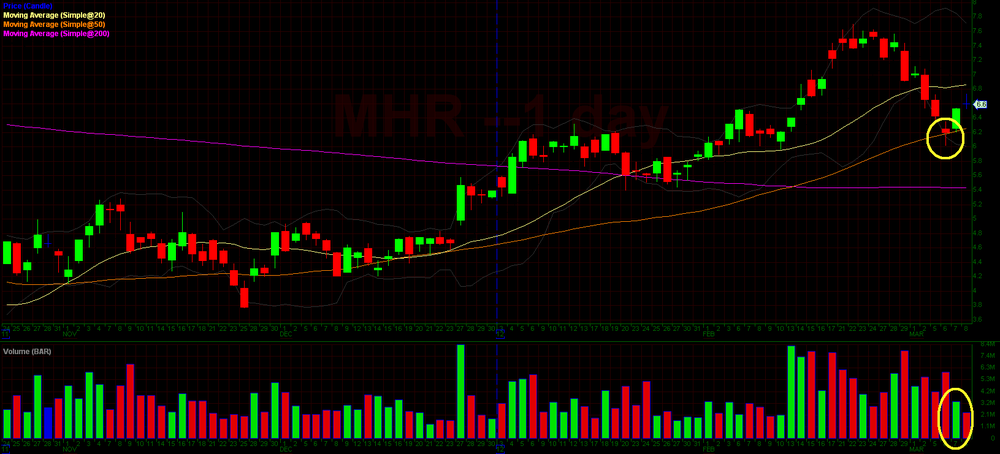

-
Really? No one?

-
Hello everyone!
I'm a fairly new trader working with the wonderful crew at Bulls on Wall Street (check them out at http://www.bullsonwallstreet.com if you've never heard of them, Kunal is a great guy!) and I am curious about the theory behind candlesticks patterns and why they work. I've read a couple of threads on this forum about the theory, but I haven't found quite the answer I'm looking for.
Let's take a hammer for example. Assume we are considering all the other parts of the market as well, i.e. perhaps the price is at the bottom of a downtrend on both the daily chart and a 5 minute chart, bouncing off a significant moving average or support level, and we see a useful amount of volume relative to the average. At the bottom, we see a hammer, then a reversal on the 5-minute chart into a significant and profitable uptrend. My question is this: We all know the pattern works in the right situation, but why? What is it about the shape of the hammer candlestick that signifies that selling has reached its end and buyers are now pouring in? I guess what I'm saying is, in a hammer, you know that the price over the period of that candle tried to go up a bit, then was dragged way down, but then came back up to close near but above the open price. Does that simply mean that at the low during that candle, there were a lot of buyers which brought the price back up? Is the rush of buyers at that low on the hammer the reason we assume that price has reached its bottom and that a reversal is imminent?
I'm just trying to understand more of the theory behind why these patterns work, and I think it is a good thing to understand rather than just blindly stabbing at a pattern (even if you're considering the other elements) because someone else told you it works. Also, is it possible that part of the reason these patterns work so consistently is that there are so many people that just blindly buy that idea, making it a self-fulfilling prophecy?
I'm really, really interested in understanding the underlying logic behind this, and I think it would yield a really good discussion. What are your ideas on this topic?
Thanks!!!
Underlying Theory Behind Candlestick Charting?
in The Candlestick Corner
Posted
wrbtrader, I guess if you want to be nitpicky it's more of a morning star (even though they are both bullish and represent mostly the same market sentiment), To be fair, you can do a Google Image search for "morning star candlestick" or "hammer candlestick" or any other pattern and find 100 different interpretations of what they should look like, but I digress. What's important IMO is that the person using them understands what they represent. Anyway, I suppose joshdance is right on the volume issue...my bad :-P. It was late at night and at the end of a very long post when I circled that. Regardless of all that, it seems I've got my answer to the original question.
I was just asking in general why people think candlestick patterns work (when they do). I think you're all right that, in general, the reason they are somewhat reliable is that they prove the psychology of the market is changing in some way. However, maybe the reason they are unreliable as some of you have said is that they are not used correctly by many of the people who use them. Or maybe they just simply are not reliable indicators.
Personally I don't buy into them too much, I tend to trade more support/resistance breakouts and press releases/earnings, but I do find them useful when looking for the end of a trend for swing trades. For daytrading, I hardly touch candlestick patterns and rely almost entirely on support, resistance and volume as well as matching breakouts on multiple timeframes. A couple more examples of swings I've traded recently are CIEN (short on 2/24 after a shooting star) and SZYM on 3/7 after a hammer on 3/5 and then a might tighter trading range on 3/6 and 3/7 (you can check out the charts on any charting site )
)
Thanks for the link to priceactionlab.com. I checked it out and yeah, multiple candle patterns can definitely be more telling than a single candle. When I trade a hammer or a doji or anything at the top of bottom of a trend, I ALWAYS wait another candle or two before entering a trade because I don't believe that a single candle can tell you anything without being put into the context of what's around it!
For what it's worth, I sold the rest of my MHR on Friday at $6.92 for a 7.6% gain and may be buying back in on Monday if it breaks the 20dma and can built support there! :-P
Thanks for your responses everyone.