
Welcome to the new Traders Laboratory! Please bear with us as we finish the migration over the next few days. If you find any issues, want to leave feedback, get in touch with us, or offer suggestions please post to the Support forum here.


dbntina
-
Content Count
61 -
Joined
-
Last visited
Posts posted by dbntina
-
-
-
Frank,
Yes I think that will be easy and quick. I will try to do that tonite.
You are asking basically what % of the time for each day of the week and all days that the high to low range is >= to twice the IB?
That should be pretty simple if that is what you are asking.
dbntina
-
Frank,
I had it in there initially but deleted it out because it didn't make sense. You would actually probably want to cumulate from the last period forward. It might be confusing to some so I basically left it out.
Take it easy,
dbntina
-
Okay Frank here it is:
Same spreadsheet but I have added a 2nd spreadsheet to find out what periods the following corresponding high/low was made if the other was formed first.
Enjoy

-
Frank,
I think that is easy for me to run. I will do that and post.
Let me make sure I understand:
Show a table just like the others that basically shows the period that the opposite high or low forms after the first high or low?
I can run that and post if that is what you mean.
dbntina
-
forsearch, I sure could have used 30M bars and saved some time. It's funny how I can miss something so simple :doh:
-
Yes I do comic
-
All,
I wrote some code in tradestation and outputted it to Excel.
Using 5 minute data on the ES.D I basically calculated the stats that a high or low or either was created in the different time periods.
I kept it simple using periods:
A is 9:30 to 10
B is 10:01 to 10:30
and so on to
N is 4:01 to 4:15
Hope some of you find this helpful.
:thumbs up:
-
Thanks Blowfish...hope everything is going well for you man!
-
Frank,
That is the awesome thing about what BAMBOO on the tradestation forums created. He is an awesome programmer and he created a programming addon that allows ts programmers to do some really cool stuff.
One of those is to be able to pass variables stored in one chart to another chart in a different timeframe.
That is how it is done. The information updated on a 1 tick chart is passed to the 2 minute chart for example and plotted realtime.
Basically it is all in how you call the variables. I am calling the variable from the tick chart. You have to understand BAMBOOS ADE to be able to do it properly because technically you could do it in reverse like you said.
It is fantastic. Thanks Bamboo!!
-
no ...pvp must be collected live. Don't refresh the window either or I think you might lose the data as well if I am remembering correctly.
Everything else can work historically (VWAP and SD bands).
good question
-
thrunner...thanks for your post. I don't believe they will need to install ADE. When the indicator was created it included all of the ADE information needed to run the indicator. It appears the people that I had been sending it to did not need to install ADE either.
HOWEVER I could be wrong. Thank you for posting the information just in case it is needed. I appreciate you including that.
dbntina
-
Okay...first let me apologize to all the people that have written me emails and requested the updated code that plots the PVP with VWAP and SD bands. I have used the code last year and was quite happy with it for the ES and NQ. It seemed to be very accurate and was working well for me. To make a long story short I have been very busy with a new job and a new addition to the family. I am posting it here so that anyone who wants it can get it as I don't check my emails here frequently enough and don't have time to keep sending it to different individuals. The code is open and free to all to change and repost and take as your own. I am not able to support it. I don't even remember what I did and don't have time to try and figure it out again. Here is what I was emailing to everyone with the code I will post:
Here it is. Only works for 1 point or less...easy to fix just too lazy and got other stuff going on right now. (Instruments that trade in increments of 1pt or less NQ and ES .25 for example)
Open up a 1 tick chart and insert the pvp indicator on it ('DBPVP'). Then you can minimize.
Then open up a minute chart (whichever you follow 2min, 3min, etc) and insert the VWAPSD indicator 'DBVWAP_SD', you should be able to see pvp, VWAP and SD bands....
The array is set to 3000 for s&p and nq as they have 4 ticks per point. If you use er2 or something with 10 ticks per point you will want to double array to 6000 and inside the indicator change all start points to half of that from 1500 all of them would now say 3000. Or just make it real big for everything...
For some reason...in the code you will see two places where there is "minmove/pricescale" depending on how your computer sees minmove...you will need to have just minmove or minmove/pricescale. So if it is not working properly it will need to be just minmove...haven't figured out why that is...we are still in beta testing but hopefully it works for you.
Let me say thank you to BAMBOO's ADE that I used for Tradestation. It is fantastic! Thanks to everyone here on this board for their sharing and help.
Hopefully this can be of use to some of you. Again I am only posting as I can't keep up with all of the emails. Also, this is what I used for myself on NQ and ES. Use at your own risk.
Also, you can add as many SD bands as you want. Inside the VWAP indicator you just add another plot statement just copy the 2SD plot and change the multiplier from 2 to 3. I saw someone wanted the 3SD as well. Please if someone else can assist other members with their questions I would greatly appreciate it...I just don't have the time right now. Thanks in advance.
Good luck to all and your trading.
I won't be able to answer any questions as I can't even remember what I was doing...I apologize in advance...it has been about 6 months.
-
Blowfish,
I did look at the post...the short answer is I really don't know which one is best. I am basically going off of what JPERL is saying as he came up with the idea and methodology.
I don't understand the reasons why a certain method of the four would be used over another or the mathematics behind which one is used and why. Then I am not sure about what amount of margin of error is significant. So I am not sure at all....sorry.

Didn't want you to think that I was ignoring your post...not much help sorry,
dbntina
-
Oh..Okay I almost got really excited!
dbntina
-
Blowfish,
How did you get the volume histogram...is that multicharts or something else?
dbntina
-
Jerry,
Thanks a bunch...makes sense that the fact that it is dynamic it changes how you have to approach the distribution.
Very interesting and it is starting to come together.
Thanks for sharing,
dbntina
-
Jerry,
Thanks for the replies...
One more question....
The VWAP/PVP relationship determines the type of distribution (skewed/symmetric). Ignoring for the moment that as price moves around and volume trades that the VWAP and PVP change and the distribution will probably change. Let's just say we were pretty sure that the type of distribution was not going to change for the next hour.
The point I am trying to clear up is that price in relationship to VWAP determines trend. I don't think it does. I think the distribution function itself tells you the trend bias and strength based on the strength of the skew. Who cares where prices are in relationship to the VWAP. I am thinking in terms of statistics and occurences in relationship to the disribution function.
Where price is located in relationship to the distribution function is what is important because it tells you what kind of a move you can expect...an example might help:
If we were in a symmetric distribution:
If price is at the higher 2SD or 3SD or the lower 2SD or 3SD we would want to trade short or long with the expectation of prices moving back to the VWAP/PVP correct? The closer that price is to the VWAP/PVP the less of an edge we have....because price is where it should be in a symmetric distribution near the VWAP/PVP. So we definitely wouldn't want to take trades with the expectation of price moving away from VWAP/PVP towards 2SD/3SD or farther with the expectation of trending movement correct? Price location only tells us the edge we have and what we can expect to most likely occur within that distribution. The closer price is to VWAP/PVP the less of an edge we have and we don't want to take trades...the farther away from VWAP/PVP we are the better edge/opportunity we have to trade in direction of mean reversion toward the VWAP/PVP correct?
If we were in a positive or negative skew distribution:
Is this not indicating that we are in a trending type environment and we want to trade in the direction of the skew (assuming it doesn't change anytime soon)? So I should not care where price is only that it tells me the level of opportunity I have. If we have a positive skew I want to take any trade where price is at the PVP or lower! Because in a symmetric distribution I would fade a 2SD expecting a move back to VWAP/PVP. Even stronger in a postive skew...I am even more confident that it will move at least back to the VWAP and probably the upper 1/2 SD. In a negative skew just the opposite.
It seems to me that the most important thing is the type of distribution you are in. In a positive skew environment I would think you wouldn't want to take any shorts period. And the same with no longs in a negative skew environment. In a symmetric distribution fade extremes on both sides. Of course this is not that easy because the distribution can flip/flop and the challenges that are associated with that.
It seems to me that price in relationship to the VWAP is not much of a factor. The location of price within the type of distribution should be the driving force in my mind.
The short question to all of this is why is the price in location to the VWAP so important and why is this the "trend"? Are there some statistics concepts that validate this?
I am thinking in terms of statistics in that...if I know the distribution function of grades on a test for example and the symmetric distribution says a C is the mean (VWAP) and the mode is also a C (PVP)....and the last few papers we graded were D's & F's (current location of Price) ...price is below the VWAP...I am going to bet all day that the next paper or papers are going to be above F's. I am expecting price to really start moving back to at least a C and probably A's and B's especially if there was a positive skew....
I am trying to reconcile all my math statistics classes I have taken with what I am reading.
Very interesting...THANKS SO MUCH Jerry for taking the time to explain this and answer my questions...
dbntina
-
Jerry,
Went through the videos...very nicely done thank you for posting!
Its starting to sink in a little better, couple points if you could confirm are correct for me:
1) Your definition of trend is price in relationship to the VWAP.
Price above VWAP the trend is bullish
Price below VWAP the trend is bearish
2) PVP in relationship to the VWAP tells you what kind of distribution you are looking at.
VWAP above the PVP tells you we are currently in a positively skewed distribution to the long side
VWAP below the PVP tells you we are currently in a negatively skewed distribution to the short side
VWAP close to the PVP tells you we are currently in a symmetric distribution.
If the above statements are correct, I have a couple of questions.
1) My thinking is that skewed distributions tend to indicate trend movements and symmetric distributions
tend to indicate reversions to the mean or a congestion type of environment. This is of course only relevant
to the current situation as the VWAP and PVP relationship can change in the future.
2) It would make sense to me that overall bias (whether you want to take long trades only or short trades only)
would be determined by the VWAP/PVP relationship. Assuming that looking at the volume histogram gives you a pretty good idea that the current bias is not going to change soon:
A) If the VWAP is above PVP you should only be looking for longs (assuming that current bias stays the same). This is regardless of location of price. If price is above VWAP you are trading with trend. If price is below VWAP you are trading counter trend.
B) If the VWAP is below PVP you should only be looking for shorts (assuming that current bias stays the same). This is regardless of location of price. If price is above VWAP you are trading counter trend. If the price is below VWAP you are trading with the trend.
C) If the VWAP/PVP is close it is a big assumption that current bias stays the same unless price moves rapidly back towards the VWAP. So when in a symmetric distribution it seems to make sense to me that you would only trade at 2nd and 3rd SD's for safety reasons in expectation of a move back to VWAP. However, it must move quick or you will not continue to have VWAP/PVP close (symmetric distribution).
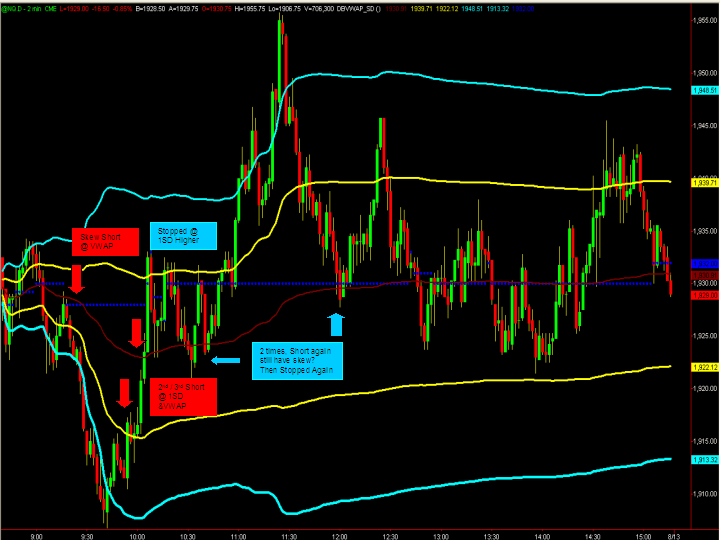
Given the above, the first trade on the YM does not make sense to me. We are in a symmetric distribution, why short at the 1SD below VWAP expecting a move to 2SD. If you expect the symmetric distribution to hold, then you are not trading with that expectation. It is more probably to get a move back to VWAP and other side of distribution, then to extend further against the VWAP toward 2SD and 3SD. The only exception would be if you are expecting the VWAP to continue down below the PVP and quickly turn into a negative skew.
You have given examples of 3 main types of trades:
1) Trading a positive/negative skew (non-symmetric distribution) in direction of the trend (defined by relationship of price and VWAP) with risk tolerance and scaling in. This one makes sense to me.
2) Trading a breakout at PVP against the skew in a non-symmetric distribution in direction of the trend (defined by relationship of price and VWAP) without risk tolerance (using tight stops and quick breakeven) makes sense to me because you are trading against the skew (which could change in the future) but you are trading with the trend.
3) Trading a symmetric distribution (assuming it holds) at the 2nd and 3rd SD's with the expectation of a QUICK move back to the PVP or other side of the distribution. It does not make sense to me to take trades at the 1SD with the expectation of a further move away from PVP in this type of distribution. If you are expecting a skew to appear...seems it would be better to wait for the skew then take this type of trade. Now if you are trading for a reversion to the mean at 2nd SD with the expectation of a move back to PVP or other side of distribution then risk tolerance doesn't make as much sense to me because the move is going to have to happen quickly because skew will appear if it stays out there and especially if it starts to move against you out towards the 3rd SD. Then you are going to have to exit (can't reverse positions in between 2nd and 3rd SD I wouldn't think. So I would think you would want to use a tight stop not risk tolerance.
Thanks for sharing the information Jerry...very interested in hearing where I am off base,
dbntina
-
Thanks JPERL I am going through the videos.
Yesterday the NQ and ES both had great breakout
trades against the skew (long) at the PVP/1SD
at 1357/1412 Central and they both hit the 2nd SD!
Granted they were probably risky since the PVP was
at the 1SD but still nice. Of course that means you
would have been stopped on the 2nd short skew trade
if you shorted one contract at VWAP on both ES and NQ
waiting for shapiro effect.
I have to say I am amazed...granted only been following
for a few weeks but there has to be something to this
statistics stuff!

dbntina
-
Jerry,
I am really enjoying the threads...just taking it all in.
1) Using something that actually is based on valid
conceptual information (not on a bunch of worthless
indicators)
2) Not using the standard small stops and constant
bleeding of account (love the risk tolerance concept)
Keep it coming...the breakout method is definitely
not my cup of tea (too much like the other ways
I have traded in the past constant stop taking
and breakeven stops)
Good stuff...Thanks,
dbntina
-
Jerry,
Here is what I have for Aug 15:
Yours Tick by Tick
9:30 to 10:18 1907.25 9:30-9:33 1906.75
9:34-9:35 1907.25
9:36-10:11 1906.75
10:12-10:15 1914
10:18 to 11:00 1915.50 10:16-11:25 1915
11:00 to 11:16 1914.50
11:16 to 11:32 1912.00 11:26-11:31 1914
11:32 to 11:34 1915.50 11:32-11:33 1915
11:34 to 12:30 1912.00 11:34-12:52 1914
12:30 to 14:18 1907.25 12:53-14:25 1907.50
14:18 to 14:40 1912.00 14:26-14:41 1910
14:40 to EOD 1907.25 14:42-EOD 1907.50
So they are pretty close for the most part...not too bad.
dbntina
-
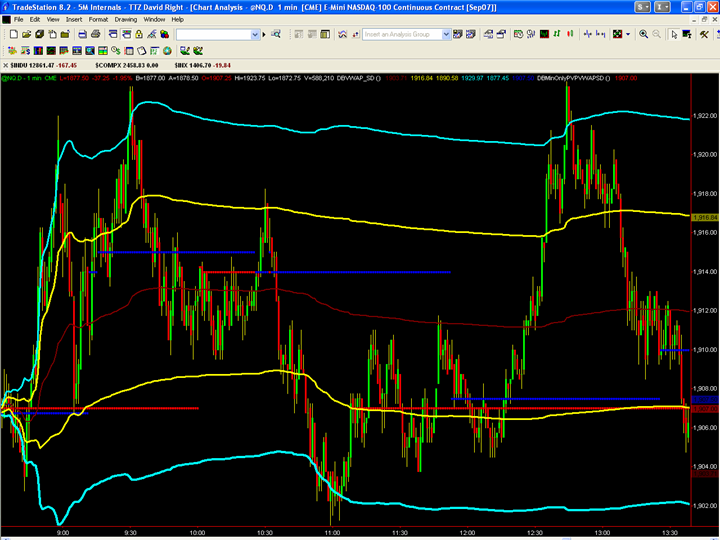
Jerry,
The blue line is the tick by tick PVP. It is constantly updating and moving all over the chart if you look at it.
The red lines are the distributed volume...they hardly move at all.
At least the 1 minute moves a little more and is closer to the tick by tick movement.
dbntina
-
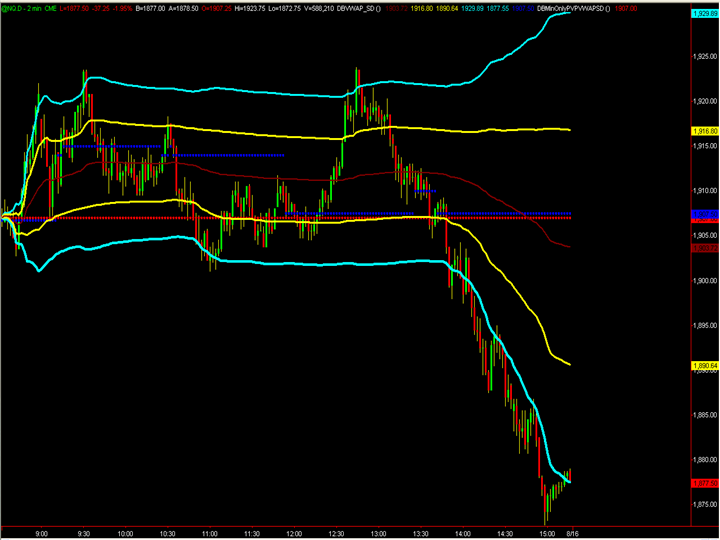
Jerry,
Here is yesterdays NQ chart.
The blue dotted line is the tick by tick pvp.
The red dotted line is the averaging bar volume over the price levels PVP.
You can see the 2 minute is way off.
You can see the 1 minute is a little closer.
It can be way off at times when you have peaks that are close at two different levels.
Here are the two charts.
Hope it helps,
dbntina
High Low Stats by 30 Minute Periods
in Market Profile
Posted
Frank,
I am glad that is helpful. Unfortunately, I had access to TS because my company had a subcribption. They closed the account and I no longer have access to TS to be able to run any code or anything. Sorry about that. Good trading to everyone,
dbntina:shrug: