
Welcome to the new Traders Laboratory! Please bear with us as we finish the migration over the next few days. If you find any issues, want to leave feedback, get in touch with us, or offer suggestions please post to the Support forum here.


duration
-
Content Count
2 -
Joined
-
Last visited
Posts posted by duration
-
-
Hello Everybody,
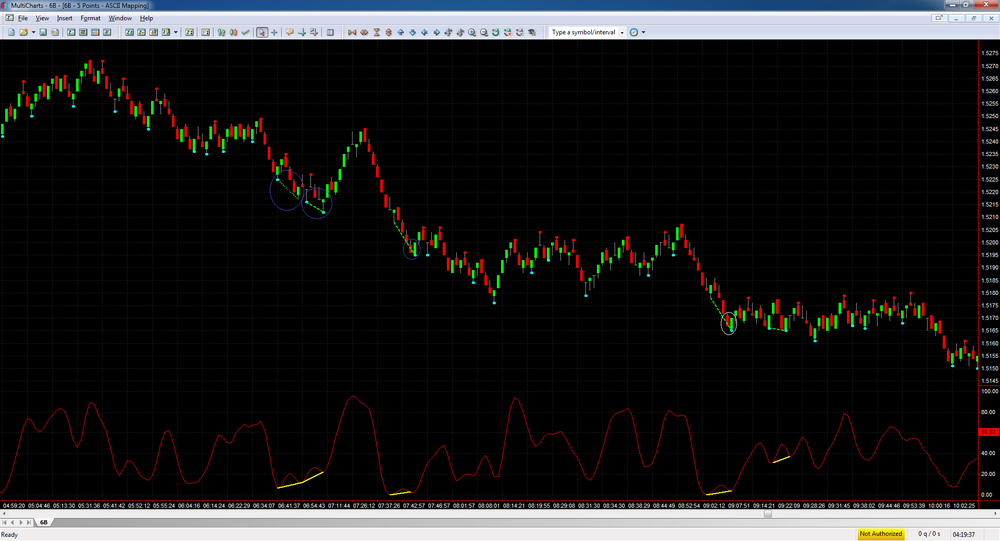
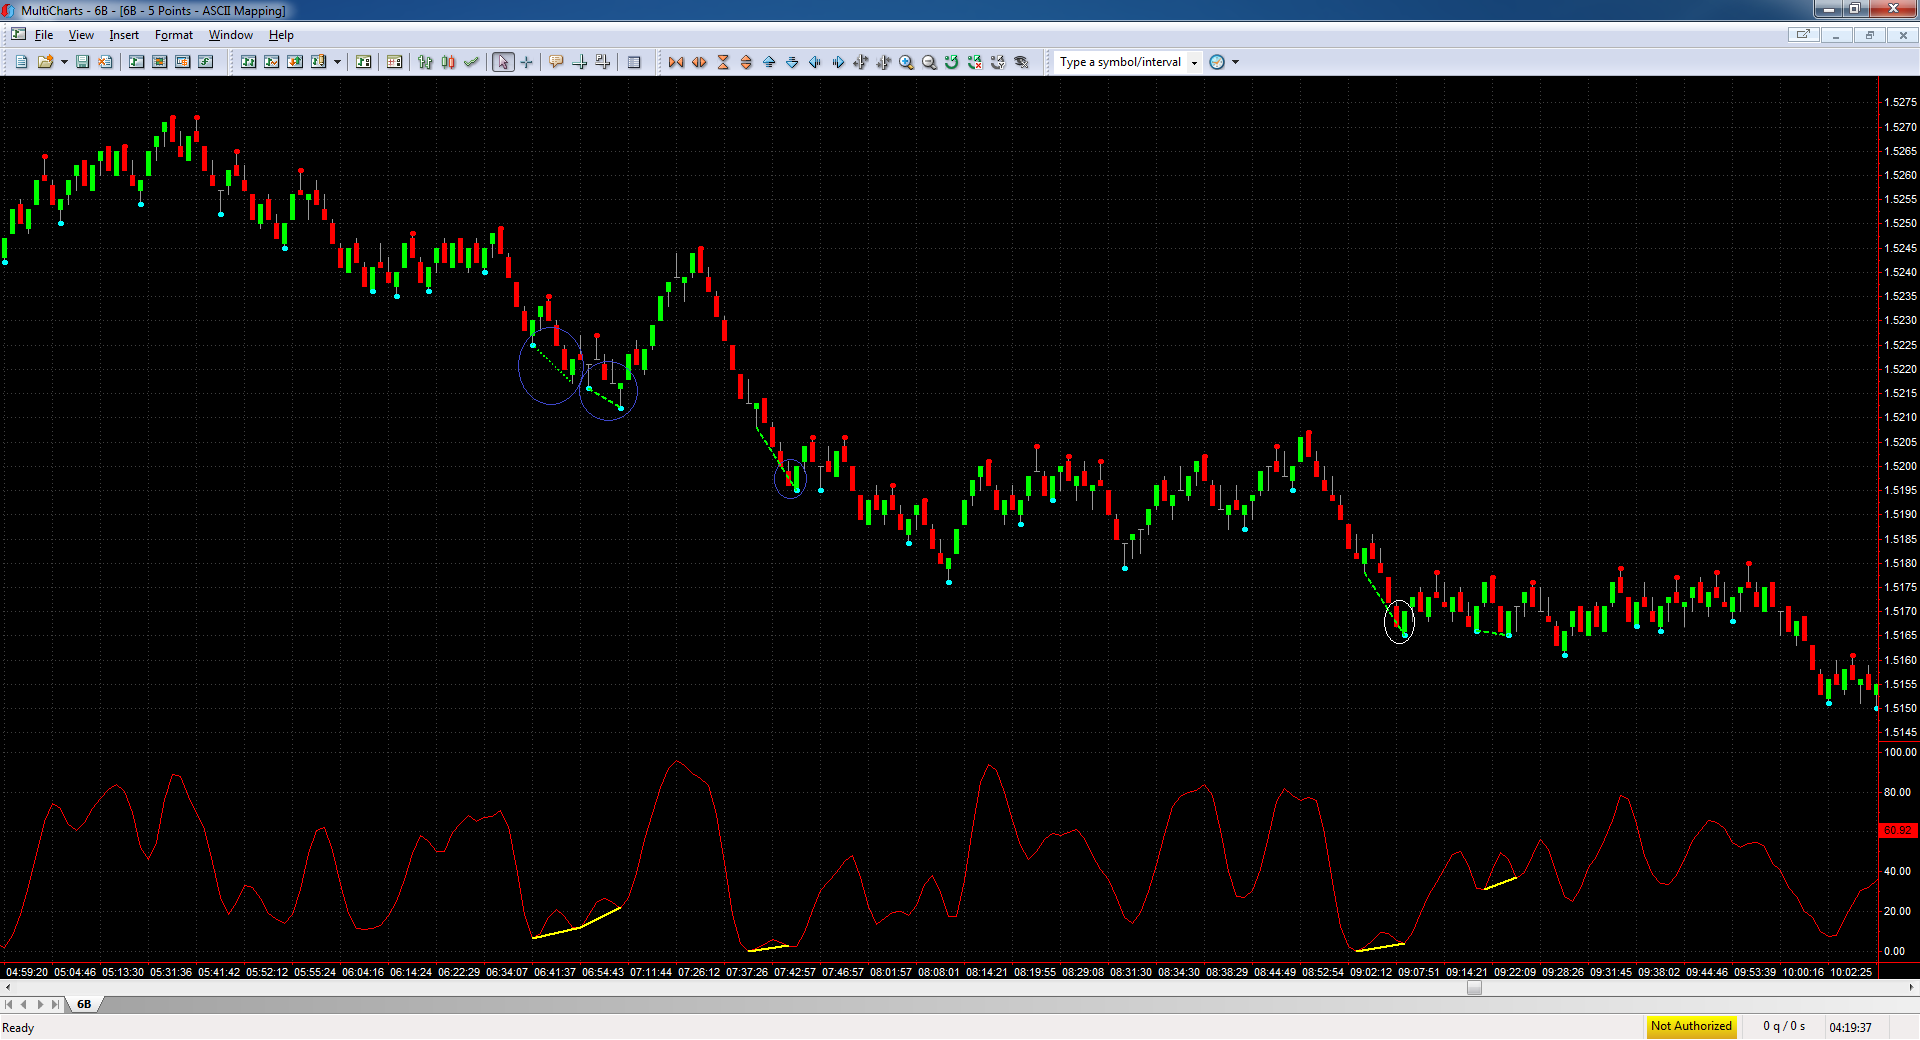
I am working on the Tuorial 26 from Markplex:
http://www.markplex.com/tutorial26.php
It works great.
I am trying to refine this indicator by adding another condition: if the trendline goes through a candlestick, then the trendline should be plotted using dots, in other words, if the trendline value is higher than the low of a price at any time, then the trendline style becomes dots instead of dashes.
I understand I need to programme a loop that will reproduce the values of a trendline at each bar between the two pivot points, and compare them to the low of each bar to check whether the trendline should be plotted using dots or dashes.
Here is what I have written to far:
// http://markplex.com/tutorial26.php

inputs :
PriceL(Low),
StochLength(7),
SmoothingLength1(3),
SmoothingLength2(3),
SmoothingType(1),
Length(20),
LeftStrength(3),
RightStrength(1),
BarTol(3);


vars:
ofastk(0),
oFastD(0),
oSlowk(0),
oSlowD(0),
oPivotPrice1(0),
oPivotBar1(0),
oPivotPrice2(0),
oPivotBar2(0),
oPivotPrice3(0),
oPivotBar3(0),
oPivotPrice4(0),
oPivotBar4(0),
tlslope(0),
bback(0),
tlvalue(0),
pricepivotcondition1(false),
pricepivotcondition2(false),
stochpivotcondition1(false),
stochpivotcondition2(false),
stochvalue(0),
tlstoch(0),
tlprice(0);


stochvalue=Stochastic(H,L,C,StochLength,SmoothingLength1,SmoothingLength2,SmoothingType,ofastk,ofastd,oslowk,oslowd);

//Determine if pivots in the stochstic have occurred
stochpivotcondition1 = Pivot(oslowd,Length,LeftStrength,RightStrength,1,-1,oPivotPrice1,oPivotBar1)<>-1;
stochpivotcondition2 = Pivot(oslowd,Length,LeftStrength,RightStrength,2,-1,oPivotPrice2,oPivotBar2)<>-1;

//Determine if pivots in the price have occurred
pricepivotcondition1 = Pivot(PriceL,Length,LeftStrength,RightStrength,1,-1,oPivotPrice3,oPivotBar3)<>-1;
pricepivotcondition2 = Pivot(PriceL,Length,LeftStrength,RightStrength,2,-1,oPivotPrice4,oPivotBar4)<>-1;

if pricepivotcondition1 and pricepivotcondition2 and stochpivotcondition1 and stochpivotcondition2
and (absvalue(oPivotbar1-oPivotBar3)<BarTol)
and (absvalue(oPivotbar2-oPivotBar4)<BarTol)
and (oPivotBar3 = RightStrength or oPivotbar1 = RightStrength)
and (oPivotPrice3<=oPivotPrice4 and oPivotPrice1>oPivotPrice2) and barstatus(1)=2 then
     begin

     tlprice= tl_new_S(D[oPivotBar4],Time_S[oPivotBar4],L[oPivotBar4],D[oPivotBar3],Time_s[oPivotBar3],L[oPivotBar3]);
     tl_setcolor(tlstoch,Red);
     tl_setsize   (tlstoch,1);

     tlstoch= tl_new_Self_s(D[oPivotBar1],Time_S[oPivotBar1],oPivotPrice1,D[oPivotBar2],Time_s[oPivotBar2],oPivotPrice2);
     tl_setcolor(tlprice,Green);
     tl_setsize   (tlprice,1);

     {tlslope = (oPivotPrice3 - oPivotPrice4) / AbsValue(oPivotbar3-oPivotBar4); //value of the slope
     value1 = oPivotPrice4*tlslope;
     if value1 >= low[oPivotBar4-3] then tl_setstyle(tlprice,2) else tl_setstyle(tlprice,3);}

     {tlvalue = oPivotPrice4 * (AbsValue(oPivotBar3 - oPivotBar4)-1) * tlslope; //the -1 is for the bar just before the oPivotBar3
     if tlvalue > low[oPivotBar3+1] then tl_setstyle(tlprice,2) else tl_setstyle(tlprice,3); //+1 for bar just before oPivotBar3}

     value80 = absvalue(oPivotBar3-oPivotBar4);
     //print(opivotbar2,";",opivotbar4,";",opivotbar1,";",opivotbar3,";",value80);
     tlslope = (oPivotPrice3 - oPivotPrice4) / AbsValue(oPivotbar3-oPivotBar4); //value of the slope
     for bback = oPivotBar4 - 1 downto bback = oPivotBar3 + 1
          begin
          value1 = oPivotPrice3 - (tlslope*bback);
          //print(date:7:0,";",time:4:0,";",bback,";",tlslope:0:6,";",value1:0:6);
          if value1[bback] > low[bback] then tl_setstyle(tlprice,3) else tl_setstyle(tlprice,2);
          end;
     end;

Plot1(oSlowD);
I am having several problems:
1. It does not properly identify the conditions to plot dashes or dots.
2. if you print the values of bback in the loop, it only looks at 3 candles back
4. the loop only works with downto, regardless from/to oPivot3/4...
Would you mind having a look and telling me what is wrong? Or direct me to a tutorial that eexplains how to properly write this?
Many thanks,
[TS] [EL] Stochastic Divergence Trendlines
in Coding Forum
Posted
Issue fixed, thank you for reading.