
Welcome to the new Traders Laboratory! Please bear with us as we finish the migration over the next few days. If you find any issues, want to leave feedback, get in touch with us, or offer suggestions please post to the Support forum here.


szgy74
-
Content Count
4 -
Joined
-
Last visited
Posts posted by szgy74
-
-
hi allIn Intraday charting how do you recognize a Bull trap ,
rxs0005
Hi,
I would suggest to look at one or two higher timeframe charts to get a better picture of the market, the overall / major trend (for example for M5 chart check M15 and M30 or H1).
This way you can see when a trend is only a pullback.
Another point is the important price levels, zones, like S/R areas, pivot levels, round numbers. When price approches these levels usually the trend pauses, goes sideways or turns back.
Bit more complicated but you may check divergences. Regular divergences suggest weakness while hidden divergences suggest the trend will continue.
Gyula
-
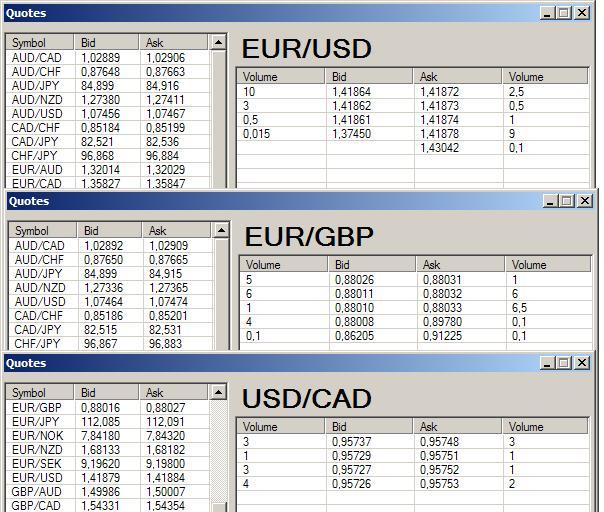
just to make things more interesting: what about the ECN level 2 prices?
there are different volumes available for buy/osell at different prices.
here is an example.
-
Hi,
Maybe you are looking for the attached one.
I think it is not so difficult to change to display what you want.
Regards,
Gyula
Buy My Trading Strategy - It's Brilliant!!
in Trading Products and Services
Posted
the best system. buy low, sell high :-)