
Welcome to the new Traders Laboratory! Please bear with us as we finish the migration over the next few days. If you find any issues, want to leave feedback, get in touch with us, or offer suggestions please post to the Support forum here.


lonew0lf
-
Content Count
52 -
Joined
-
Last visited
Posts posted by lonew0lf
-
-
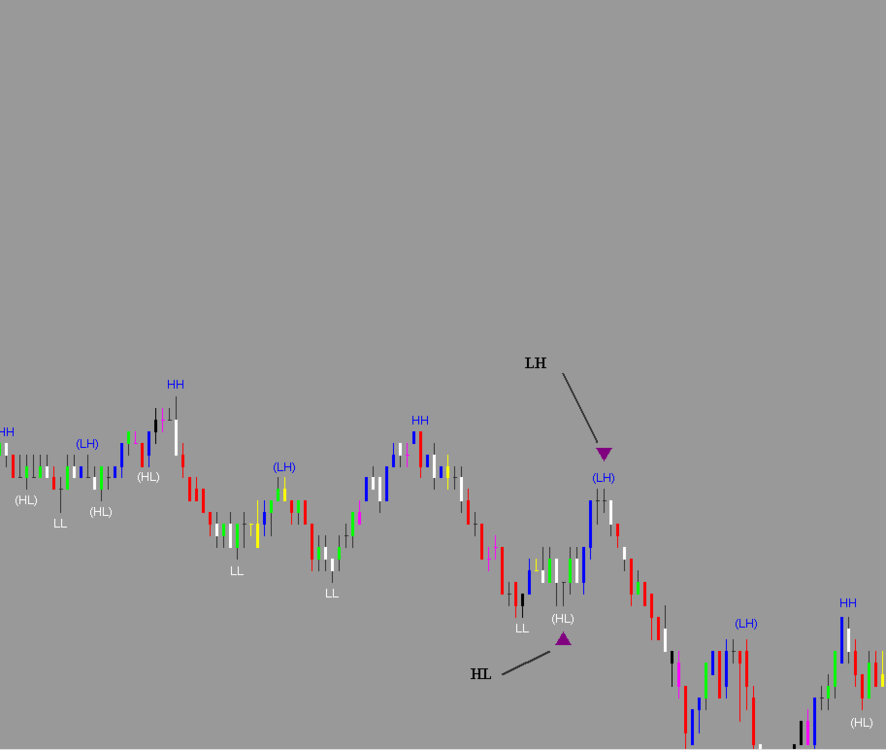
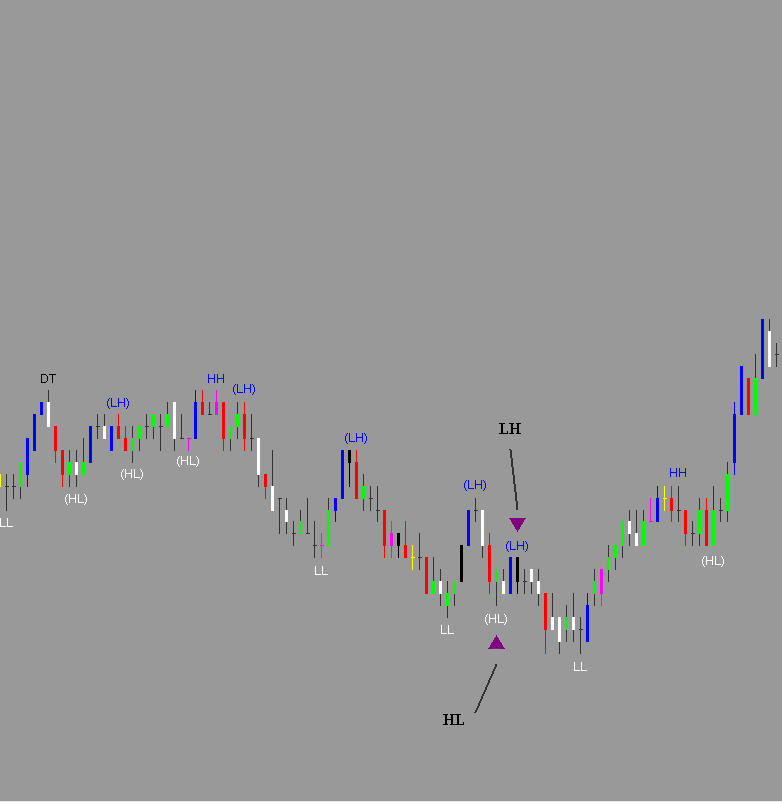
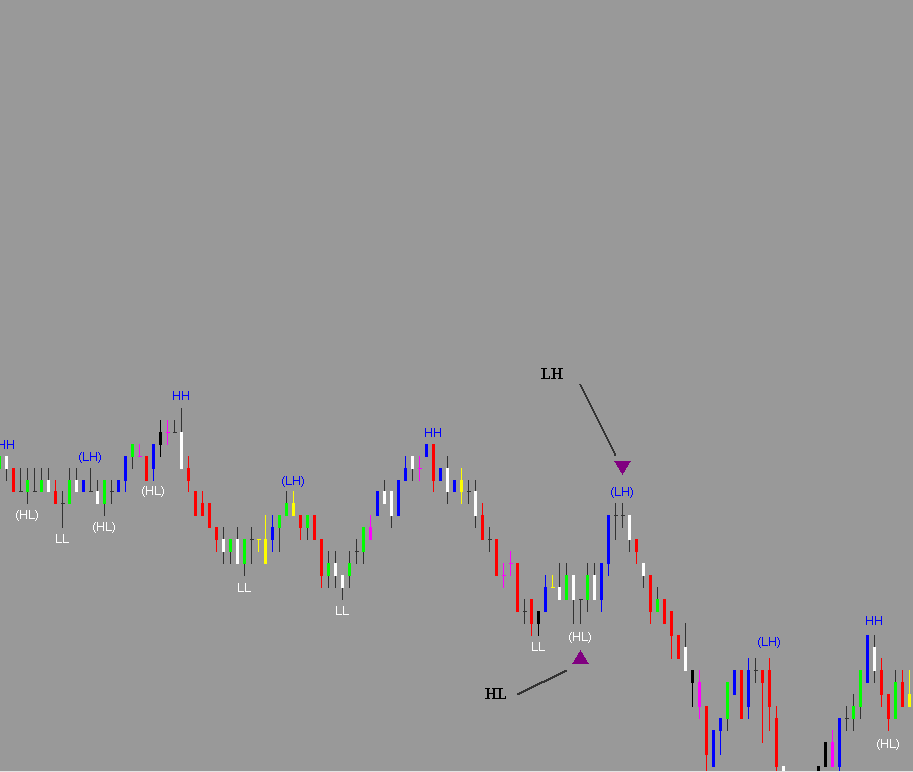
I'm trying to code this indicator to show me anytime I have a HL followed by a LH. I've attached the code below but it only appears to plot LH followed by HL. I've tried but nothing seems to work.
Attached is the code (not sure where I got the code from, most likely off a message board here) and a visual of what i'm looking to accomplish.... any assistance would be much appreciated.
// This indicator labels HH, HL, LL, LH on the chart.
//

inputs:
LeftStrength( 3 ),
RightStrength( 3 ),
LookBackLength( 100 );

variable:
ID(-1),
Offset( 0 ) ,
HighValue1(0),
HighValue2(0),
LowValue1(0),
LowValue2(0);


Offset = .15 * Average( Range, 5 ) ;

if PivotHighVSBar( 1, High, LeftStrength, RightStrength, RightStrength + 1 ) <> -1 then
begin
HighValue1 = PivotHighVS(1, High, Leftstrength, RightStrength, LookBackLength );
HighValue2 = PivotHighVS(2, High, Leftstrength, RightStrength, LookBackLength );

if HighValue2 <> -1 and ( ( HighValue1 >= HighValue2 - Offset ) and ( HighValue1 <= HighValue2 + Offset ) ) then
begin
	ID = Text_New(Date[RightStrength], Time[RightStrength], High[RightStrength] + Offset, "DT");
	Text_SetStyle(ID, 2, 1 ) ;
	Text_SetColor(ID, black);

	Value1 = 1;
end ;

if HighValue2 <> -1 and HighValue1 > HighValue2 and value1 = 0 then
begin
	ID = Text_New(Date[RightStrength], Time[RightStrength], High[RightStrength] + Offset, "HH");
	Text_SetStyle(ID, 2, 1 ) ;
	Text_SetColor(ID, blue);
end
else
if HighValue2 <> -1 and HighValue1 < HighValue2 and value1 = 0 then
begin
	ID = Text_New(Date[RightStrength], Time[Rightstrength], High[RightStrength] + Offset, "(LH)");
	Text_SetStyle(ID, 2, 1 ) ;
	Text_SetColor(ID, blue);
end ;
Value1 = 0;
end ;

if PivotLowVSBar( 1, Low, LeftStrength, RightStrength, RightStrength + 1 ) <> -1 then
begin
LowValue1 = PivotLowVS(1, Low, Leftstrength, RightStrength, LookBackLength );
LowValue2 = PivotLowVS(2, Low, Leftstrength, RightStrength, LookBackLength );

if LowValue2 <> -1 and ( ( LowValue1 >= LowValue2 - Offset ) and ( LowValue1 <= LowValue2 + Offset ) ) then
begin
	ID = Text_New(Date[RightStrength], Time[RightStrength], Low[RightStrength] - Offset, "DB");
	Text_SetStyle(ID, 2, 0 ) ;
	Text_SetColor(ID, black);

	Value1 = 1;
end;

if LowValue2 <> -1 and LowValue1 < LowValue2 and Value1 = 0 then
begin
	ID = Text_New(Date[RightStrength], Time[RightStrength], Low[RightStrength] - Offset, "LL");
	Text_SetStyle(ID, 2, 0 ) ;
	Text_SetColor(ID, white);
end
else

if LowValue2 <> -1 and LowValue1 > LowValue2 and Value1 = 0 then
begin
	ID = Text_New(Date[RightStrength], Time[RightStrength], Low[RightStrength] - Offset, "(HL)");
	Text_SetStyle(ID, 2, 0 ) ;
	Text_SetColor(ID, white);
end;
Value1 = 0;

// Experimental

if LowValue2 <> -1 and LowValue1 > LowValue2 and HighValue2 <> -1 and HighValue1 < HighValue2 and value1 = 0 then
begin
	plot1 (high, "HL LH");
	Alert("short reverse");
end;


end ;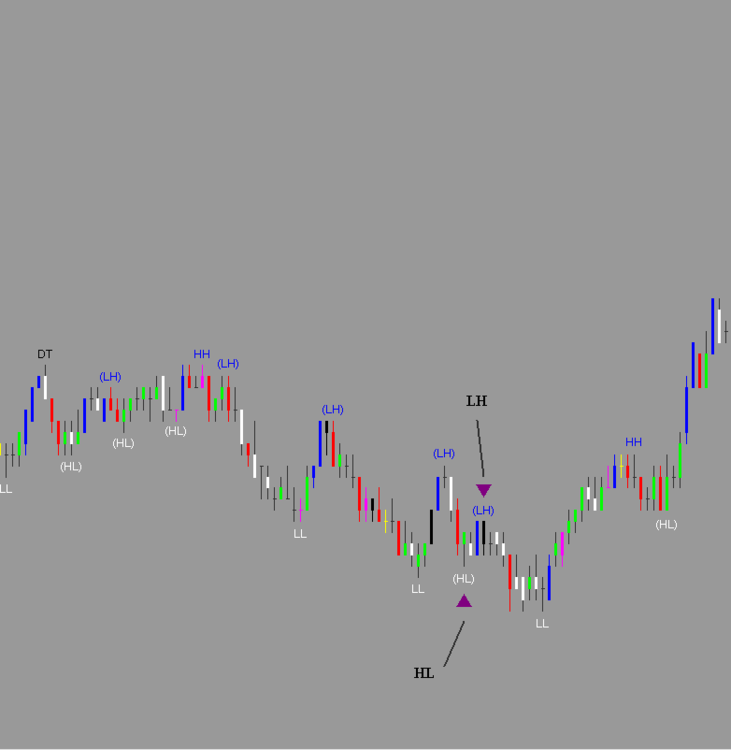
-
Some of these indicators are available on the NT forum. Search for Paintbar Factory.
-
A couple images for visual
-
I'm looking for some help adjusting a pretty useful indicator.
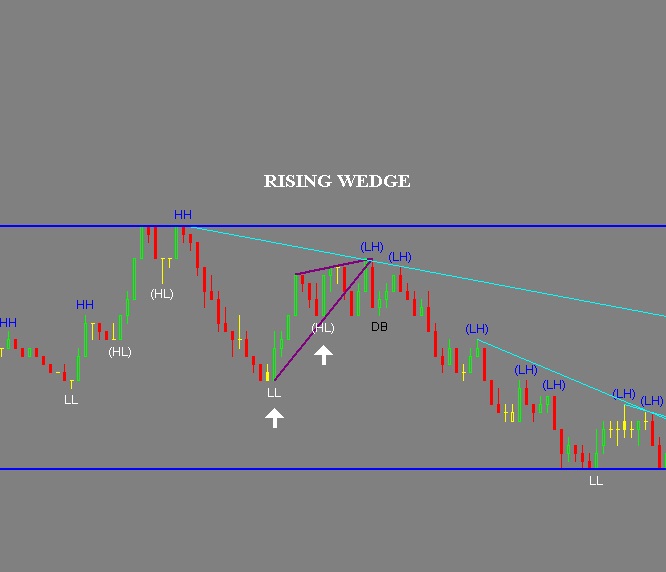
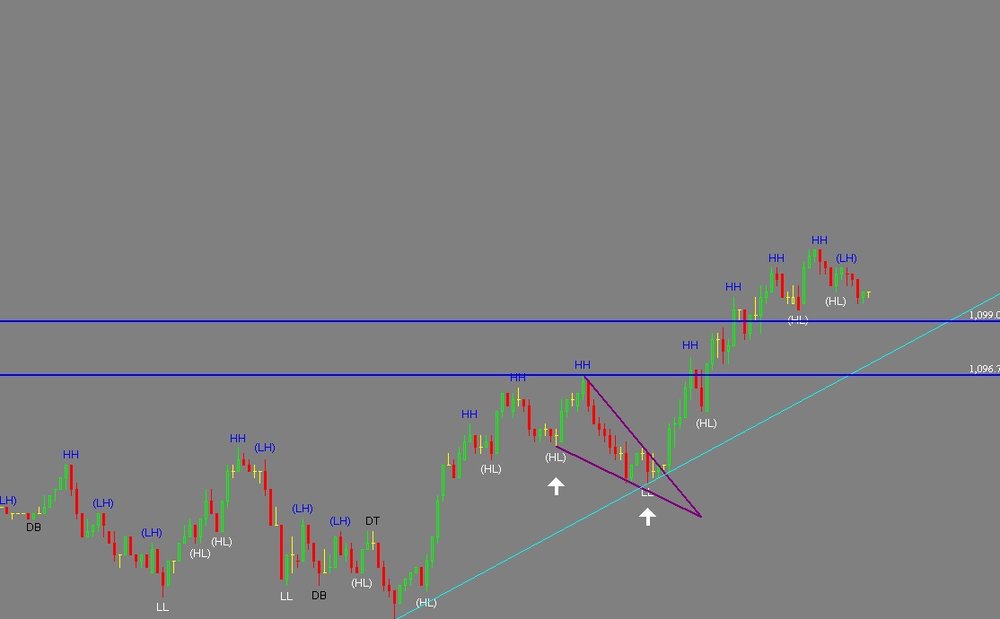
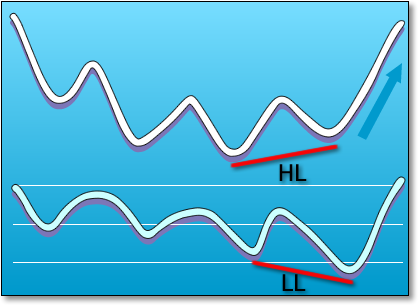
I'm looking to generate an alert whenever a HL followed by a LL condition (declining support) or LL followed by a HL condition (rising support) occurs.
For anyone wondering, I'm basically trying to get a heads-up to possible wedge patterns.
I'm not sure how to code the indicator so it looks for the first condition, then look for the second condition. Any guidance here would be appreciated.
// This indicator labels HH, HL, LL, LH on the chart.
//

inputs:
LeftStrength( 3 ),
RightStrength( 3 ),
LookBackLength( 100 );

variable:
ID(-1),
Offset( 0 ) ,
HighValue1(0),
HighValue2(0),
LowValue1(0),
LowValue2(0);


Offset = .15 * Average( Range, 5 ) ;

if PivotHighVSBar( 1, High, LeftStrength, RightStrength, RightStrength + 1 ) <> -1 then
begin
HighValue1 = PivotHighVS(1, High, Leftstrength, RightStrength, LookBackLength );
HighValue2 = PivotHighVS(2, High, Leftstrength, RightStrength, LookBackLength );

if HighValue2 <> -1 and ( ( HighValue1 >= HighValue2 - Offset ) and ( HighValue1 <= HighValue2 + Offset ) ) then
begin
	ID = Text_New(Date[RightStrength], Time[RightStrength], High[RightStrength] + Offset, "DT");
	Text_SetStyle(ID, 2, 1 ) ;
	Text_SetColor(ID, black);

	Value1 = 1;
end ;

if HighValue2 <> -1 and HighValue1 > HighValue2 and value1 = 0 then
begin
	ID = Text_New(Date[RightStrength], Time[RightStrength], High[RightStrength] + Offset, "HH");
	Text_SetStyle(ID, 2, 1 ) ;
	Text_SetColor(ID, blue);
end
else
if HighValue2 <> -1 and HighValue1 < HighValue2 and value1 = 0 then
begin
	ID = Text_New(Date[RightStrength], Time[Rightstrength], High[RightStrength] + Offset, "(LH)");
	Text_SetStyle(ID, 2, 1 ) ;
	Text_SetColor(ID, blue);
end ;
Value1 = 0;
end ;

if PivotLowVSBar( 1, Low, LeftStrength, RightStrength, RightStrength + 1 ) <> -1 then
begin
LowValue1 = PivotLowVS(1, Low, Leftstrength, RightStrength, LookBackLength );
LowValue2 = PivotLowVS(2, Low, Leftstrength, RightStrength, LookBackLength );

if LowValue2 <> -1 and ( ( LowValue1 >= LowValue2 - Offset ) and ( LowValue1 <= LowValue2 + Offset ) ) then
begin
	ID = Text_New(Date[RightStrength], Time[RightStrength], Low[RightStrength] - Offset, "DB");
	Text_SetStyle(ID, 2, 0 ) ;
	Text_SetColor(ID, black);

	Value1 = 1;
end;

if LowValue2 <> -1 and LowValue1 < LowValue2 and Value1 = 0 then
begin
	ID = Text_New(Date[RightStrength], Time[RightStrength], Low[RightStrength] - Offset, "LL");
	Text_SetStyle(ID, 2, 0 ) ;
	Text_SetColor(ID, white);
end
else

if LowValue2 <> -1 and LowValue1 > LowValue2 and Value1 = 0 then
begin
	ID = Text_New(Date[RightStrength], Time[RightStrength], Low[RightStrength] - Offset, "(HL)");
	Text_SetStyle(ID, 2, 0 ) ;
	Text_SetColor(ID, white);
end;
Value1 = 0;


end ;
-
I found this market profile indicator on the multicharts message board. The indicator works fine on 10yr treasuries but kicks out a "Array bounds. Wrong index value: 1001." error for all other instruments (ES/GC), regardless of time grame. Increasing the arrays slows the computer down to a crawl.
It works well for bonds, if anyone else can resolve the issue.
[legacycolorvalue=true]; input: FontSize(7), VerticalSpacing(1), Length(30), Letter1(1), TXTcolor(Green), OpenColor(DarkGreen), CloseColor(DarkGreen), LastColor(DarkGreen), ValColor(LightGray), ValSize(2), VAprcnt(.70), Stime(Sess1StartTime); vars: lett("ABCDEFGHIJKLMNOPQRSTUVWXYZabcdefghijklmnopqrstuvwxyz"), t1(0), vsize(0), cpt(0), dl(0), lcount(1), fp(0), daynum(0), d0(0), mid(0), dlo(0), pc(0), pc2(0), skp(0), labl(0), vala(0), vap(0), cp(0), t0(0), nuflag(0), hh(0), ll(0), x(0),et(0), clet(""), curtxt(""), th(0), tl(0), tpstr("00"), tot(0), va(0), d2p(0), oldclet(""), barhi(0), barlo(0), mintick(0), xpts(0), price(0), up(0), dn(0), oldup(0), olddn(0), flag(0), flag2(0) ; array:pri[1000](0),tpo[1000](0),pristr[1000](""); nuflag=0; if t0 <= Sess1EndTime and t > Sess1EndTime and Sess2StartTime <> 0 then nuflag=1; if d <> d0 and Sess2StartTime = Sess2EndTime then nuflag=1; if t0=sess1endtime then nuflag=1; if currentbar=1 or nuflag=1 then begin if currentbar=1 then begin vap=VAprcnt; x=currentdate; vsize=mod(valsize+7,7); if vsize < 2 then value88=5 else value88=vsize; mintick = 1 point * minmove * VerticalSpacing; xpts=500*mintick; end; lcount=letter1; if currentbar > 1 then begin if valcolor <> 0 and flag2=0 then begin mid=0;value23=0; cpt=tl;cp=tl + (th-tl)/2; {center of dist.} for x = tl to th begin if pristr[x] <> "" then begin pristr[x]=nutpstr(tpo[x],pristr[x],pri[x]); value23=value23 + tpo[x]; {total tpo count} if tpo[x]=mid and x <= cp then cpt=x; if tpo[x]=mid and x>cp and(x-cp) < AbsValue(cp-cpt) then cpt=x; if tpo[x] > mid then begin cpt=x; mid = tpo[x]; end; end; end; va=value23 * vap; x=mid;up=cpt;dn=cpt; while x < va begin value19=tpo[up+1]+tpo[up+2]; value20=tpo[dn-1]+tpo[dn-2]; if value19 >= value20 then begin if x+tpo[up+1] >= va then begin x=x+tpo[up+1]; up=up+1; end else begin x=x+value19; up=up+2; end; end else begin if x+tpo[dn-1] >= va then begin x=x+tpo[dn-1]; dn=dn-1; end else begin x=x+value20; dn=dn-2; end; end; end; if up > th then up=th; if dn < tl then dn=tl; up= fp+((up-500)*mintick); dn=fp+((dn-500)*mintick); value62=fp+((cpt-500)*mintick); labl= text_new(d2p,t1,dl-mintick,"VA: "+ mp_str32(dn)+" | "+mp_str32(up)); text_setsize(labl,fontsize); text_setfontname(labl,"Tahoma"); TEXT_SETSTYLE(labl,0,2); TEXT_SETCOLOR(labl,valcolor); vala=TL_New(d2p,t1,up,d2p,t1,dn); TL_SetColor(vala,valcolor); TL_SetSize(vala,vsize); value60=TL_New(d2p,t1,value62+mintick/15,d2p,t1,value62-mintick/15); TL_SetColor(value60,valcolor); TL_SetSize(value60,value88); end; pc2=0; for value4=tl to th begin price=fp+((value4-500)*mintick) ; if price <= pc then pc2=value4; end; if pc2=0 then pc2=barlo; curtxt=pristr[pc2]; if RightStr(curtxt,1) <> "<" then begin text_setstring(pri[pc2],curtxt+" *"); Text_SetColor(pri[pc2],closecolor); text_setsize(pri[pc2],fontsize); text_setfontname(pri[pc2],"Tahoma"); end; end; t1=t; d2p=d; labl=0;vala=0; for value1=tl to th begin pristr[value1]=""; tpo[value1]=0; end; clet=curletstr(stime,length,letter1); oldclet=clet; dlo=l; fp=o; tpo[500]=1; th=500;tl=500; flag=0; pri[500]= text_new(d,t1,o," *"+clet); pristr[500]=" *"+clet; TEXT_SETSTYLE(pri[500],0,2); TEXT_SETCOLOR(pri[500],opencolor); text_setsize(pri[500],fontsize); text_setfontname(pri[500],"Tahoma"); hh=o;ll=o;mid=1;tot=1;value22=currentbar; dl=l; if d= JulianToDate(LastCalcJDate) then flag2=1; end; clet=curletstr(stime,length,letter1) ; t0=t;d0=d;pc=c; barhi=intportion((xpts+h-fp+(mintick/10))/mintick); barlo=ceiling((xpts+l-fp-(mintick/10))/mintick); if barhi > th then th=barhi; if barlo < tl then tl=barlo; if l < dl then dl=l; IF datacompression=0 and currentbar > value22 then begin lcount=lcount+1; if lcount=53 then lcount=1; clet=midstr(lett,lcount,1) ; hh=o;ll=o;flag=flag+1; end; value22=currentbar; IF datacompression = 1 and oldclet <> clet then begin hh=o;ll=o;flag=flag+1; end; for value4=barlo to barhi begin price=fp+((value4-500)*mintick); curtxt=pristr[value4]; if curtxt = "" then begin tpo[value4]=1; pri[value4]= text_new(d2p,t1,price," "+clet); pristr[value4]=" "+clet; TEXT_SETSTYLE(pri[value4],0,2); TEXT_SETCOLOR(pri[value4], TxtColor); //print(clet); text_setsize(pri[value4],fontsize); text_setfontname(pri[value4],"Tahoma"); end else begin if RightStr(curtxt,1) <> clet then begin text_setstring(pri[value4],curtxt+clet); print(curtxt); text_setsize(pri[value4],fontsize); text_setfontname(pri[value4],"Tahoma"); pristr[value4]=curtxt+clet; tpo[value4]=tpo[value4]+1; end; end; end; if h>hh then hh=h; if l < ll then ll = l; {------------------------------------------------------------------------------------------} if valcolor <> 0 and lastbaronchart then begin mid=0;value16=0;value23=0; cpt=tl;cp=tl + (th-tl)/2; {center of dist.} for x = tl to th begin if pristr[x] <> "" then begin pristr[x]=nutpstr(tpo[x],pristr[x],pri[x]); value23=value23 + tpo[x]; {total tpo count} if tpo[x]=mid and x <= cp then cpt=x; if tpo[x]=mid and x>cp and(x-cp) < AbsValue(cp-cpt) then cpt=x; if tpo[x] > mid then begin cpt=x; mid = tpo[x]; end; end; end; va=value23 * vap; if l < dlo then begin dlo=l; price=fp+((tl-501)*mintick); if labl <> 0 then Text_SetLocation(labl,d2p,t1,price); end; if labl =0 then begin price=fp+((tl-501)*mintick); labl= text_new(d2p,t1,price,"-"); TEXT_SETSTYLE(labl,0,2); TEXT_SETCOLOR(labl,valcolor); text_setsize(labl,fontsize); text_setfontname(labl,"Tahoma"); end; if va <> 0 then begin value61=value18; x=mid;up=cpt;dn=cpt; while x < va begin value19=tpo[up+1]+tpo[up+2]; value20=tpo[dn-1]+tpo[dn-2]; if value19 >= value20 then begin if x+tpo[up+1] >= va then begin x=x+tpo[up+1]; up=up+1; end else begin x=x+value19; up=up+2; end; end else begin if x+tpo[dn-1] >= va then begin x=x+tpo[dn-1]; dn=dn-1; end else begin x=x+value20; dn=dn-2; end; end; end; if up > th then up=th; if dn < tl then dn=tl; value18=cpt; oldup=up; olddn=dn; up= fp+((up-500)*mintick); dn=fp+((dn-500)*mintick); if flag=1 then value63=t; if up > dn and flag > 1 then begin if vala = 0 then begin vala=TL_New(d2p,t1,up,d2p,t1,dn); TL_SetColor(vala,valcolor); TL_SetSize(vala,vsize); value62=fp+((value18-500)*mintick); value60=TL_New(d2p,t1,value62+mintick/15,d2p,t1,value62-mintick/15); TL_SetColor(value60,valcolor); TL_SetSize(value60,value88); end else begin if oldup <> up then TL_SetBegin(vala,d2p,t1,up); if olddn <> dn then TL_SetEnd(vala,d2p,t1,dn); end; end; if {value61 <> value18 and} flag > 1 then begin value62=fp+((value18-500)*mintick); TL_SetBegin(value60,d2p,t1,value62+mintick/15); TL_SetEnd(value60,d2p,t1,value62-mintick/15); end; Text_SetString(labl,"VA: " + mp_str32(dn) + " | "+ mp_str32(up)); text_setsize(labl,fontsize); text_setfontname(labl,"Tahoma"); end; end; if lastcolor > 0 then begin if value10 = 0 and currentbar=3 then begin value10=tl_new(value50,value51,c,d,t,c); tl_setcolor(value10,lastcolor); tl_setsize(value10,0); TL_SetExtLeft(value10,true); end else if currentbar > 3 and LastBarOnChart then begin tl_setend(value10,d,t,c); tl_setbegin(value10,value52,value53,c); end; value52=value50;value53=value51; value50=d;value51=t; end; plot1(l - mintick); -
Tams & Sevensa I think I managed to get what I was looking for after giving it some more thought:
Inputs: price(Close), length(13), upColour(black), downColour(white); Value1 = jtHMA(price, length); Plot1(Value1, "FastMA"); { Color criteria } if Value1 > Value1[1] then SetPlotColor(1, upColour) else if (Value1 < Value1[1]) then SetPlotColor(1, downColour); if Value1 cross above Value1[1] then alert ("bullish"); if Value1 cross below Value1[1] then alert ("bearish"); -
TAMS - i appreciate the guidance, however i'm not seeing the logic in the crossover. I'm sure its something simple that i'm missing; Is there another indicator that you can think of that currently does what i'm looking for where i can use that as guide?
Thx
-
That was my initial thought but cross above/below what? There's no zero line or crossover like macd or stochastic.
-
I've got a quick coding question from one of BlueRay's indicators (Fast2MA).
I'm trying to get it to fire off alerts only when the fast MA changes colour (in other words, when it goes from bullish to bearish).
I threw an alert in, but it alerts on every plot, not when the fast ma change colour. Any ideas?
Inputs: price(Close), length(13), upColour(black), downColour(white); Value1 = jtHMA(price, length); Plot1(Value1, "FastMA"); { Color criteria } if (Value1 > Value1[1]) then SetPlotColor(1, upColour) else if (Value1 < Value1[1]) then SetPlotColor(1, downColour); alert; -
I was being fictitious on the rightstrenth of 1.
Is it possible to have the indicator plot the divergence line, even though you have to wait the 3 bars for confirmation.
For example, TTM Trend for example will paint the current bar the anticipated colour before the bar closes. Would that be possible for this indicator where it plots the potential divergence as its happening rather than after the fact?
-
I've been using the divergence as the first trigger followed by a trend change (ttm trend) as confirmation. I finally noticed on the higher time frames (hourly, daily) that the trigger was way to slow.
I use the 15min, 1hr, etc as a signal for the direction I want to trade in and use a 3 min chart for entry.
I'll try changing the right strength to 2, why not use 1?
-
I agree with you on staying with the trend. That was my reason why having the hidden divergence was important since it shows a continuation of the trend.
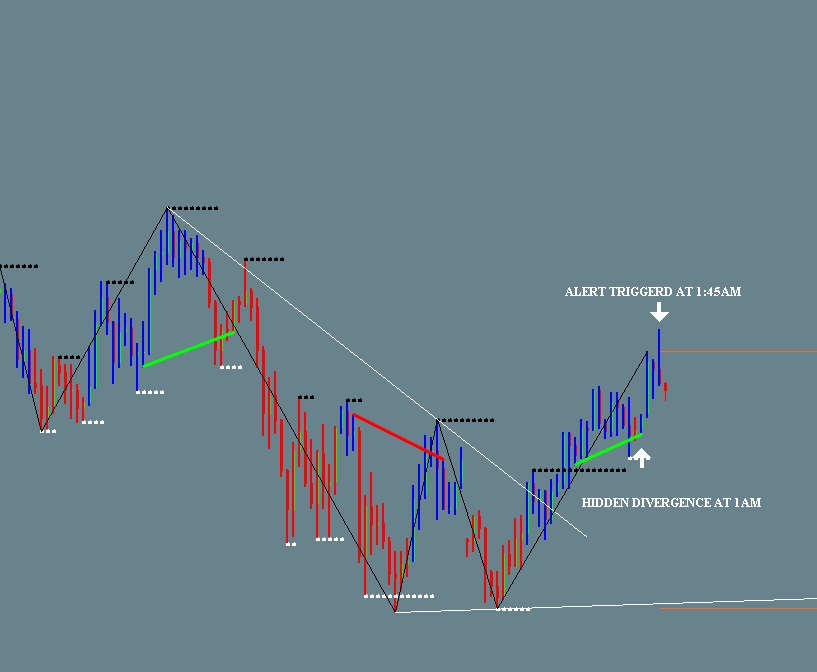
I seem to be running into a new problem now, it appears that the indicator is firing off alerts late. In the attached picture for example (15 min chart). The positive divergence is completed at 1am est, however the alert doesn't trigger until 1:45am.
I looked at the code but can't seem to figure out what's causing the delay. Open to suggestions.
//----------------------------------------------------
inputs:
//----------------------------------------------------


RSILength(9),
StochLength(18),
KLength(6),
DLength(3),
OverSold(20),
OverBought(80),
Length(20),
LeftStrength(3),
RightStrength(3),
Div.Color.Down(yellow),
Div.Color.Up(white),
HD.Color.Down (red),
HD.Color.Up (green),
Line.Size(2),
Plot.stochrsi(1),
AlertOn.Off(1);

//----------------------------------------------------
variables:
//----------------------------------------------------

DToscK(0),
DToscD(0),

oPivotPrice1(0),
oPivotBar1(0),
oPivotPrice2(0),
oPivotBar2(0),

oPivotPrice11(0),
oPivotBar11(0),
oPivotPrice12(0),
oPivotBar12(0);

value1 = FastKCustomEasy(RSI(C, RSILength),StochLength);
DToscK =  average(value1,KLength);
DToscD = average(DToscK,DLength);

Condition1 = Pivot( DToscK, Length, LeftStrength, RightStrength, 1, -1, oPivotPrice1, oPivotBar1 ) <> -1
	AND ( oPivotBar1 - RightStrength ) = 0 ;

Condition11 = Pivot( DToscK, Length, LeftStrength, RightStrength, 1, 1, oPivotPrice11, oPivotBar11 ) <> -1
	AND ( oPivotBar11 - RightStrength ) = 0 ;

Condition2 = Pivot( DToscK, Length, LeftStrength, RightStrength, 2, -1, oPivotPrice2, oPivotBar2 ) <> -1;

Condition12 = Pivot( DToscK, Length, LeftStrength, RightStrength, 2, 1, oPivotPrice12, oPivotBar12 ) <> -1;

If
	Condition1 and Condition2 // added condition2 = referecne future data
	AND L[oPivotBar1] >= L[oPivotBar2]
	AND DToscK[oPivotBar2] > DToscK[oPivotBar1] then
Begin
	Value2 = TL_New(D[oPivotBar2], T[oPivotBar2], L[oPivotBar2], D[oPivotBar1], T[oPivotBar1], L[oPivotBar1]);
	TL_SetColor( Value2, HD.Color.up );
	TL_SetSize(  Value2, Line.Size  );
		if AlertOn.Off <> 0 then
			Alert( "HD Bottom" );
End;

	If
	Condition1 and Condition2 // added condition2 = referecne future data
	AND L[oPivotBar2] >= L[oPivotBar1]
	AND DToscK[oPivotBar2] < DToscK[oPivotBar1] then
Begin
	Value2 = TL_New(D[oPivotBar2], T[oPivotBar2], L[oPivotBar2], D[oPivotBar1], T[oPivotBar1], L[oPivotBar1]);
	TL_SetColor( Value2, Div.Color.up );
	TL_SetSize(  Value2, Line.Size  );
		if AlertOn.Off <> 0 then
			Alert( "DIV Bottom" );
End;

If
	Condition11 and Condition12 // added condition12  referecne future data
	AND H[oPivotBar11] <= H[oPivotBar12]
	AND DToscK[oPivotBar11] > DToscK[oPivotBar12] then
Begin
	Value12 = TL_New(D[oPivotBar12], T[oPivotBar12], H[oPivotBar12], D[oPivotBar11], T[oPivotBar11], H[oPivotBar11]);
	TL_SetColor( Value12, HD.Color.down );
	TL_SetSize(  Value12, Line.Size  );
		if AlertOn.Off <> 0 then
			Alert( "HD Top" );
End;

	If
	Condition11 and Condition12 // added condition12  referecne future data
	AND H[oPivotBar12] <= H[oPivotBar11]
	AND DToscK[oPivotBar12] > DToscK[oPivotBar11] then
Begin
	Value12 = TL_New(D[oPivotBar12], T[oPivotBar12], H[oPivotBar12], D[oPivotBar11], T[oPivotBar11], H[oPivotBar11]);
	TL_SetColor( Value12, Div.Color.down );
	TL_SetSize(  Value12, Line.Size  );
		if AlertOn.Off <> 0 then
			Alert( "DIV Top" );

End;


condition3 = Pivot( DToscK, Length, LeftStrength, RightStrength, 1, -1, oPivotPrice1, oPivotBar1 ) <> -1
	AND ( oPivotBar1 - RightStrength ) = 0 ;

condition32 = Pivot( DToscK, Length, LeftStrength, RightStrength, 1, 1, oPivotPrice11, oPivotBar11 ) <> -1
	AND ( oPivotBar11 - RightStrength ) = 0 ;

condition4 = Pivot( DToscK, Length, LeftStrength, RightStrength, 2, -1, oPivotPrice2, oPivotBar2 ) <> -1;

condition42 = Pivot( DToscK, Length, LeftStrength, RightStrength, 2, 1, oPivotPrice12, oPivotBar12 ) <> -1;

If
	Condition3 and condition4
	AND L[oPivotBar1] >= L[oPivotBar2]
	AND DToscK[oPivotBar2] > DToscK[oPivotBar1] then
Begin
	Value2 = TL_New_SELF(D[oPivotBar2], T[oPivotBar2], DToscK[oPivotBar2], D[oPivotBar1], T[oPivotBar1], DToscK[oPivotBar1]);
	TL_SetColor( Value2, HD.Color.up );
	TL_SetSize(  Value2, Line.Size  );
End;

	If
	Condition3 and condition4
	AND L[oPivotBar2] >= L[oPivotBar1]
	AND DToscK[oPivotBar2] < DToscK[oPivotBar1] then
Begin
	Value2 = TL_New_SELF(D[oPivotBar2], T[oPivotBar2], DToscK[oPivotBar2], D[oPivotBar1], T[oPivotBar1], DToscK[oPivotBar1]);
	TL_SetColor( Value2, Div.Color.up );
	TL_SetSize(  Value2, Line.Size  );
End;


If
	Condition32 and Condition42
	AND H[oPivotBar11] <= H[oPivotBar12]
	AND DToscK[oPivotBar11] > DToscK[oPivotBar12] then
Begin
	Value12 = TL_New_SELF(D[oPivotBar12], T[oPivotBar12], DToscK[oPivotBar12], D[oPivotBar11], T[oPivotBar11], DToscK[oPivotBar11]);
	TL_SetColor( Value12, HD.Color.down );
	TL_SetSize(  Value12, Line.Size  );
End;

	If
	Condition32 and Condition42
	AND H[oPivotBar12] <= H[oPivotBar11]
	AND DToscK[oPivotBar12] > DToscK[oPivotBar11] then
Begin
	Value12 = TL_New_SELF(D[oPivotBar12], T[oPivotBar12], DToscK[oPivotBar12], D[oPivotBar11], T[oPivotBar11], DToscK[oPivotBar11]);
	TL_SetColor( Value12, Div.Color.down );
	TL_SetSize(  Value12, Line.Size  );
End;

Plot1( DToscK, "stochrsi",      blue );
plot2( 20,    "oversold", white);
plot3(80, "overbought", white);
-
aaa - i initially tried the inverse but all that did was kick off errors. I finally got this one to work.
// StochRSI Divergence TrendLine
// Author: MARKPLEX
// http://markplex.com/tutorial4.php
// version: 1.0

// Author: aaa
// version: 2.0
// Date: 20091129
// added:
// divergence on top +
// Line.Color.Top + Line.Color.Bot + Line.Size + Plot.Sto in inputs

//----------------------------------------------------
inputs:
//----------------------------------------------------


RSILength(9),
StochLength(18),
KLength(6),
DLength(3),
OverSold(20),
OverBought(80),
Length(20),
LeftStrength(3),
RightStrength(3),
Line.Color.Top(yellow),
Line.Color.Bot(white),
Line.Size(2),
Plot.stochrsi(1),
AlertOn.Off(1);

//----------------------------------------------------
variables:
//----------------------------------------------------

DToscK(0),
DToscD(0),

oPivotPrice1(0),
oPivotBar1(0),
oPivotPrice2(0),
oPivotBar2(0),

oPivotPrice11(0),
oPivotBar11(0),
oPivotPrice12(0),
oPivotBar12(0);

value1 = FastKCustomEasy(RSI(C, RSILength),StochLength);
DToscK =  average(value1,KLength);
DToscD = average(DToscK,DLength);

Condition1 = Pivot( DToscK, Length, LeftStrength, RightStrength, 1, -1, oPivotPrice1, oPivotBar1 ) <> -1
	AND ( oPivotBar1 - RightStrength ) = 0 ;

Condition11 = Pivot( DToscK, Length, LeftStrength, RightStrength, 1, 1, oPivotPrice11, oPivotBar11 ) <> -1
	AND ( oPivotBar11 - RightStrength ) = 0 ;

Condition2 = Pivot( DToscK, Length, LeftStrength, RightStrength, 2, -1, oPivotPrice2, oPivotBar2 ) <> -1;

Condition12 = Pivot( DToscK, Length, LeftStrength, RightStrength, 2, 1, oPivotPrice12, oPivotBar12 ) <> -1;

If
	Condition1 and Condition2 // added condition2 = referecne future data
	AND L[oPivotBar1] >= L[oPivotBar2]
	AND DToscK[oPivotBar2] > DToscK[oPivotBar1] then
Begin
	Value2 = TL_New(D[oPivotBar2], T[oPivotBar2], L[oPivotBar2], D[oPivotBar1], T[oPivotBar1], L[oPivotBar1]);
	TL_SetColor( Value2, Line.Color.Bot );
	TL_SetSize(  Value2, Line.Size  );
		if AlertOn.Off <> 0 then
			Alert( "Hid Div Bottom" );
End;

If
	Condition11 and Condition12 // added condition12  referecne future data
	AND H[oPivotBar11] <= H[oPivotBar12]
	AND DToscK[oPivotBar11] > DToscK[oPivotBar12] then
Begin
	Value12 = TL_New(D[oPivotBar12], T[oPivotBar12], H[oPivotBar12], D[oPivotBar11], T[oPivotBar11], H[oPivotBar11]);
	TL_SetColor( Value12, Line.Color.Top );
	TL_SetSize(  Value12, Line.Size  );
		if AlertOn.Off <> 0 then
			Alert( "Hid Div Top" );
End;

condition3 = Pivot( DToscK, Length, LeftStrength, RightStrength, 1, -1, oPivotPrice1, oPivotBar1 ) <> -1
	AND ( oPivotBar1 - RightStrength ) = 0 ;

condition32 = Pivot( DToscK, Length, LeftStrength, RightStrength, 1, 1, oPivotPrice11, oPivotBar11 ) <> -1
	AND ( oPivotBar11 - RightStrength ) = 0 ;

condition4 = Pivot( DToscK, Length, LeftStrength, RightStrength, 2, -1, oPivotPrice2, oPivotBar2 ) <> -1;

condition42 = Pivot( DToscK, Length, LeftStrength, RightStrength, 2, 1, oPivotPrice12, oPivotBar12 ) <> -1;

If
	Condition3 and condition4
	AND L[oPivotBar1] >= L[oPivotBar2]
	AND DToscK[oPivotBar2] > DToscK[oPivotBar1] then
Begin
	Value2 = TL_New_SELF(D[oPivotBar2], T[oPivotBar2], DToscK[oPivotBar2], D[oPivotBar1], T[oPivotBar1], DToscK[oPivotBar1]);
	TL_SetColor( Value2, Line.Color.Bot );
	TL_SetSize(  Value2, Line.Size  );
End;

If
	Condition32 and Condition42
	AND H[oPivotBar11] <= H[oPivotBar12]
	AND DToscK[oPivotBar11] > DToscK[oPivotBar12] then
Begin
	Value12 = TL_New_SELF(D[oPivotBar12], T[oPivotBar12], DToscK[oPivotBar12], D[oPivotBar11], T[oPivotBar11], DToscK[oPivotBar11]);
	TL_SetColor( Value12, Line.Color.Top );
	TL_SetSize(  Value12, Line.Size  );
End;

Plot1( DToscK, "stochrsi",      blue );
plot2( 20,    "oversold", white);
plot3(80, "overbought", white);
-
Following on the great work done by aaa on the divergence indicator; I wanted to know if someone could potentially help in creating an indicator which shows negative or reverse divergence.
The attached indicator is a slight tweak from aaa's, and shows regular divergence only. The attached images show the negative divergence.
// StochRSI Divergence TrendLine
// Author: MARKPLEX
// http://markplex.com/tutorial4.php
// version: 1.0

// Author: aaa
// version: 2.0
// Date: 20091129
// added:
// divergence on top +
// Line.Color.Top + Line.Color.Bot + Line.Size + Plot.Sto in inputs

//----------------------------------------------------
inputs:
//----------------------------------------------------


RSILength(9),
StochLength(18),
KLength(6),
DLength(3),
OverSold(20),
OverBought(80),
Length(20),
LeftStrength(3),
RightStrength(3),
Line.Color.Top(yellow),
Line.Color.Bot(white),
Line.Size(2),
Plot.stochrsi(1),
AlertOn.Off(1);

//----------------------------------------------------
variables:
//----------------------------------------------------

DToscK(0),
DToscD(0),

oPivotPrice1(0),
oPivotBar1(0),
oPivotPrice2(0),
oPivotBar2(0),

oPivotPrice11(0),
oPivotBar11(0),
oPivotPrice12(0),
oPivotBar12(0);

value1 = FastKCustomEasy(RSI(C, RSILength),StochLength);
DToscK =  average(value1,KLength);
DToscD = average(DToscK,DLength);

Condition1 = Pivot( DToscK, Length, LeftStrength, RightStrength, 1, -1, oPivotPrice1, oPivotBar1 ) <> -1
	AND ( oPivotBar1 - RightStrength ) = 0 ;

Condition11 = Pivot( DToscK, Length, LeftStrength, RightStrength, 1, 1, oPivotPrice11, oPivotBar11 ) <> -1
	AND ( oPivotBar11 - RightStrength ) = 0 ;

Condition2 = Pivot( DToscK, Length, LeftStrength, RightStrength, 2, -1, oPivotPrice2, oPivotBar2 ) <> -1;

Condition12 = Pivot( DToscK, Length, LeftStrength, RightStrength, 2, 1, oPivotPrice12, oPivotBar12 ) <> -1;

If
	Condition1 and Condition2 // added condition2 = referecne future data
	AND L[oPivotBar2] >= L[oPivotBar1]
	AND DToscK[oPivotBar2] < DToscK[oPivotBar1] then
Begin
	Value2 = TL_New(D[oPivotBar2], T[oPivotBar2], L[oPivotBar2], D[oPivotBar1], T[oPivotBar1], L[oPivotBar1]);
	TL_SetColor( Value2, Line.Color.Bot );
	TL_SetSize(  Value2, Line.Size  );
		if AlertOn.Off <> 0 then
			Alert( "Divergence in Bottom" );
End;

If
	Condition11 and Condition12 // added condition12  referecne future data
	AND H[oPivotBar12] <= H[oPivotBar11]
	AND DToscK[oPivotBar12] > DToscK[oPivotBar11] then
Begin
	Value12 = TL_New(D[oPivotBar12], T[oPivotBar12], H[oPivotBar12], D[oPivotBar11], T[oPivotBar11], H[oPivotBar11]);
	TL_SetColor( Value12, Line.Color.Top );
	TL_SetSize(  Value12, Line.Size  );
		if AlertOn.Off <> 0 then
			Alert( "Divergence in Top" );

End;

condition3 = Pivot( DToscK, Length, LeftStrength, RightStrength, 1, -1, oPivotPrice1, oPivotBar1 ) <> -1
	AND ( oPivotBar1 - RightStrength ) = 0 ;

condition32 = Pivot( DToscK, Length, LeftStrength, RightStrength, 1, 1, oPivotPrice11, oPivotBar11 ) <> -1
	AND ( oPivotBar11 - RightStrength ) = 0 ;

condition4 = Pivot( DToscK, Length, LeftStrength, RightStrength, 2, -1, oPivotPrice2, oPivotBar2 ) <> -1;

condition42 = Pivot( DToscK, Length, LeftStrength, RightStrength, 2, 1, oPivotPrice12, oPivotBar12 ) <> -1;

If
	Condition3 and condition4
	AND L[oPivotBar2] >= L[oPivotBar1]
	AND DToscK[oPivotBar2] < DToscK[oPivotBar1] then
Begin
	Value2 = TL_New_SELF(D[oPivotBar2], T[oPivotBar2], DToscK[oPivotBar2], D[oPivotBar1], T[oPivotBar1], DToscK[oPivotBar1]);
	TL_SetColor( Value2, Line.Color.Bot );
	TL_SetSize(  Value2, Line.Size  );
End;

If
	Condition32 and Condition42
	AND H[oPivotBar12] <= H[oPivotBar11]
	AND DToscK[oPivotBar12] > DToscK[oPivotBar11] then
Begin
	Value12 = TL_New_SELF(D[oPivotBar12], T[oPivotBar12], DToscK[oPivotBar12], D[oPivotBar11], T[oPivotBar11], DToscK[oPivotBar11]);
	TL_SetColor( Value12, Line.Color.Top );
	TL_SetSize(  Value12, Line.Size  );
End;

Plot1( DToscK, "stochrsi",      blue );
plot2( 20,    "oversold", white);
plot3(80, "overbought", white);
-
aaa- is there a way to add to this indicator so when it enters overbought/sold levels that the respective colour changes.
I tried using the simple RSI code as a guide, but it doesn't appear to take
if var0 > OverBought then
SetPlotColor( 1, OverBColor )
else if var0 < OverSold then
SetPlotColor( 1, OverSColor ) ;
-
aaa - thanks for thee additional code, perfect.
-
I'm not sure how to translate that to this specific code. I used other indicators with alerts already coded in as reference but it doesn't appear to work.
Got any other suggestions?
-
AAA/TAMS or anyone else knowledgeable... how would I got about adding an alert feature to this indicator?
-
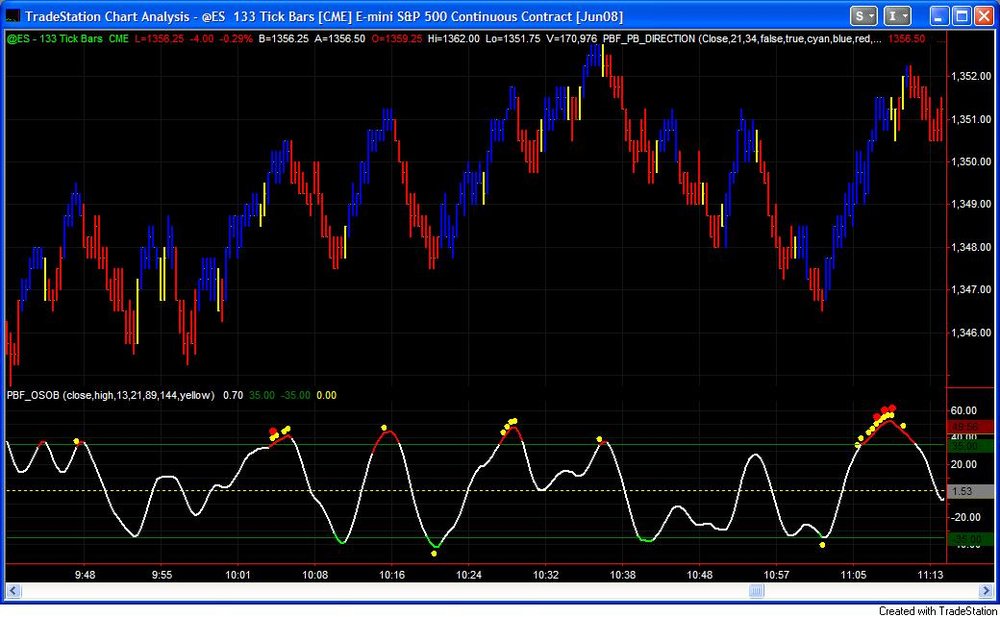
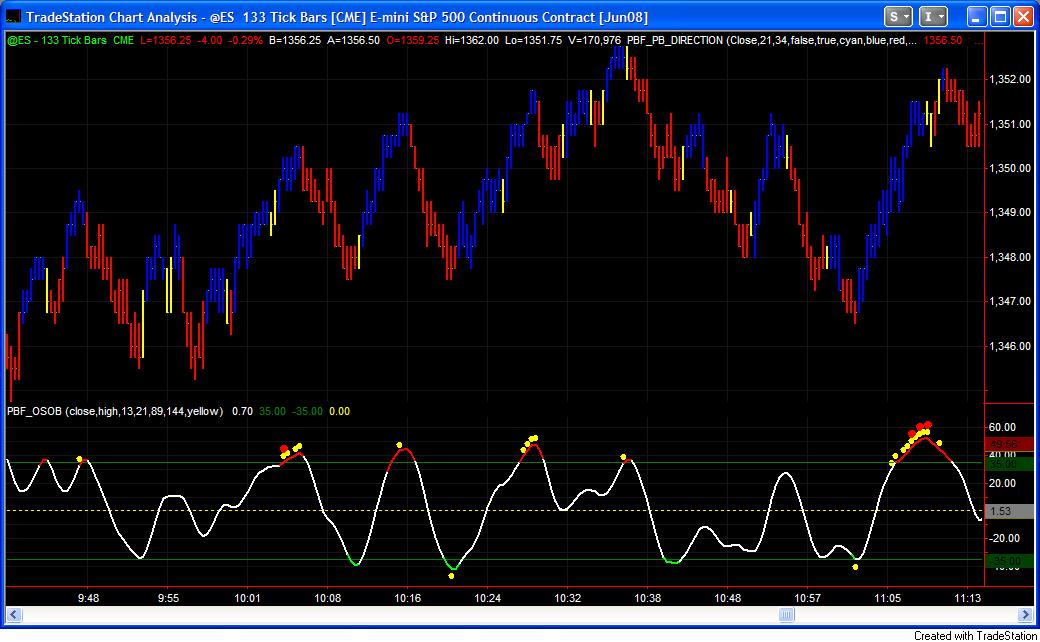
Is it possible to replicate the functions of the paintbarfactory ob/os indicator pictured below Specifically, i'm looking to use the stochrsi to replicate the 3 levels of warning:
Overbought (>=80) - indicator line turns red. oversold (<=80) - indicator line turns green.
White dots - gives you a sense of market direction.
Yellow dots - warn you for an over bought/over sold condition.
Red & green dots appear - the market is under extremely over bought or over sold condition.
input:

RSILength(9),
StochLength(18),
KLength(6),
DLength(3),
oversold(20),
overbought(80),
overscolor(white),
overbcolor(white);

Vars:
DToscK(0),
DToscD(0);

value1 = FastKCustomEasy(RSI(C, RSILength),StochLength);
DToscK =  average(value1,KLength);
DToscD = average(DToscK,DLength);

plot1(DToscK,"%K" );
plot2(DToscD,"%D" );
plot3( overbought, "OverBot" ) ;
plot4( oversold, "OverSld" ) ;

condition1 = value1 crosses over oversold ;
if condition1 then
Alert( "Indicator exiting oversold zone" )
else
begin
condition1 = value1 crosses under overbought ;
if condition1 then
Alert( "Indicator exiting overbought zone" ) ;
end;


oFastK(0),
oFastD(0),
oSlowK(0),
oSlowD(0),
-
I was able to apply divergence to both the price and indicator. Thank you AAA for putting the original together. The below modification applies to the stochrsi:
// StochRSI Divergence TrendLine
// Author: MARKPLEX
// http://markplex.com/tutorial4.php
// version: 1.0

// Author: aaa
// version: 2.0
// Date: 20091129
// added:
// divergence on top +
// Line.Color.Top + Line.Color.Bot + Line.Size + Plot.Sto in inputs

//----------------------------------------------------
inputs:
//----------------------------------------------------


RSILength(9),
StochLength(18),
KLength(6),
DLength(3),
OverSold(20),
OverBought(80),
Length(20),
LeftStrength(3),
RightStrength(3),
Line.Color.Top(red),
Line.Color.Bot(blue),
Line.Size(2),
Plot.stochrsi(1);

//----------------------------------------------------
variables:
//----------------------------------------------------

DToscK(0),
DToscD(0),

oPivotPrice1(0),
oPivotBar1(0),
oPivotPrice2(0),
oPivotBar2(0),

oPivotPrice11(0),
oPivotBar11(0),
oPivotPrice12(0),
oPivotBar12(0);

value1 = FastKCustomEasy(RSI(C, RSILength),StochLength);
DToscK =  average(value1,KLength);
DToscD = average(DToscK,DLength);

Condition1 = Pivot( DToscK, Length, LeftStrength, RightStrength, 1, -1, oPivotPrice1, oPivotBar1 ) <> -1
	AND ( oPivotBar1 - RightStrength ) = 0 ;

Condition11 = Pivot( DToscK, Length, LeftStrength, RightStrength, 1, 1, oPivotPrice11, oPivotBar11 ) <> -1
	AND ( oPivotBar11 - RightStrength ) = 0 ;

Condition2 = Pivot( DToscK, Length, LeftStrength, RightStrength, 2, -1, oPivotPrice2, oPivotBar2 ) <> -1;

Condition12 = Pivot( DToscK, Length, LeftStrength, RightStrength, 2, 1, oPivotPrice12, oPivotBar12 ) <> -1;

If
	Condition1 and Condition2 // added condition2 = referecne future data
	AND L[oPivotBar2] >= L[oPivotBar1]
	AND DToscK[oPivotBar2] < DToscK[oPivotBar1] then
Begin
	Value2 = TL_New(D[oPivotBar2], T[oPivotBar2], L[oPivotBar2], D[oPivotBar1], T[oPivotBar1], L[oPivotBar1]);
	TL_SetColor( Value2, Line.Color.Bot );
	TL_SetSize(  Value2, Line.Size  );
End;

If
	Condition11 and Condition12 // added condition12  referecne future data
	AND H[oPivotBar12] <= H[oPivotBar11]
	AND DToscK[oPivotBar12] > DToscK[oPivotBar11] then
Begin
	Value12 = TL_New(D[oPivotBar12], T[oPivotBar12], H[oPivotBar12], D[oPivotBar11], T[oPivotBar11], H[oPivotBar11]);
	TL_SetColor( Value12, Line.Color.Top );
	TL_SetSize(  Value12, Line.Size  );
End;

if Plot.stochrsi <> 0 then
Plot1( DToscK );


condition3 = Pivot( DToscK, Length, LeftStrength, RightStrength, 1, -1, oPivotPrice1, oPivotBar1 ) <> -1
	AND ( oPivotBar1 - RightStrength ) = 0 ;

condition32 = Pivot( DToscK, Length, LeftStrength, RightStrength, 1, 1, oPivotPrice11, oPivotBar11 ) <> -1
	AND ( oPivotBar11 - RightStrength ) = 0 ;

condition4 = Pivot( DToscK, Length, LeftStrength, RightStrength, 2, -1, oPivotPrice2, oPivotBar2 ) <> -1;

condition42 = Pivot( DToscK, Length, LeftStrength, RightStrength, 2, 1, oPivotPrice12, oPivotBar12 ) <> -1;

If
	Condition3 and condition4
	AND L[oPivotBar2] >= L[oPivotBar1]
	AND DToscK[oPivotBar2] < DToscK[oPivotBar1] then
Begin
	Value2 = TL_New_SELF(D[oPivotBar2], T[oPivotBar2], DToscK[oPivotBar2], D[oPivotBar1], T[oPivotBar1], DToscK[oPivotBar1]);
	TL_SetColor( Value2, Line.Color.Bot );
	TL_SetSize(  Value2, Line.Size  );
End;

If
	Condition32 and Condition42
	AND H[oPivotBar12] <= H[oPivotBar11]
	AND DToscK[oPivotBar12] > DToscK[oPivotBar11] then
Begin
	Value12 = TL_New_SELF(D[oPivotBar12], T[oPivotBar12], DToscK[oPivotBar12], D[oPivotBar11], T[oPivotBar11], DToscK[oPivotBar11]);
	TL_SetColor( Value12, Line.Color.Top );
	TL_SetSize(  Value12, Line.Size  );
End;

Plot1( DToscK, "stochrsi",      white );
plot2( 20,    "oversold", white);
plot3(80, "overbought", white);
-
I was able to apply divergence to both the price and indicator. Thank you AAA for putting the original together. The below modification applies to the stochrsi:
// StochRSI Divergence TrendLine
// Author: MARKPLEX
// http://markplex.com/tutorial4.php
// version: 1.0

// Author: aaa
// version: 2.0
// Date: 20091129
// added:
// divergence on top +
// Line.Color.Top + Line.Color.Bot + Line.Size + Plot.Sto in inputs

//----------------------------------------------------
inputs:
//----------------------------------------------------


RSILength(9),
StochLength(18),
KLength(6),
DLength(3),
OverSold(20),
OverBought(80),
Length(20),
LeftStrength(3),
RightStrength(3),
Line.Color.Top(red),
Line.Color.Bot(blue),
Line.Size(3),
Plot.stochrsi(1);

//----------------------------------------------------
variables:
//----------------------------------------------------

DToscK(0),
DToscD(0),

oPivotPrice1(0),
oPivotBar1(0),
oPivotPrice2(0),
oPivotBar2(0),

oPivotPrice11(0),
oPivotBar11(0),
oPivotPrice12(0),
oPivotBar12(0);

value1 = FastKCustomEasy(RSI(C, RSILength),StochLength);
DToscK =  average(value1,KLength);
DToscD = average(DToscK,DLength);

Condition1 = Pivot( DToscK, Length, LeftStrength, RightStrength, 1, -1, oPivotPrice1, oPivotBar1 ) <> -1
	AND ( oPivotBar1 - RightStrength ) = 0 ;

Condition11 = Pivot( DToscK, Length, LeftStrength, RightStrength, 1, 1, oPivotPrice11, oPivotBar11 ) <> -1
	AND ( oPivotBar11 - RightStrength ) = 0 ;

Condition2 = Pivot( DToscK, Length, LeftStrength, RightStrength, 2, -1, oPivotPrice2, oPivotBar2 ) <> -1;

Condition12 = Pivot( DToscK, Length, LeftStrength, RightStrength, 2, 1, oPivotPrice12, oPivotBar12 ) <> -1;

If
	Condition1 and Condition2 // added condition2 = referecne future data
	AND L[oPivotBar2] >= L[oPivotBar1]
	AND DToscK[oPivotBar2] < DToscK[oPivotBar1] then
Begin
	Value2 = TL_New(D[oPivotBar2], T[oPivotBar2], L[oPivotBar2], D[oPivotBar1], T[oPivotBar1], L[oPivotBar1]);
	TL_SetColor( Value2, Line.Color.Bot );
	TL_SetSize(  Value2, Line.Size  );
End;

If
	Condition11 and Condition12 // added condition12  referecne future data
	AND H[oPivotBar12] <= H[oPivotBar11]
	AND DToscK[oPivotBar12] > DToscK[oPivotBar11] then
Begin
	Value12 = TL_New(D[oPivotBar12], T[oPivotBar12], H[oPivotBar12], D[oPivotBar11], T[oPivotBar11], H[oPivotBar11]);
	TL_SetColor( Value12, Line.Color.Top );
	TL_SetSize(  Value12, Line.Size  );
End;

if Plot.stochrsi <> 0 then
Plot1( DToscK );


condition3 = Pivot( DToscK, Length, LeftStrength, RightStrength, 1, -1, oPivotPrice1, oPivotBar1 ) <> -1
	AND ( oPivotBar1 - RightStrength ) = 0 ;

condition32 = Pivot( DToscK, Length, LeftStrength, RightStrength, 1, 1, oPivotPrice11, oPivotBar11 ) <> -1
	AND ( oPivotBar11 - RightStrength ) = 0 ;

condition4 = Pivot( DToscK, Length, LeftStrength, RightStrength, 2, -1, oPivotPrice2, oPivotBar2 ) <> -1;

condition42 = Pivot( DToscK, Length, LeftStrength, RightStrength, 2, 1, oPivotPrice12, oPivotBar12 ) <> -1;

If
	Condition3 and condition4
	AND L[oPivotBar2] >= L[oPivotBar1]
	AND DToscK[oPivotBar2] < DToscK[oPivotBar1] then
Begin
	Value2 = TL_New_SELF(D[oPivotBar2], T[oPivotBar2], DToscK[oPivotBar2], D[oPivotBar1], T[oPivotBar1], DToscK[oPivotBar1]);
	TL_SetColor( Value2, Line.Color.Bot );
	TL_SetSize(  Value2, Line.Size  );
End;

If
	Condition32 and Condition42
	AND H[oPivotBar12] <= H[oPivotBar11]
	AND DToscK[oPivotBar12] > DToscK[oPivotBar11] then
Begin
	Value12 = TL_New_SELF(D[oPivotBar12], T[oPivotBar12], DToscK[oPivotBar12], D[oPivotBar11], T[oPivotBar11], DToscK[oPivotBar11]);
	TL_SetColor( Value12, Line.Color.Top );
	TL_SetSize(  Value12, Line.Size  );
End;

Plot1( DToscK, "stochrsi",      white );
plot2( 20,    "oversold", white);
plot3(80, "overbought", white);
-
AAA - thanks for undertaking this endeavor. I've come to like the stochrsi as a good test against my signals. The ability to see divergence would be quite nice.
I'm running the MACD divergence on my charts right now and it looks good, hopefully the same will hold true for stochrsi.
-
It appears that I can't modify my post any further, i'll just repost both codes.
-
Done, not sure if the tagging worked.

High Lo
in Coding Forum
Posted
TAMS - that must be where I got it then, thanks. Do you have any ideas on how to get this to plot the show me when I have a HL followed by LH?