
Welcome to the new Traders Laboratory! Please bear with us as we finish the migration over the next few days. If you find any issues, want to leave feedback, get in touch with us, or offer suggestions please post to the Support forum here.


4rings2snails
-
Content Count
13 -
Joined
-
Last visited
Posts posted by 4rings2snails
-
-
Why that? Is it more noisy? How about the state that there's more info (price, volume, moves and action) on lower TF?
On the ES from 8/19, if one traded from the 3 minute they would have been tossed major noise. At some points in the day the 3 min. was tell a completely different story than the 5 min. It was crazy. 3min chert = bad for me.
-
Anyone want to take a stab at showing us how they would have played the ES today? Holy smokes! This is going to be a tuff sell, if anyone's even willing to try and show us proper entries/exits and truly justify them.
The thing that confused me most was the first 30 minute of the regular session. If anyone would kindly chime in I'd really appreciate it as the volume divergence from the first up bar (5 min.) to the second as well as the divergence in vol. from the 4th to the 5th and sixth bars while price continued to skyrocket really perplexed me. Volume dropped off in those situations, yet we saw major jumps ups. WTH?
Anyone?
FWIW: I foolishly used the 3 minute more than the 5 minute chart and the read on the 3 minute killed me (it was like a bad dream that I couldn't wake up from). I WILL NEVER USE THE 3 MINUTE CHART ever again... Only the 5 minute chart from this day forward.
-
Let's look at A;
1. There is a lot of weakness in the background. Just prior to the large dark candle we have an up thrust type candle with follows a low activity narrow range down candle. Notice how this candle dropped from the previous candles close? This looks like a test candle. With the next candle closing down and lower than the low of the test candle, it is a failed test. Weakness. The very next bar is an Effort to Fall with high volume but not as high as some prior bars and not as high as the bars in B. The volume on the "KRB" is very low, not showing that much professional support. To get technical, we would actually like to see the KRB not close on its highs. So for some it is not even a key reversal candle.
But that "technical" definition is of little import. The next candle is no demand. A narrow range (NR4) candle closing up and off its high on volume less than the previous two candles. We have seen and Effort to Fall and now we see little activity to the upside as we retrace that area. The BBs must not be interested in higher prices.
VJ, respectfully, please read through the above portion of your reply to Tasuki and tell me if you notice anything that's off. The reason I'm inquiring is because I read your response word for word and I'm a little lost when you start writing about specific bars. I think, but stand to be corrected, that you got a few of the bars mixed up in your explanation of them and which ones you are referring to. So would you kindly go over that paragraph and doble check it for me becasue things aren't adding up for me.
TIA,
4r2s
-
Ya know, I was thinking, I'm curious if this setup would have been quite as visible on the 3 or 5 min chart.
I would of missed it completely on the 5 minute. I usually never look below 3 minutes as there's usually a ton of noise, but this one minute chart was rather clear.
Anyone have any thoughts on this?
-
Welcome and thanks for the post. This is a great place to learn and share ideas.#2: yes this is the place to get short. Narrow range up bar on volume less than the previous two bars. You can short on the close of this bar, or you can place you sell order at the low of the candle and wait for the next candle to trade lower and bring you into the market.
BTW that WRB looks like an Effort to Fall, so you not only have the obvious trend to the downside, you have an immediate sign of weakness in the "near background".
#4: There are two candles that jump out at me. The candle after the one you labeled NS (No Supply). This is a narrow (NR4) bar that makes a lower low closes on its highs with volume less than the previous two candles. In fact, the volume is almost non-existent. This bar close up, but it is a test. This is your signal to get long.
The second candle is the one I have labeled KRB (Key Reversal Bar). This is a clear sign of strength in the market. It closes higher than the previous bar, higher than its open, and makes a lower low than the previous bar. Volume is lower than the previous bar but not too low.
The previous candle is another Effort to Fall candle. Note, however, that it does not have anywhere near the volume as the Effort to Fall at #3 or #1. Simply, effort is decreasing. Or to put it in physics terms, effort in the opposite direction is increasing. Hence we end up with effort but no result.
You are a Jedi Knight in my book! Learned a ton from your breakdown. Thanks VJ!
Hello Dael.NR4 stand for a Narrow Range bar that is less than the 4 previous bar. Meaning that the high to low of the bar or candle is less the high and low of all 4 previous bar or candles.
Also, the test (the NR4) after the NS was a great indication for going long on close of the test bar as both the NS and the NR4 where confirmation that supply had dried out (look at their volume) and that the market was ready to auction upward. All the greater as those 2 signs of strenght appearred after a stopping volume (candle labeled 3) and and effort to fall later on, the red candle just prior to the candle labelled KRB, with the next candle up.
A great thing about VSA, is that those patterns repeat themselves again and again and again in all timeframes and really show who is winning the current battle between supply and demand. Even better, for entry, if the NS and following test occured at a previous POC, VAH or VAL of either a market profile or a volume profile.
Hope it help
Shreem:)
Shreem, thanks brother, very informative. Your input combined with VJ's was quite insightful. Thank you.
-
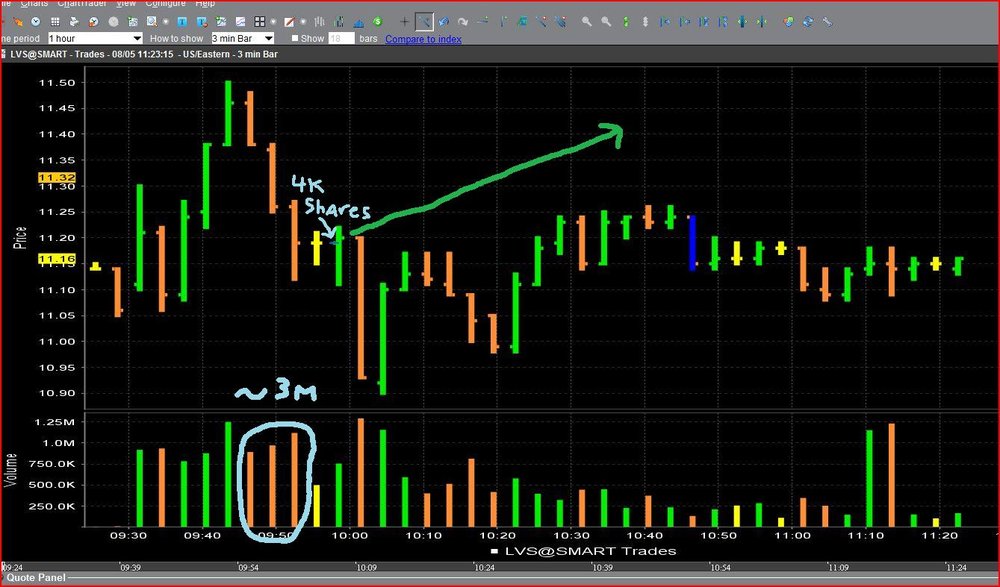
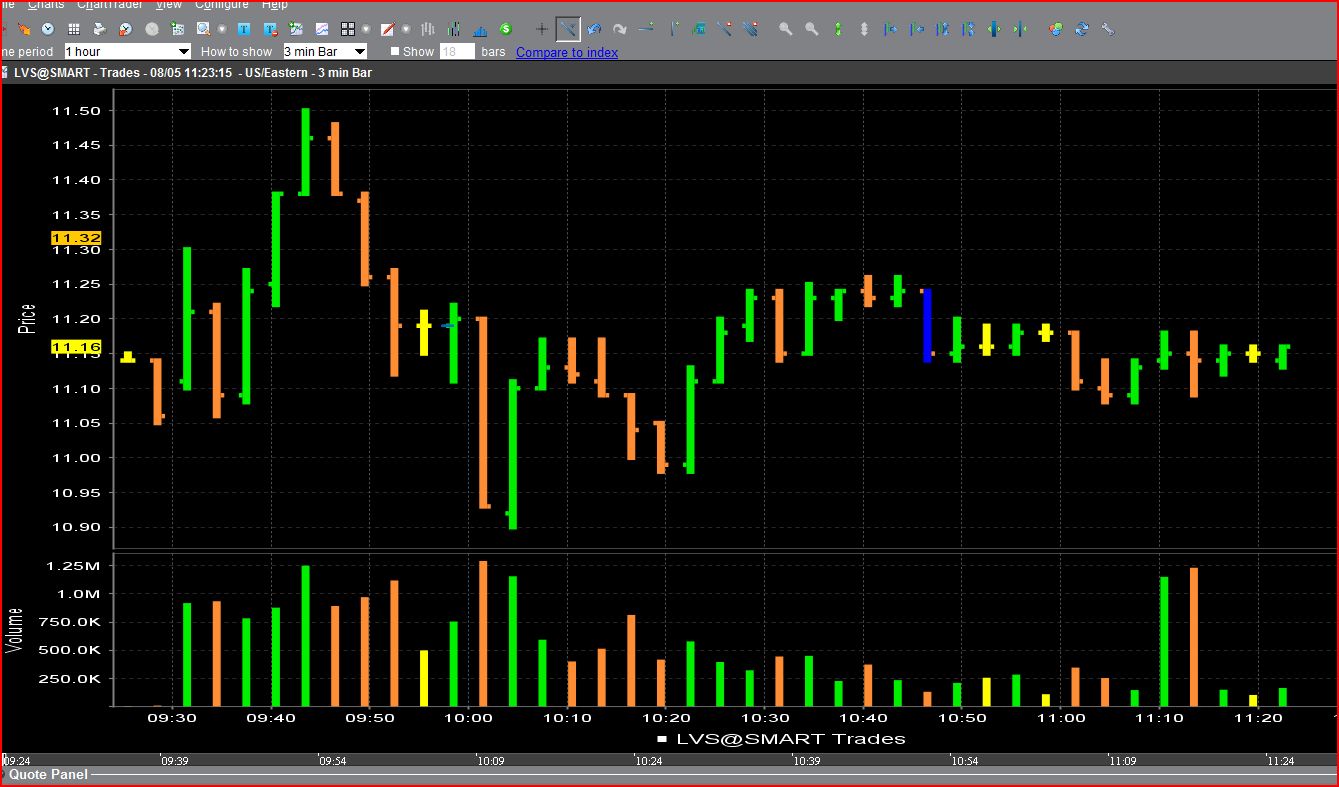
It would be interesting, why and when you entered at 11.19
Attached I show you what I mistakenly thought was a good, yet aggressive, entry point. The green line idicates what I thought I would see after the three strong down bars that aggregated to be about 3m shares.
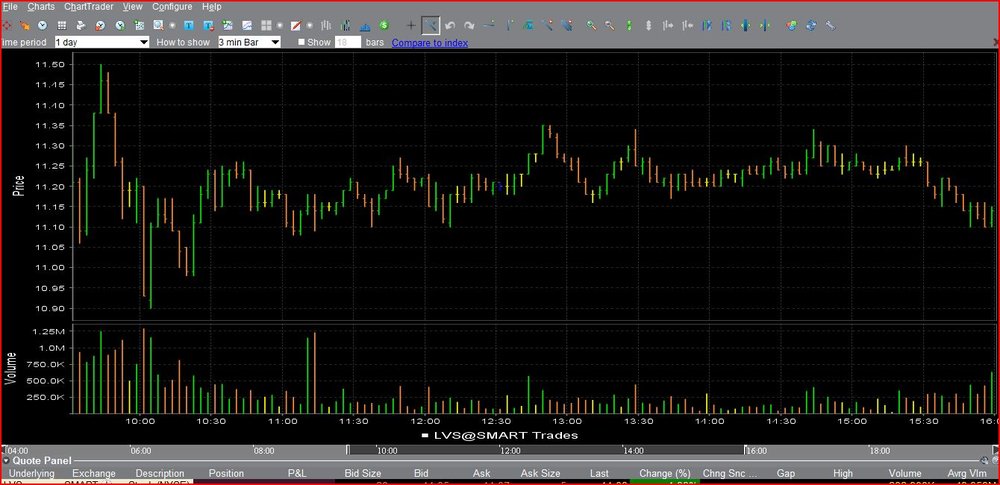
If you look on a daly chart, then you are in the area of a high volume reversal from May 5,6, which closed the gap from last November. It's not surprising, that we have some problems to go up further here.
Truth be told, if I look in the backround that far I my mind would produce so many mixed signals that I would never find a comfortable entry.
-
Hi VJ,
Yeah, this stock really confused me yesterday. I got out with a marginal gain right before it almost touch my stop. So I got pretty lucky. Funny thing is, is that this damn thing is trading at 11.39 this morning in pre-market action on decent volume. I hate holding positions overnight, but had I done that I'd be up a few thousand today. Hindsight = 20/20 :doh:
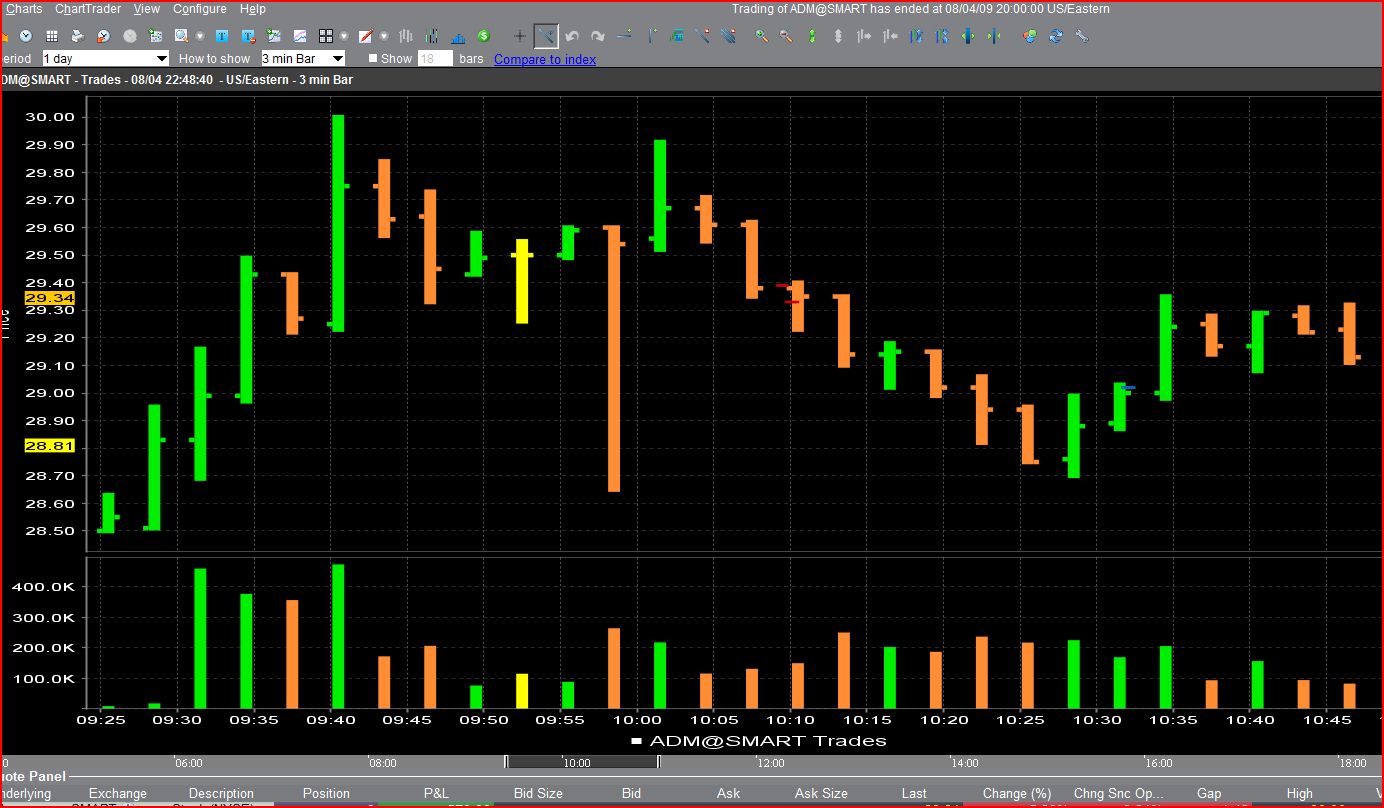
Well, here's the remainder of yesterday's action so you can see what it finished up doing for the day.
Thanks for trying to figure this one out. I'll chime in later about what it does today with regard to that last heavy down-bar from yesterday. Meaning that possibly scenerio 2 is bullish.
Thanks again for your insight VJ.
Cheers.
-
With regard to intraday positions ONLY, how much importance to you believe the long-term backround has (2-4 weeks) as opposed to the short-term backround (< 1 week/2-5 day backround)?
-
Hey VJ,
Can you have a look at this chart on LVS and tell me your thoughts on what the two excessive volume, up an down (side by side) bars are trying to tell us? FYI, the 1 week backround is trending up strong after hitting resistance 2-3 trading days ago.
FWIW I'm currently Long at 11.19.

Any insight would be appreciated.

-
VJ, just want to say thank you for the last three charts as they really helped clarify and confirm a few things for me. And nice short FX call on that chart. Worked out exactly how you thought it would, again, good stuff.
-
8 for 8 on Volume Spread Analysis, 0 for 1 on thread Titles...1 for 1 on newb flamming, 0 for 1 on username originality

Thanks for the heads-up on the SVA/VSA mistype.
-
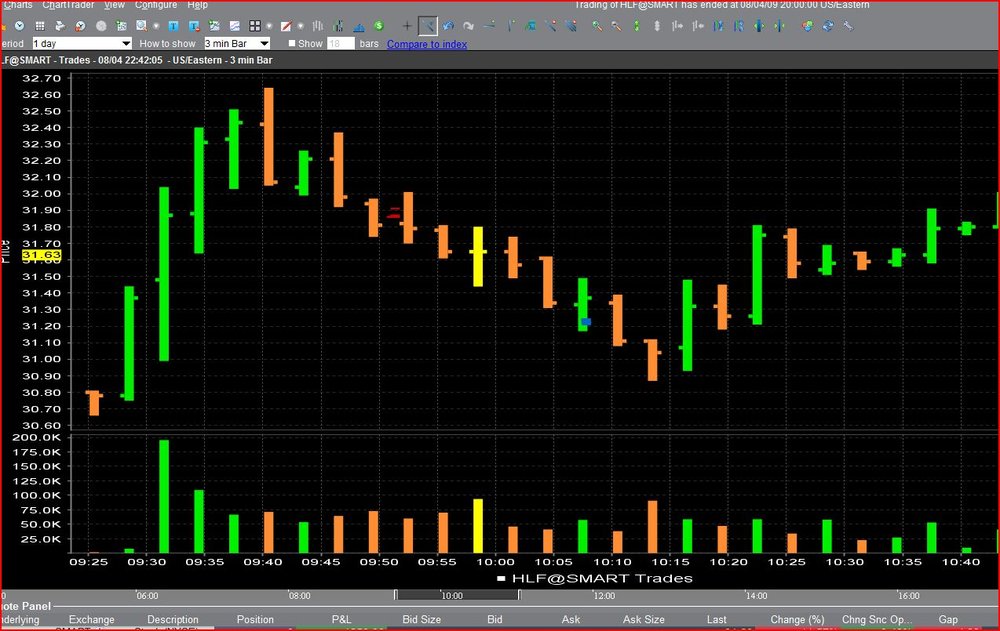
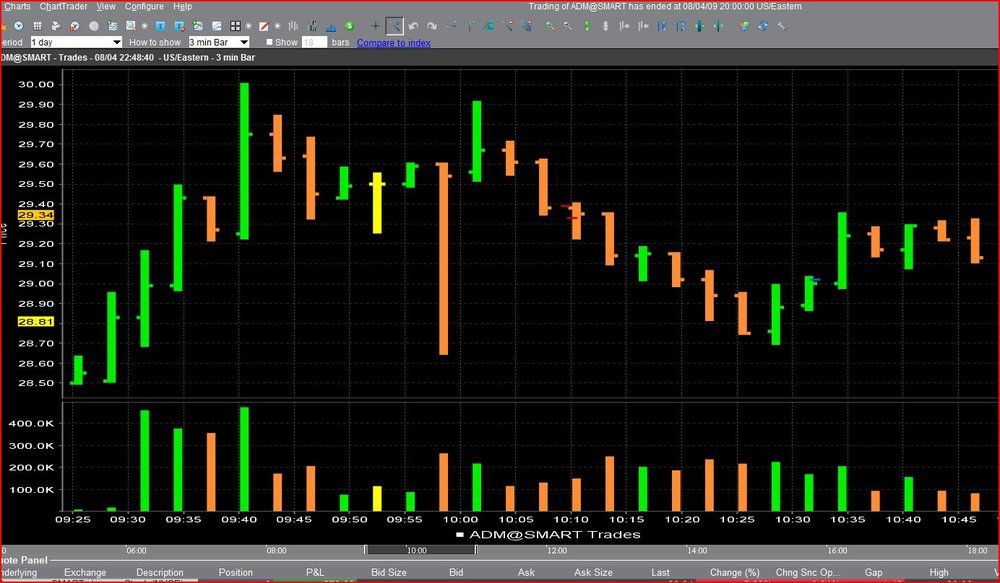
Hi everyone, I'm new to TL but have been trying to absorb VSA and its mechanics for a couple weeks now. I finally decided to incorporate what I've learned thus far and went 5-6 on Monday and today I went 8-8. I'm actually quite excited about VSA as it showing more promise than anything else I've ever tried in the past. With that said, here are my two most profitable trades that I made today <attached>, and what I was curious of is what I might have done fundamentally wrong in these two particular positions. I know they're not perfect trades but I really tried my best. Please pull no punches and let me know where I may have done better, or please point out where I may have increased my risk.
I almost got smoked on a 5k share DELL trade today. I might post that one up too, but I'm more interested in these two as for now.
Thanks for any insight and thank you too all of those TL VSA pro's that I learned so much from so far (you guys know who you are).
Glad to be on board with the VSA crew here at TL.
Cheers,
Chris in Buffalo


[VSA] Volume Spread Analsysis Part III
in Volume Spread Analysis
Posted
Much thanks to you. I saw this chart quite differently with your interpretation combined with that day's pivot point and it's respective S&R's.