
Welcome to the new Traders Laboratory! Please bear with us as we finish the migration over the next few days. If you find any issues, want to leave feedback, get in touch with us, or offer suggestions please post to the Support forum here.


mikea59
-
Content Count
7 -
Joined
-
Last visited
Posts posted by mikea59
-
-
I believe he does his analysis at the EOD, after he is done trading. But you are right, he seems to spend a lot of time doing this analysis and answering questions, I'm not sure what his motivation is, I assume he is well intended, but it just seems kind of strange.
Also, the kind of EOD analysis he does is flawed in my opinion - so heavily influenced by confirmation/hindsight bias. When he has so many different setups, and many of them are just "approximate" setups, it's so easy to point out the successful ones after the fact. I think when you are evaluating a trading system it's more helpful to concentrate on failed setups, because those are the ones that you will most likely stumble over in live trading. If you are overwhelmed by a large number of failed setups then you should walkaway from the system.
-
Actually the bar after bar 2 was the H2, bar 2 was the setup bar for the H2. This is the most popular topic here and you need to go back to page 1 of this thread and read through. There is a lot of discussion on Highs and Lows. You will come across links to several of Dr. Brook's presentations. If the links are still good, save them and watch them. The first presentation "Short Term E-mini Strategies That Work" is particularly good on the subject. The method works in all time frames and the book has a chapter on daily, weekly, and monthly charts. Good luck!I am constantly struggling with this as I read the book. I believe Al makes no real distinction with labeling his H1's, H2's etc. with regard to the entry bar and the signal bar. Sometimes he calls a bar an H2 when the NEXT bar is really the higher high, sometimes he calls a bar an H2 when IT is the higher high. Very confusing to the reader, but I'm getting used to looking at his H1's, H2's... and just realizing that he might be referring to the next bar.
Also, I think he is guilty of hindsight analysis. In figure 1.18, there is no trend established in the first few bars, best you could say we're sideways, or really bearish if you consider Y. So, you should maybe be looking for Ln's. After 7:10 or so, we start to see a bull trend, so bar 2 (or the next bar) would be a H2 in light of the fact that the following bars are bullish. Labeling bar 2 as H2 in real time is nothing more than a guess.
-
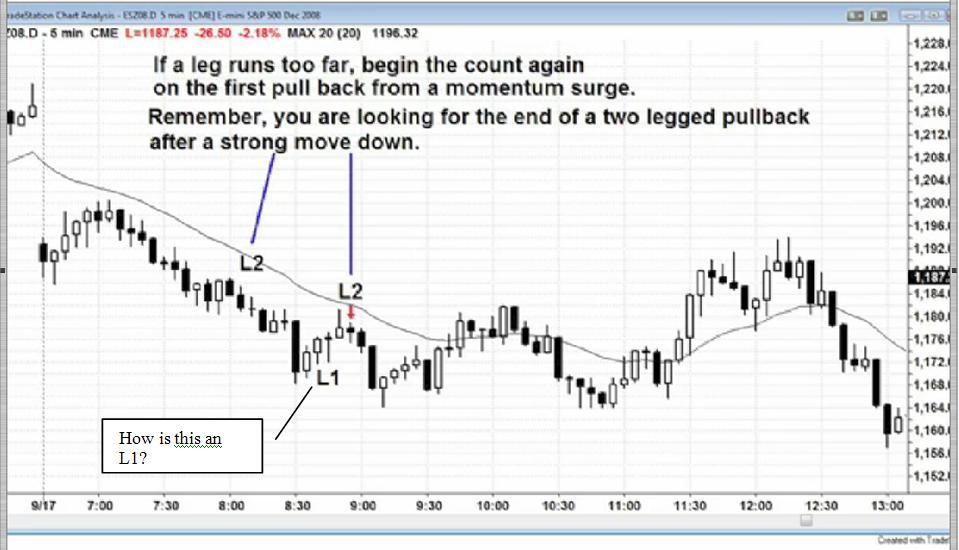
He answers that question in the seminar. It's an L1 variant. Think about the price action intra-bar. The market went up into that doji bar, dipped down to the low of the bar and then rallied up to the high of the next bar. Up-down-up. Even though the price never went below the low of the previous bar, it would have on a smaller time frame chart. That is a two-legged correction which is what you are looking for.Thanks, that helps, but it's quite a subtle point, something that can be seen in hindsight, but not easily spotted in real time and certainly not well described in the book. To me, it looks like a single leg.
-
The very basic of questions:
Still stuck on basic concepts like L1/2, H1/2. This chart is from one of Al's seminars, see the L1 - how is that an L1?
-
Anyone who has spent time with Al's book knows Wiley did an awful job of editing and proofreading. There are many typos in the book. Some are just grammatical and do not affect the content value but there are some that do. On his web site Al says he will correct them in any second edition. I feel that IF there is a second edition it will only be because people bought the first edition and they should not be penalized for doing so. Therefore I am listing the known errors I have found so far and encourage others to add to this list.Page 34 3rd Paragraph:
“not the Bar 6” number should be 8
Page 123 3rd Paragraph:
"but Bar 17 was a bear" the chart was mislabeled Bar 17 should have been the bar before
Page 158 1st Line:
"but at least its close was above" should be "above the midpoint"
Page 205 2nd Paragraph
"bar 10, was above" should be Bar 9
Page 238
“Bar 12 was a bad bull reversal” should be bar 11
Page 245 2nd Paragraph
“countertrend bar (bar 9)” Should be (the bar before bar 9)
2nd to last Paragraph:
"bar 3 in figure 9.24 was a huge bear trend bar that followed four "
last word should be three
So frustrating to be trying to learn new concepts and have to be constantly filtering every sentence for possible errors - "Did he really mean what he is saying here or is this another mistake"
BTW, Al says he is discontinuing his web site - too much distraction from trading.
Al: "I will therefore be shutting this site down in a week or so and return to my trading cave to work on my trading goals."
Makes me wonder if he is having problems with his trading. Seems like he was looking for another source of income from his web site, why would he do that if he was successful trading.
-
My first post on this forum...
This book is about to drive me crazy, there are so many inconsistencies or down right errors - I'm about to give up. For example, H1, 2, 3, 4 and L1, 2, 3, 4 definitions and examples are just not consistent throughout the book. Check out page 120, Figure 4-16. This chart shows 11 Lx's in a strong bull trend right after he explains Lx
"Likewise, a Low 1 (Ll) occurs in an down or sideways market, and a Low 2, 3, and 4 are comparable to their High 2, 3, and 4 counterparts."
Clearly the first part of that chart is in a strong bull trend, why would he even consider identifying Lx's in a strong bull trend. He does go on to say:
"Although many are labeled, when the market is clearly trending up, you should not be looking to sell most Low 1 and Low 2 setups."
By his own definition, a Lx doesn't even exist in a bull trend.
I really have the sense that price action is the way to trade. So many indicator based mechanical systems I have tried have failed. I was really hoping (based on favorable reviews) that this Brooks book would be the definitive PA book - please, someone tell me that there is a payoff for reading this entire thing, I'm not sure I can get through it without some hope.
Futures I Trade Show & Brooks Book
in The Candlestick Corner
Posted
Your identification of L2's and H2's doesn't seem consistent to me. The L2 at about 9:35 for example - shouldn't the next bar be the L2 (a lower low)? Your L2 was indeed a pullback towards the EMA, but certainly did not close below the low of the prior bar.
The last L2 of the day around 14:00 is another example. It looks like it's L is the same as the prior bar, so I guess it's close to a lower low, but technically not a LL. That 14:00 bar still looked like a good short because of the prior resistance, but you can't say it's an L2, can you?
It looks to me like your L1/H1's are LL/HH's, but your L2/H2's are pointing to the bar BEFORE what I would call an L2/H2.
Anyway, you seem to have a decent grasp of at least one of Al's methods, where I am still struggling.