
Welcome to the new Traders Laboratory! Please bear with us as we finish the migration over the next few days. If you find any issues, want to leave feedback, get in touch with us, or offer suggestions please post to the Support forum here.


boru
-
Content Count
61 -
Joined
-
Last visited
Posts posted by boru
-
-
I am fine with whatever rules you want to impose, it is your forum, I'm grateful the knowledge is being shared by all so openly, I will have to delete my 5 min chart and work up a 60.
Don't overdo it. Try a 15m
-
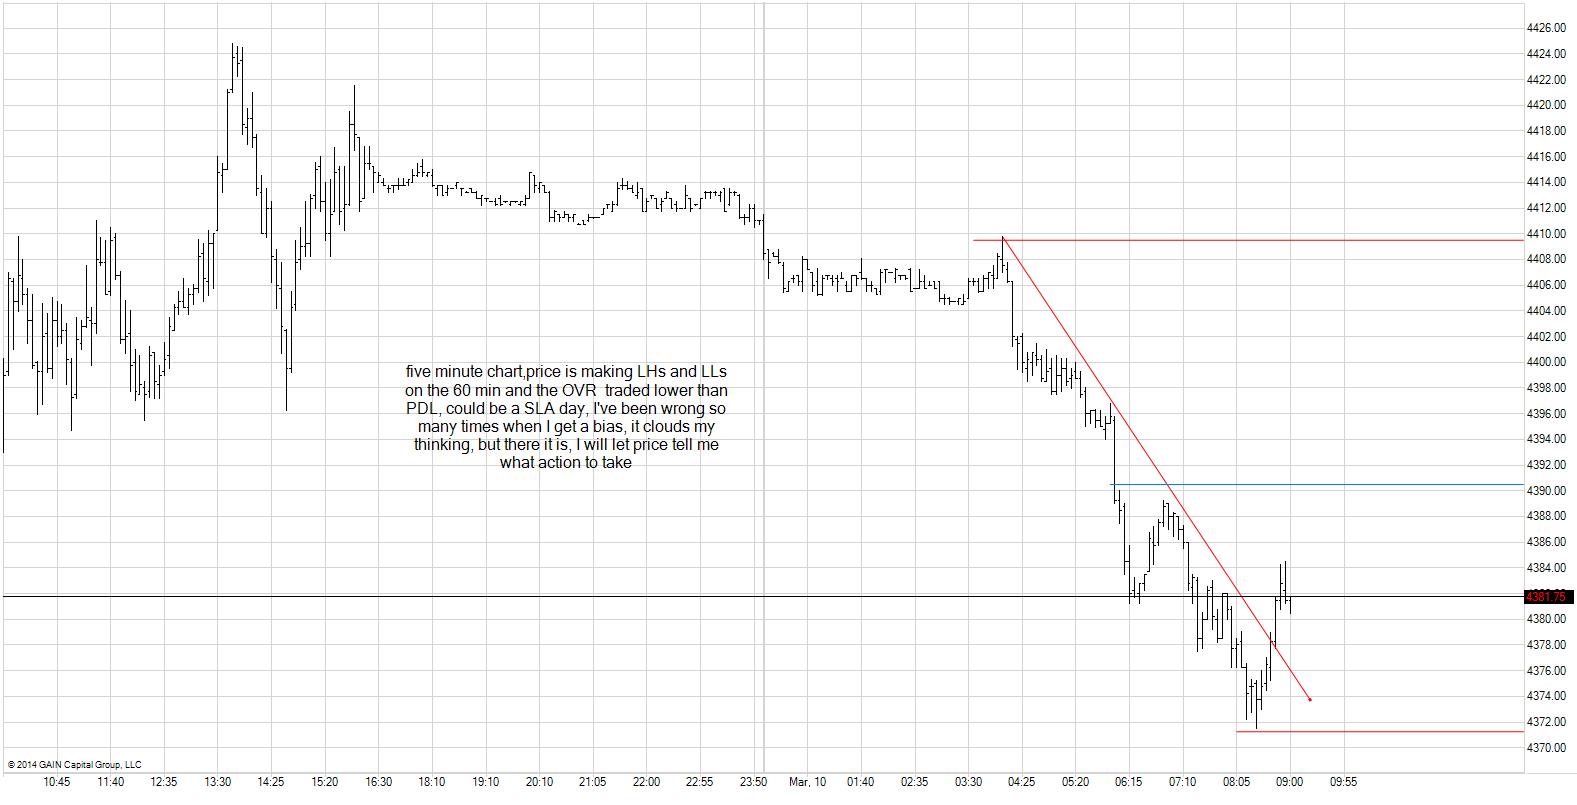
I must be missing something the time and levels aren't matching up Db, I am posting a 5 min chart
See my 5hr chart from yesterday pit stop at 43?
-
not sure I will be free today, very likely will be in and out, these are the levels I'll be focusing on to see how price reacts at them. I am curious how others approach replay, I have always run mine at 2x and watched at least the opening thru 12:00 . My thinking was its as important to see how price approaches these levels as much as what it does once its there. Lately I've been jumping right to the areas trying to pinpoint entries and exits. am open to suggestion, thanks
I posted a corrected chart to your ET journal. Your lines are incorrect and will mislead you.
Ah! It worked. I wasn't sure if I could transfer it by URL. I saw that Thanks, as much as I would like to use the TCs right now they are more of a hindrance than a help. I have other things to work on,
-
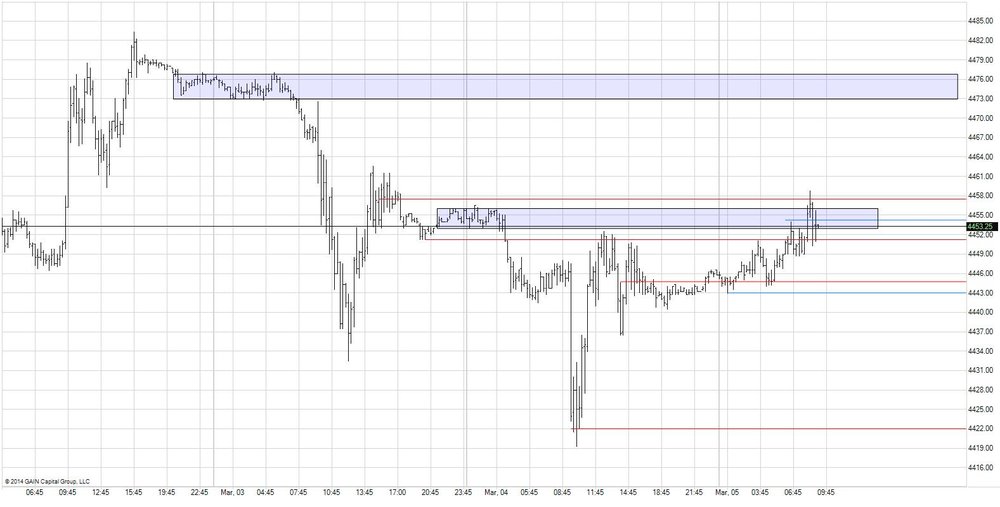
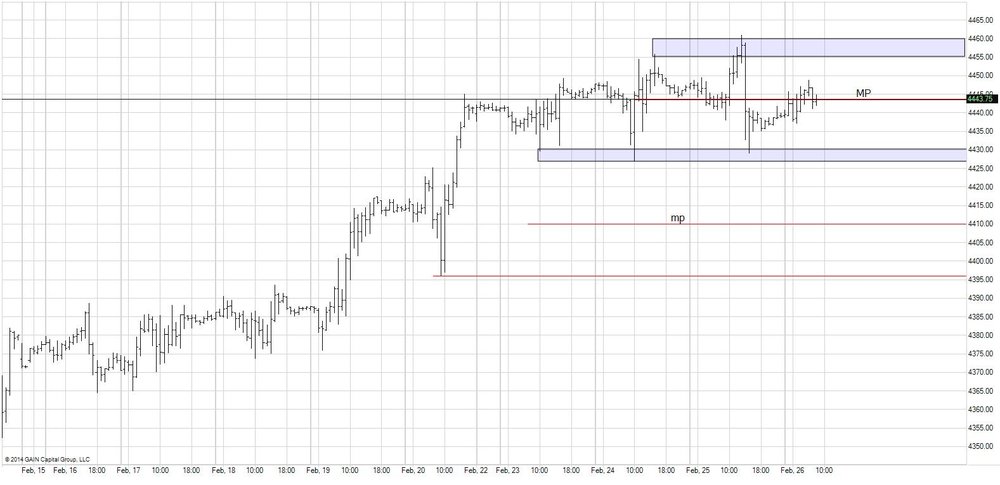
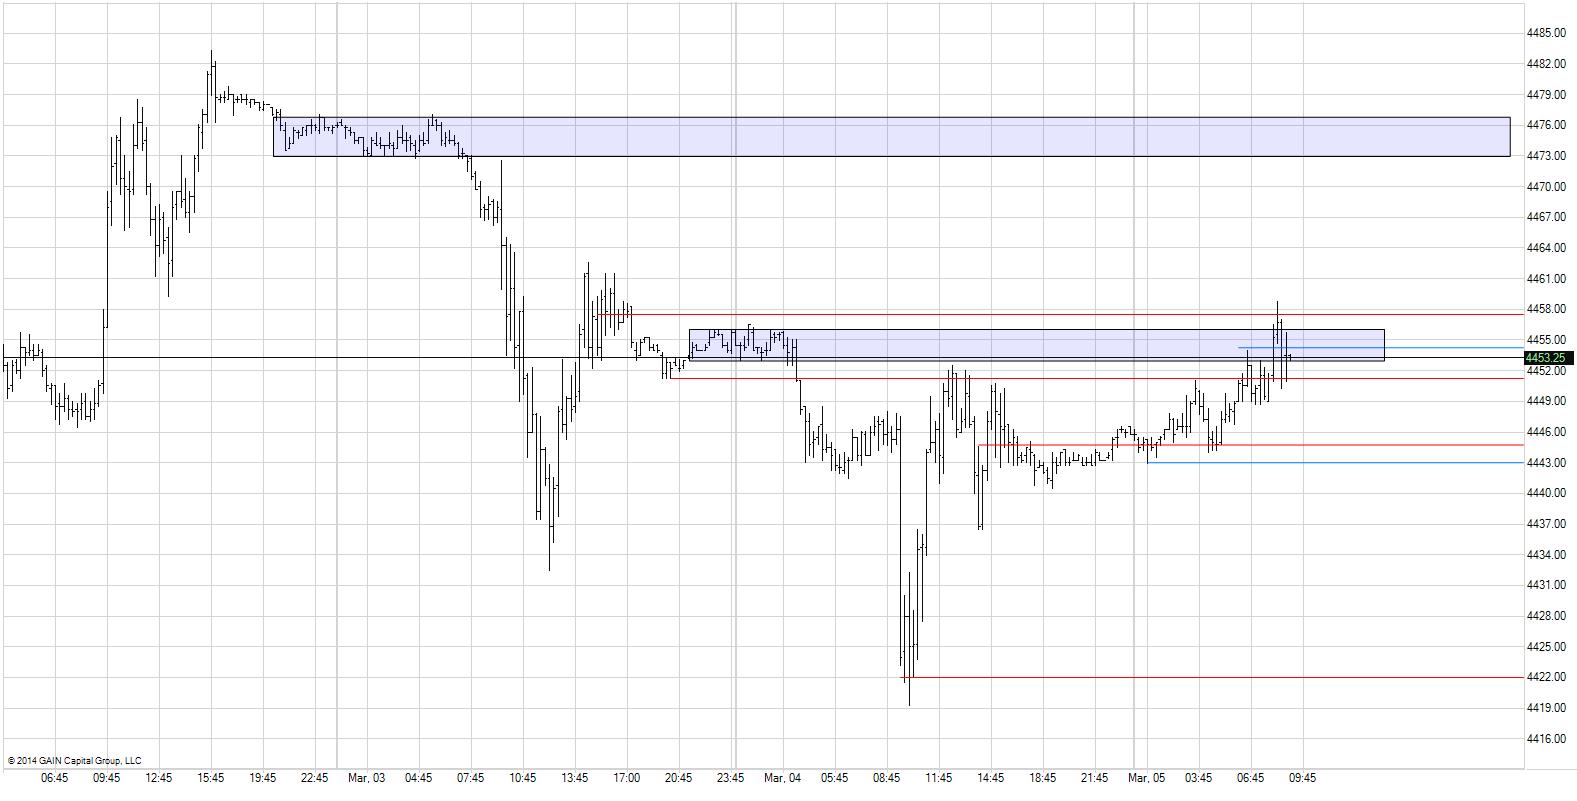
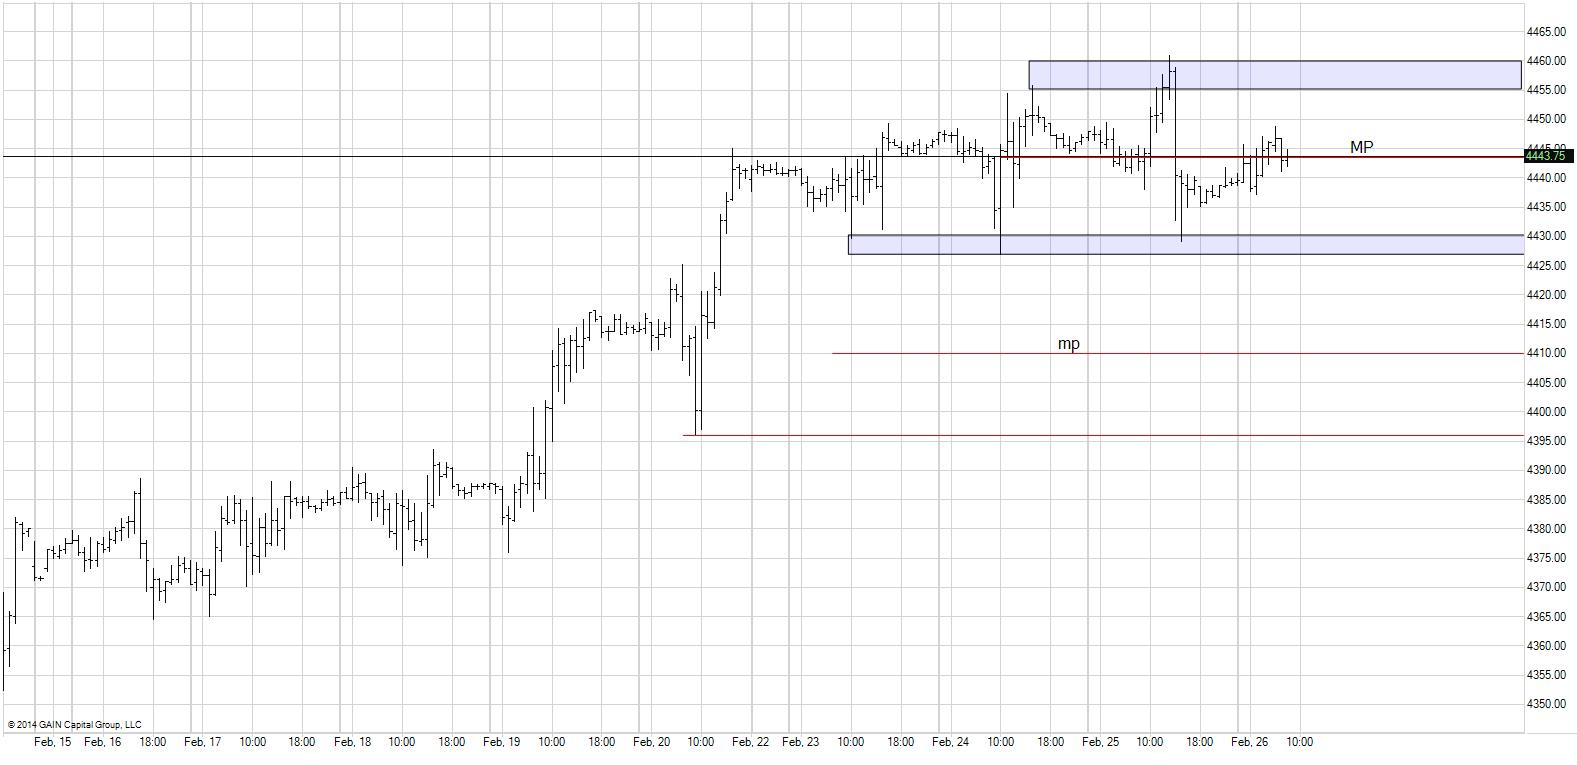
price still trading around the mean
-
price is flirting with MP and OVH
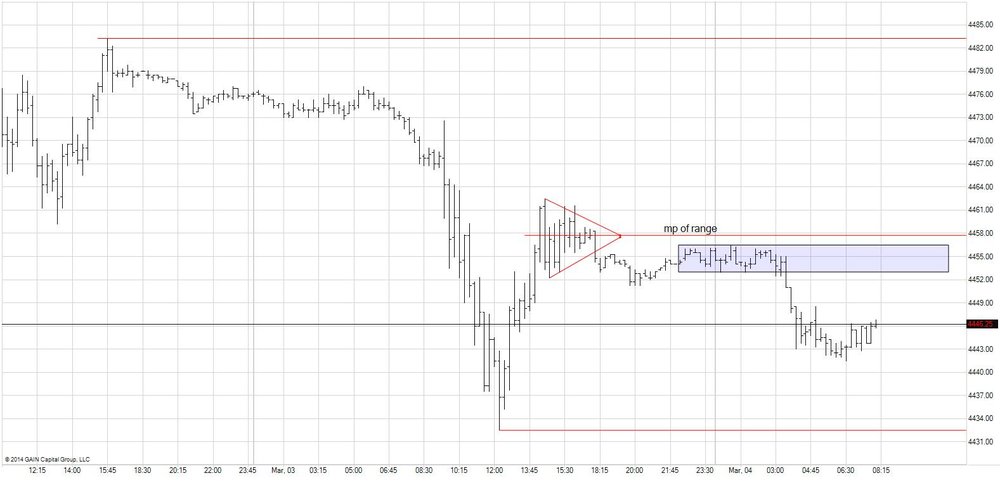
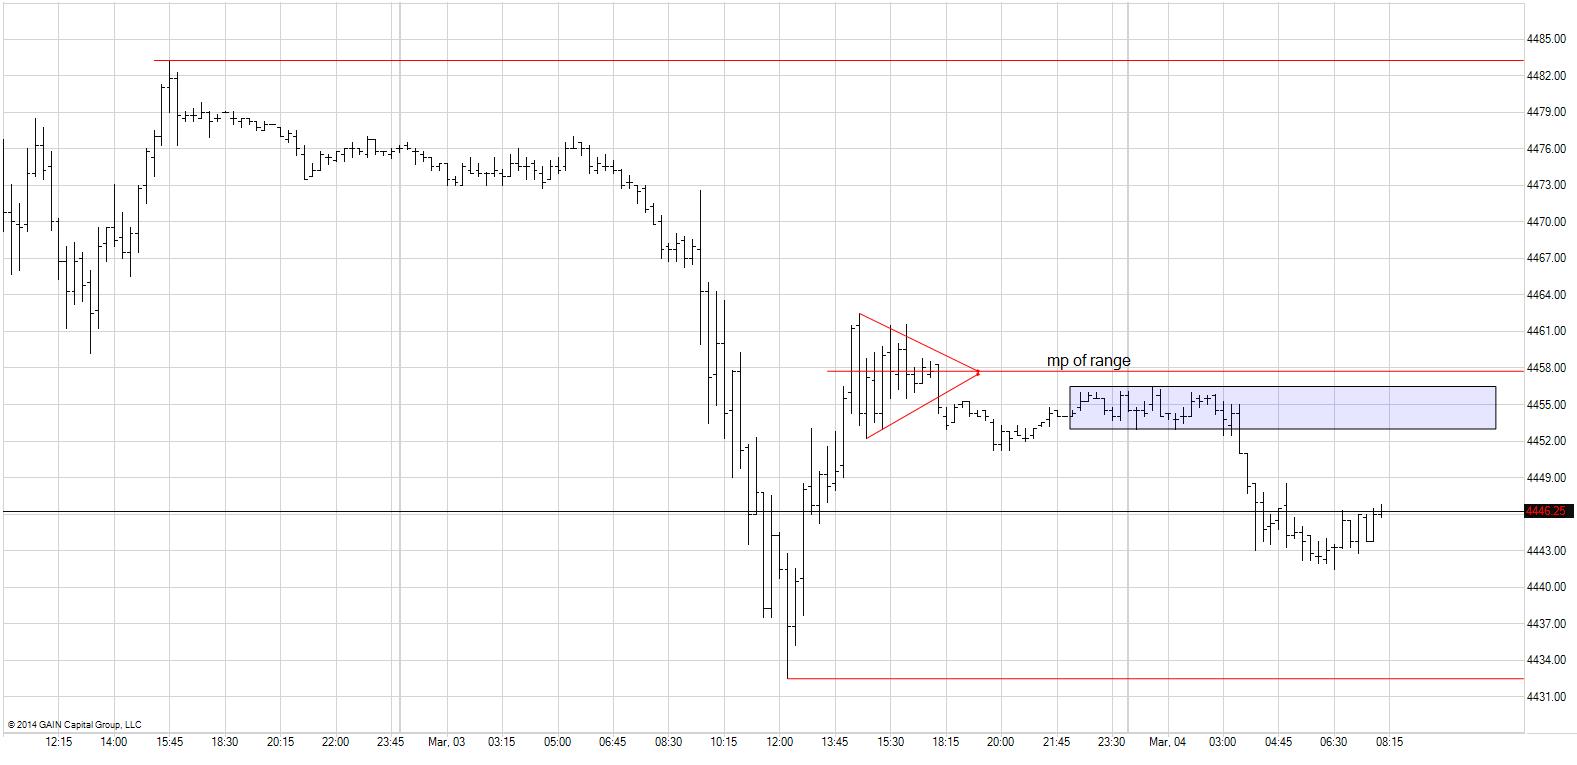
10:00 the only good entry I saw today at the 50% lots of small tight ranges , looks like an uptrend on the 60 tho, good trading to all
-
nice to see I'm in the ballpark with the pre market
everybody gone?
-
nice stuff thanks Db
-
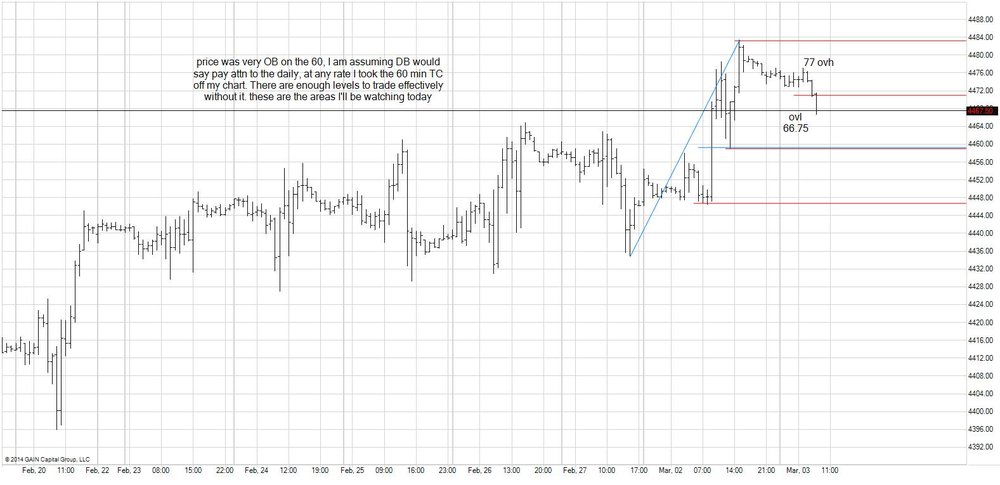
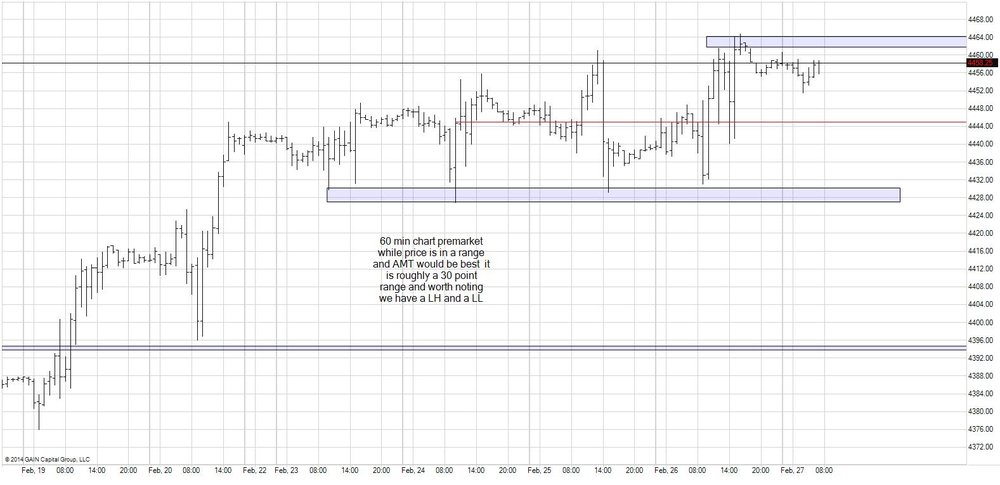
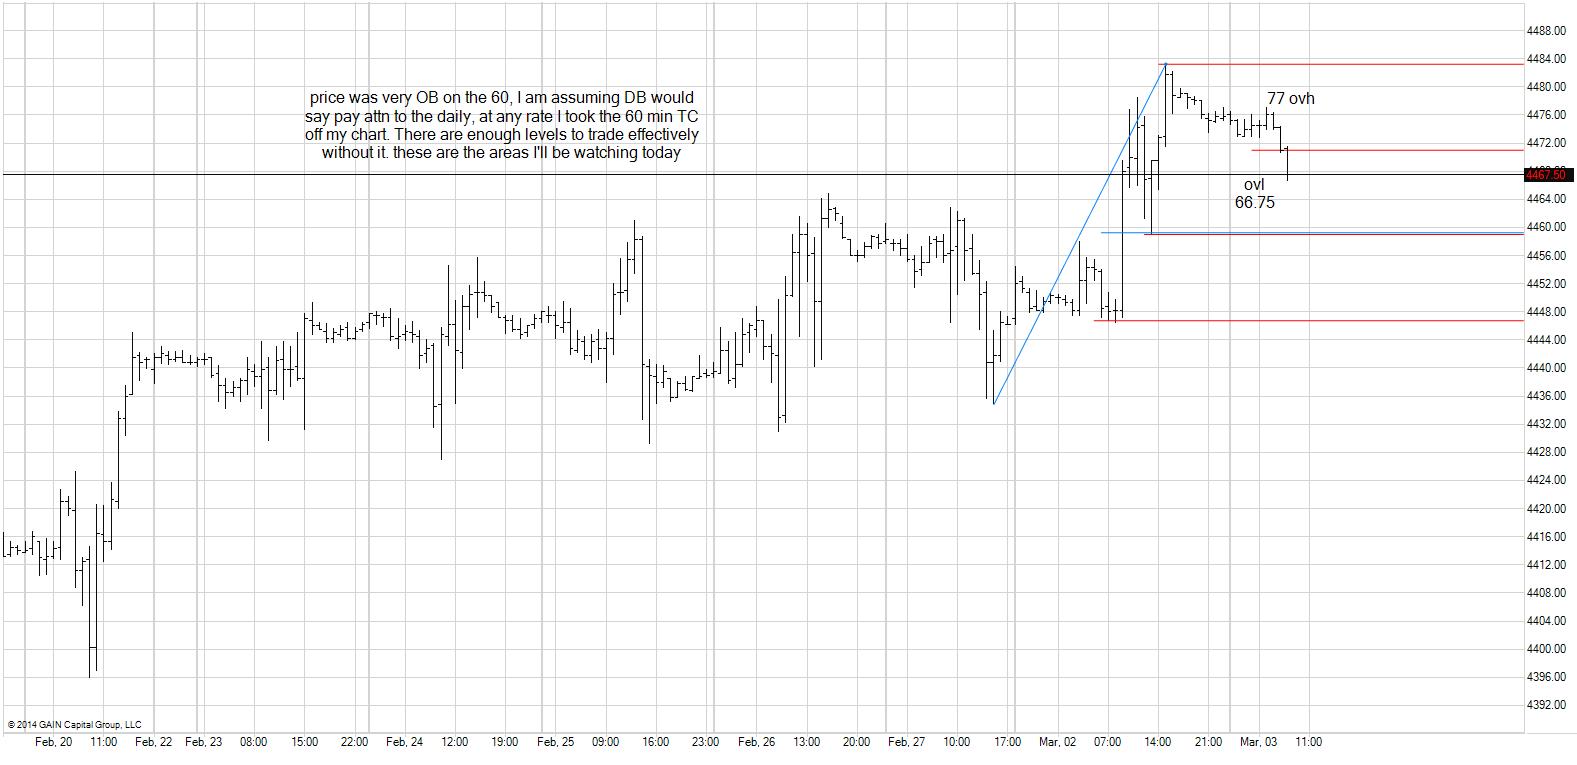
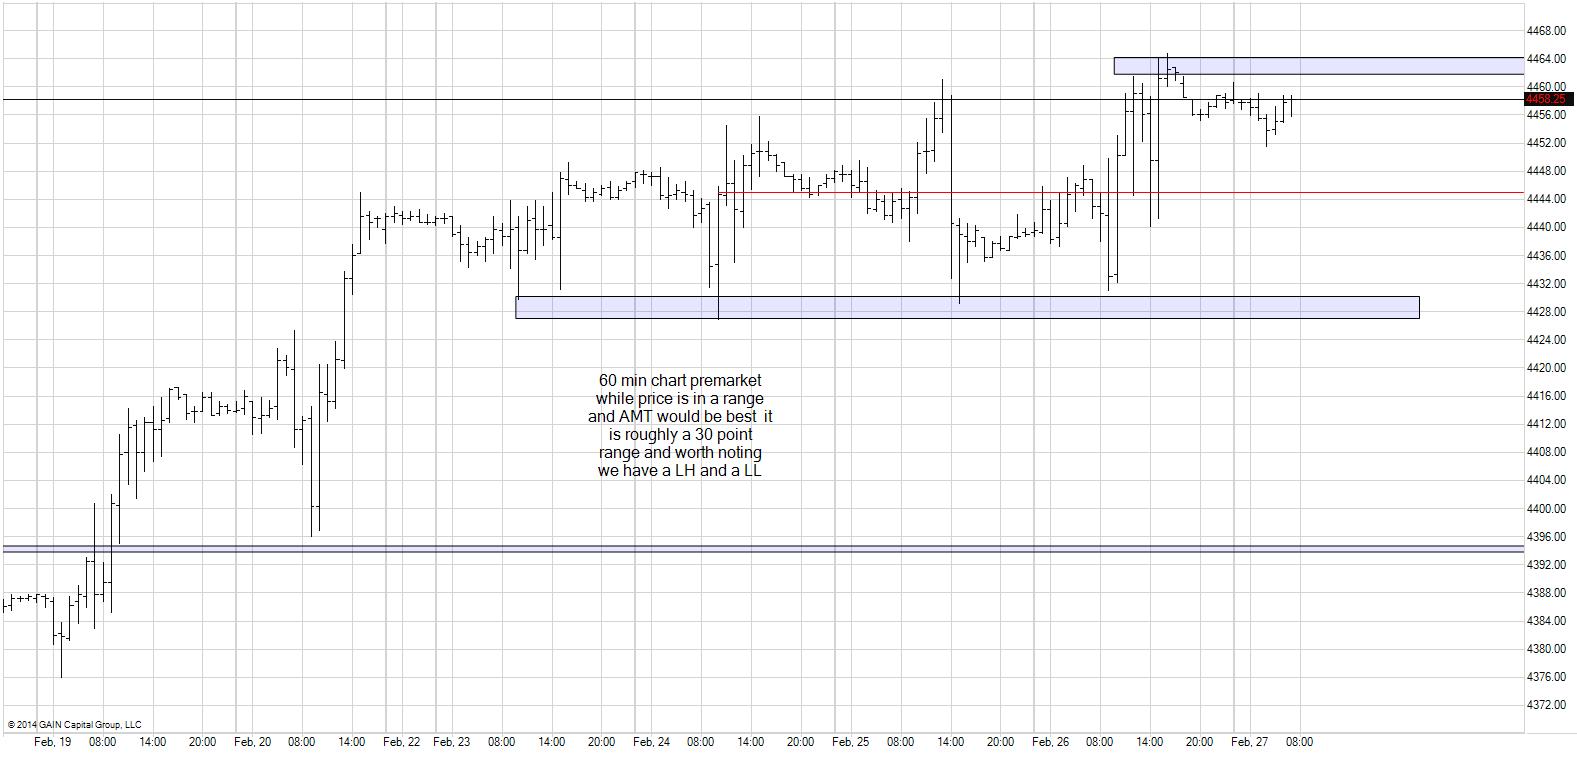
using fortydraws advice to gears am paying more attn. to price levels on the 60 min chart. This is what I'm looking at this morning
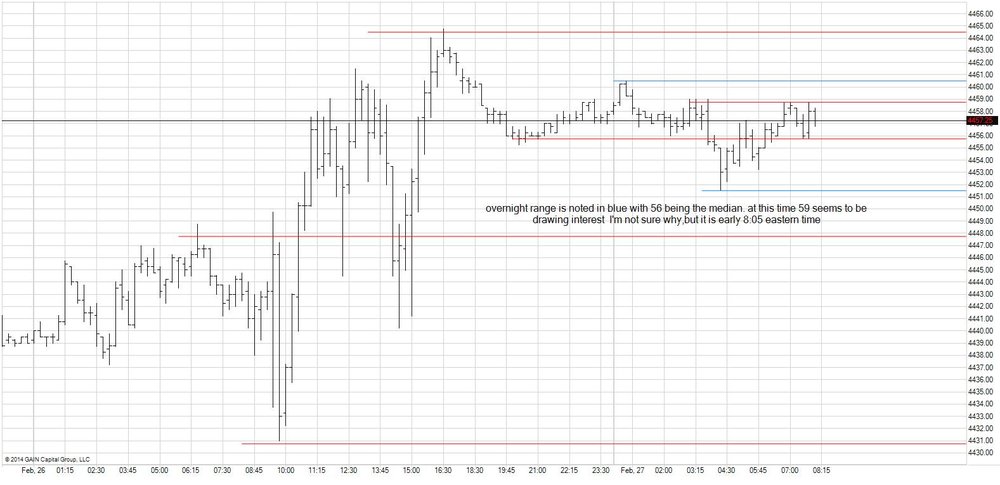
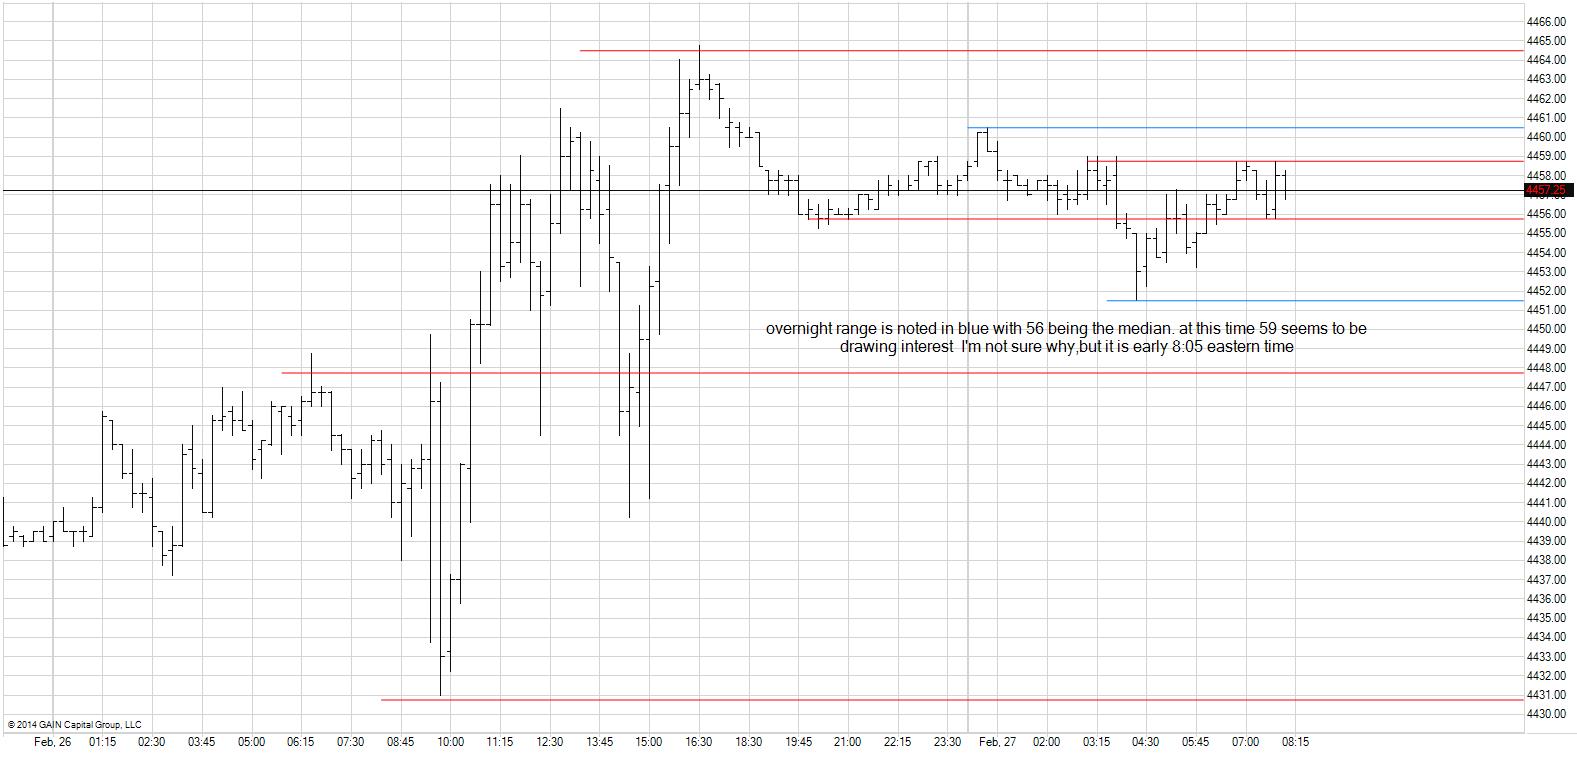
9:37 buyers stop buying 59-62?
-
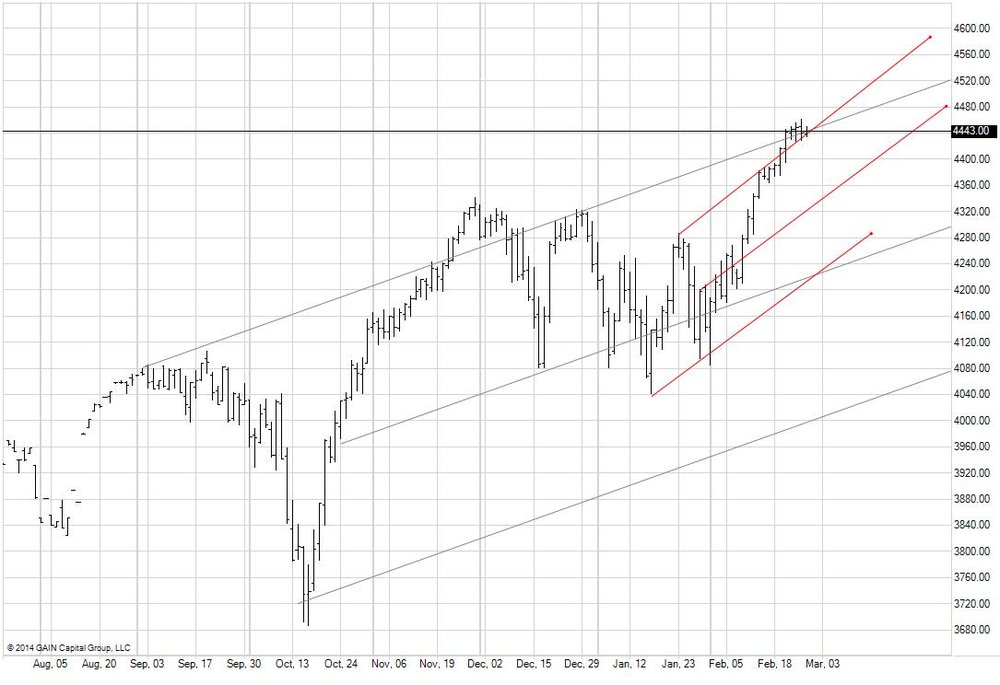
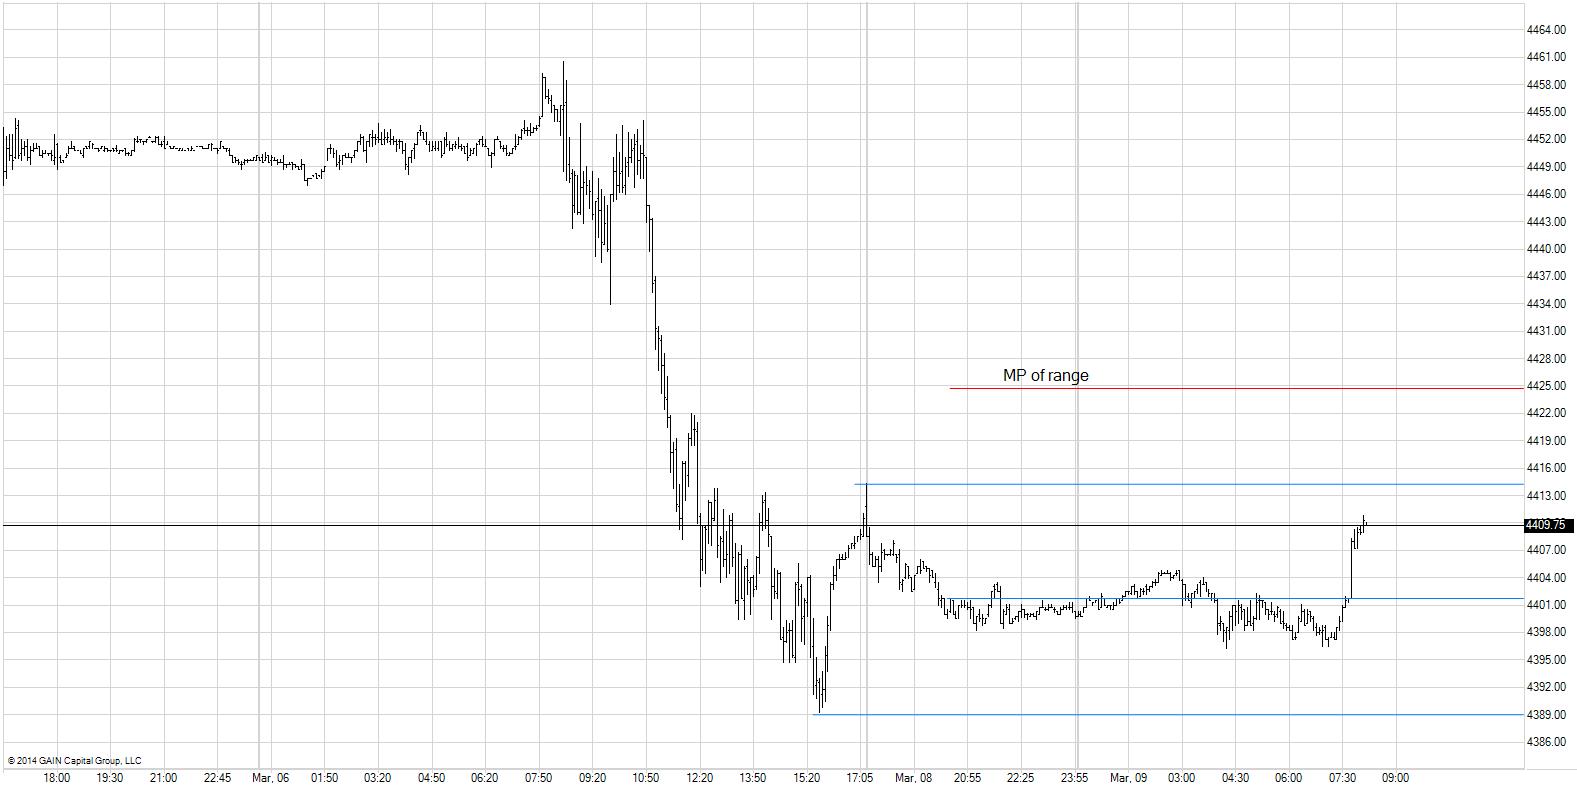
price is still trading range at the top of daily trend channel the chart posted is a 60 min with the levels I'm watching. Something I wrestle with when looking for levels as the open approaches, I try to narrow them down to as small a range as traders have shown a willingness or unwillingness to trade, but I have the median at 46 of the larger TR while 49 is the Median of the more recent range , should I watch both? Does the larger TR trump the smaller?
-
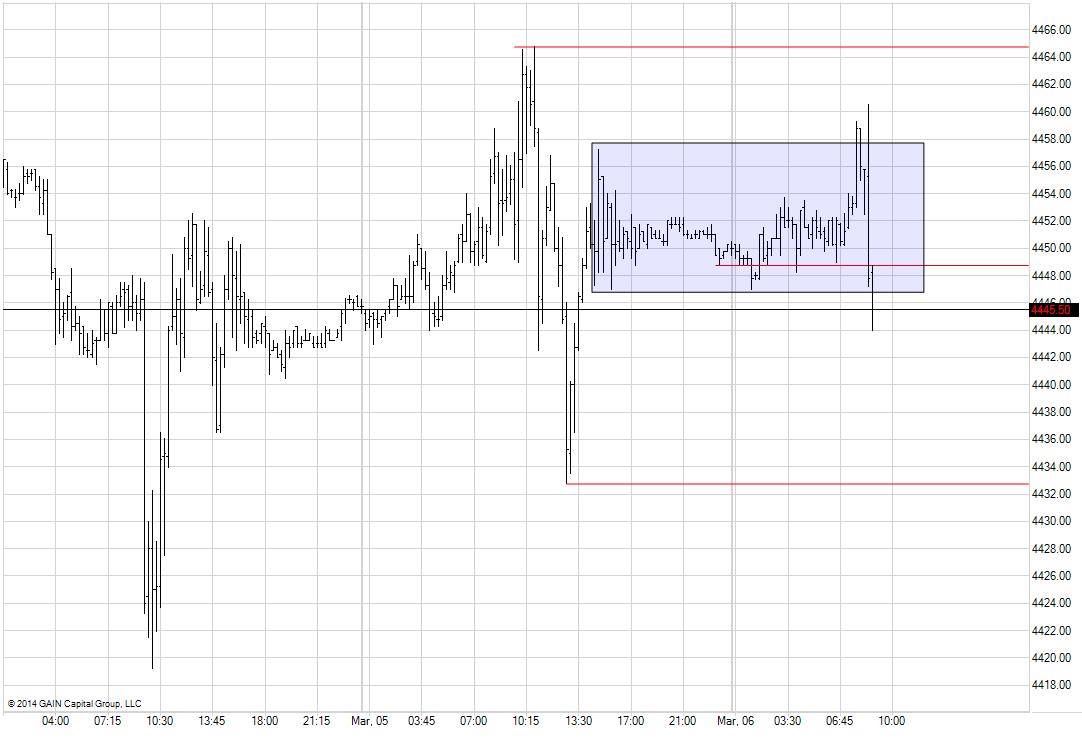
I know its early and subject to change but...
can someone tell me why when I edit my previous edits are erased? tyia
No idea. Sorry. Try clicking Preview Changes before Save Changes.
-
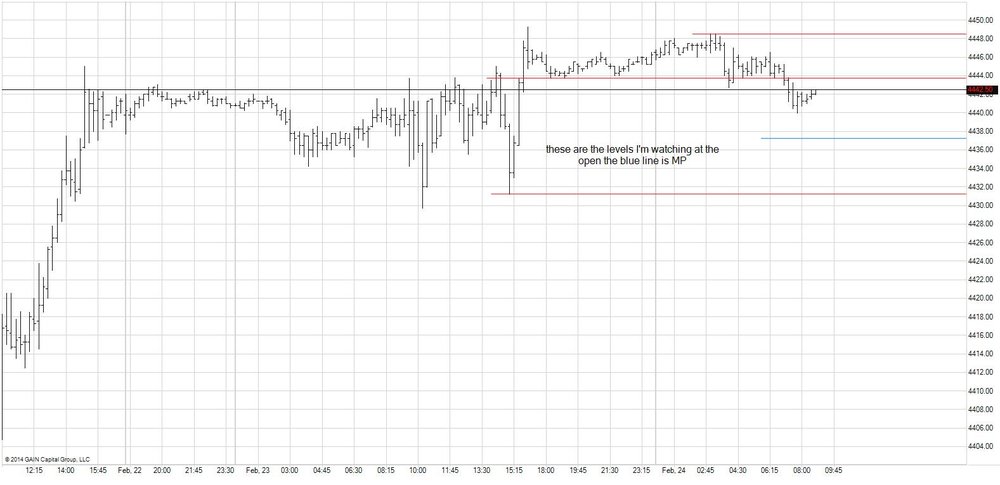
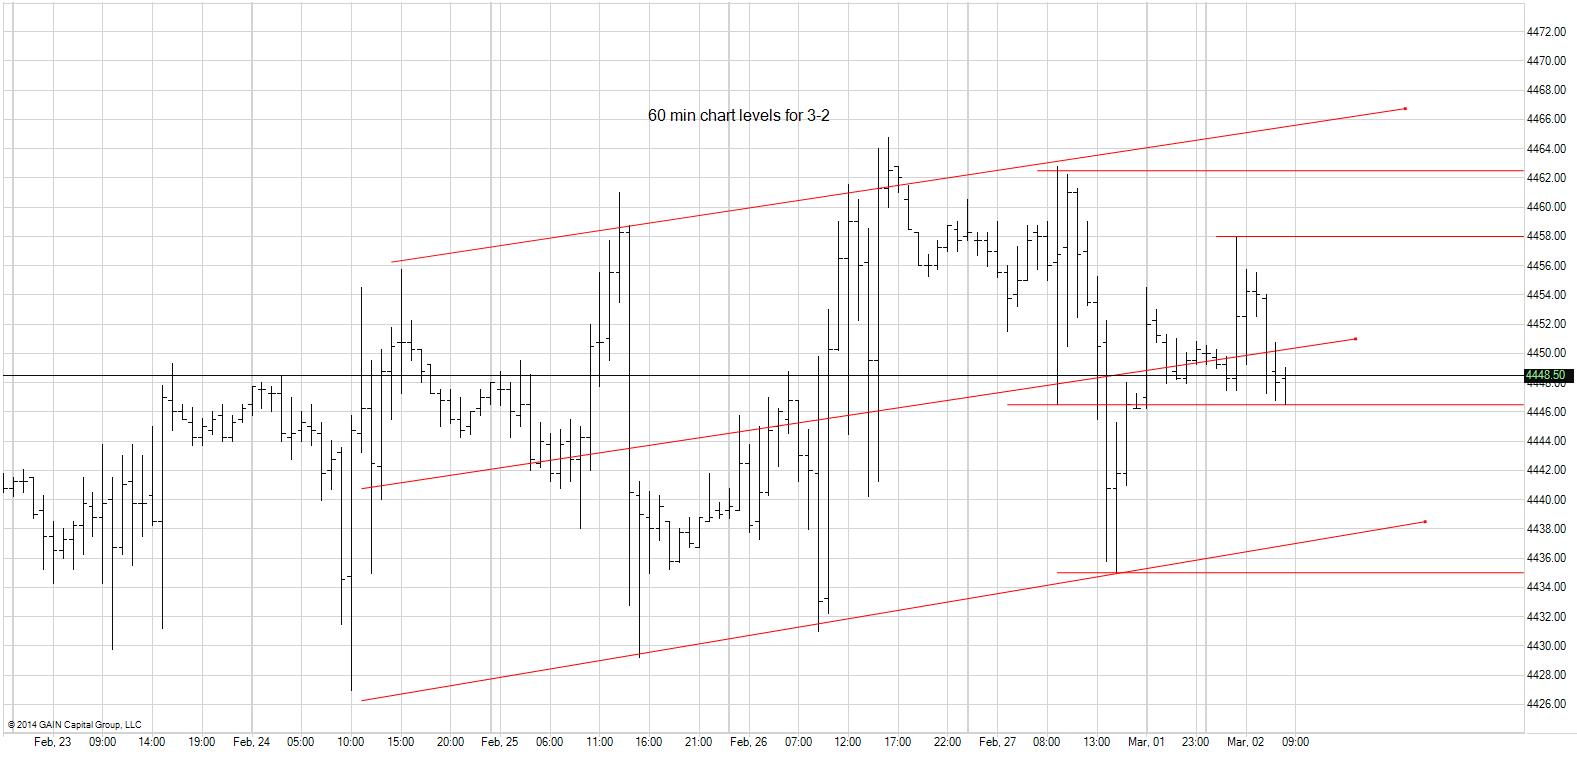
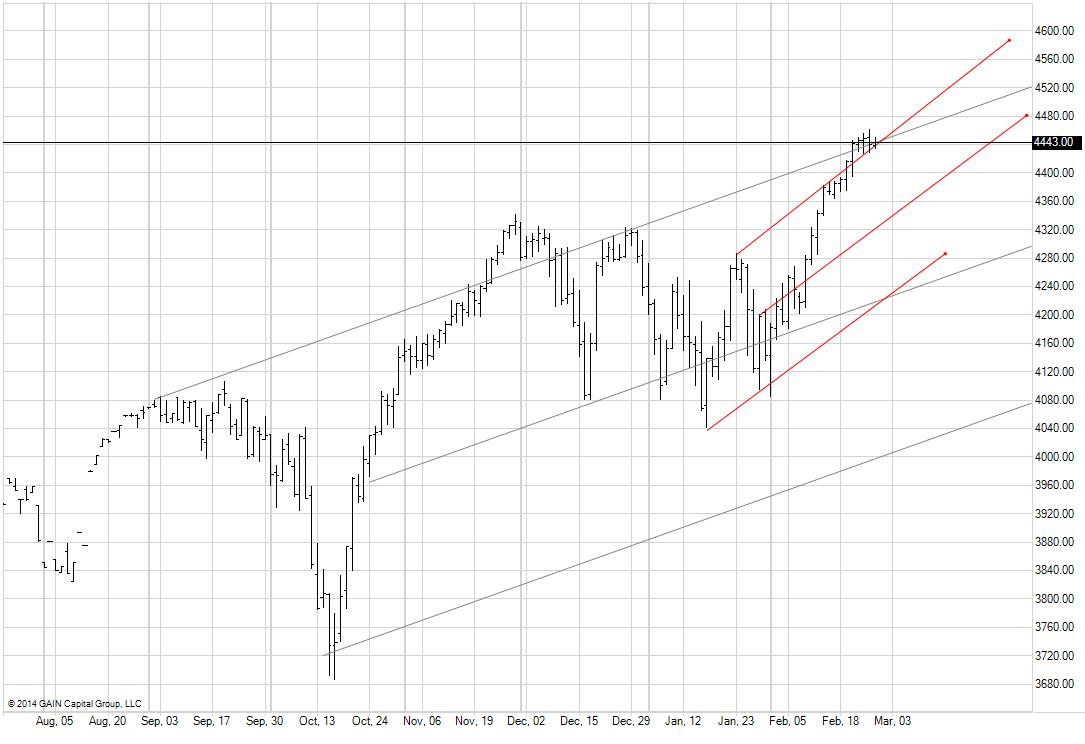
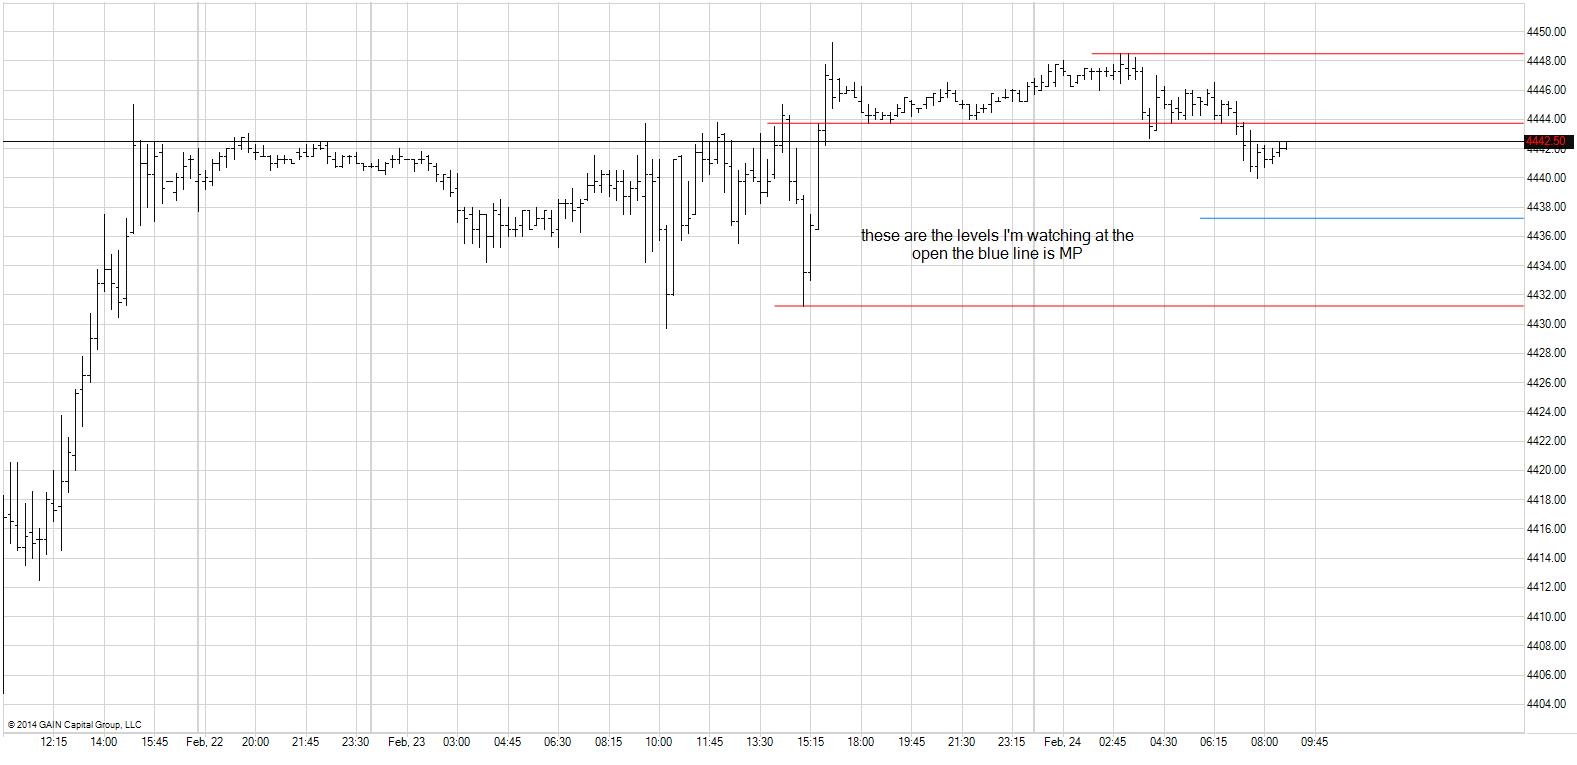
the levels I'm watching at the open using a hr chart also posting a daily chart for a bigger picture
well it was a slow grind but price traded up to 58 now REV ?
-
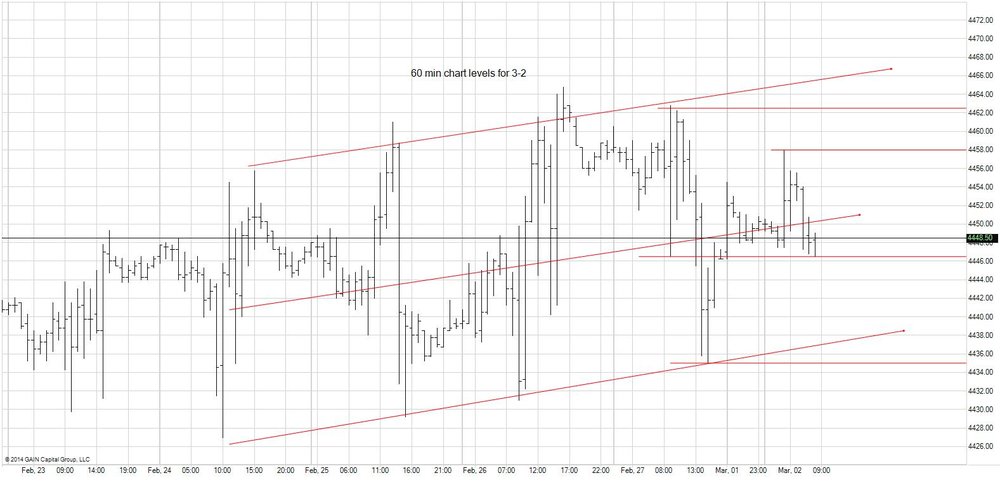
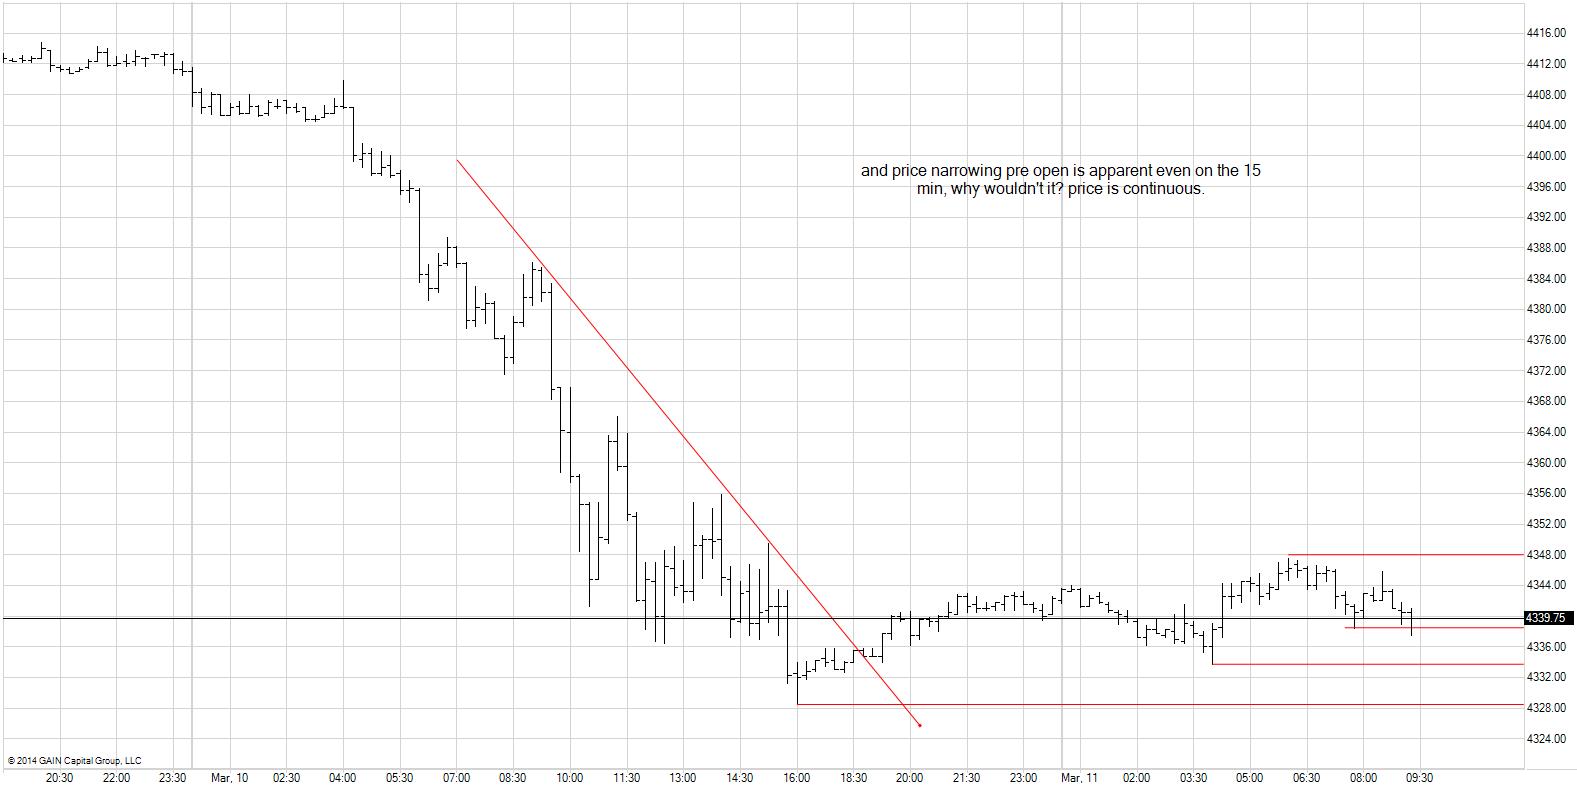
some levels I'm looking at 15 min chart
-
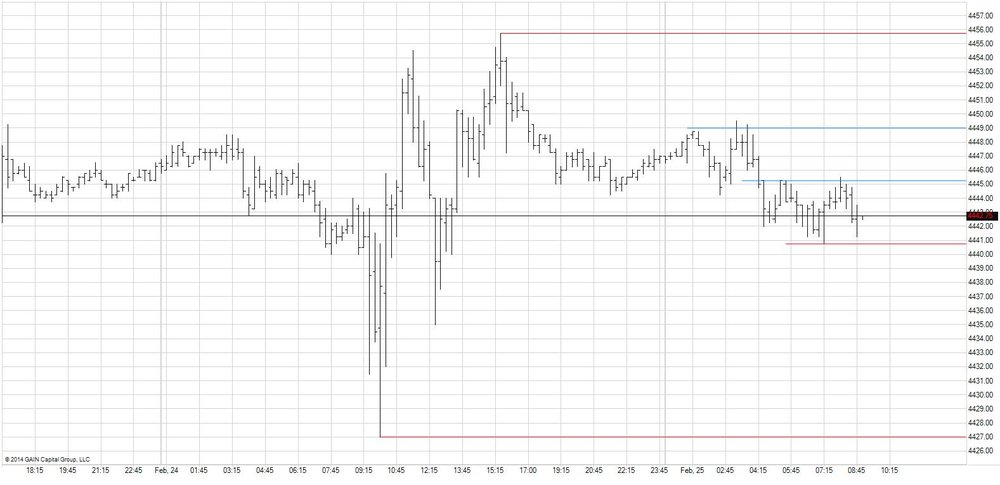
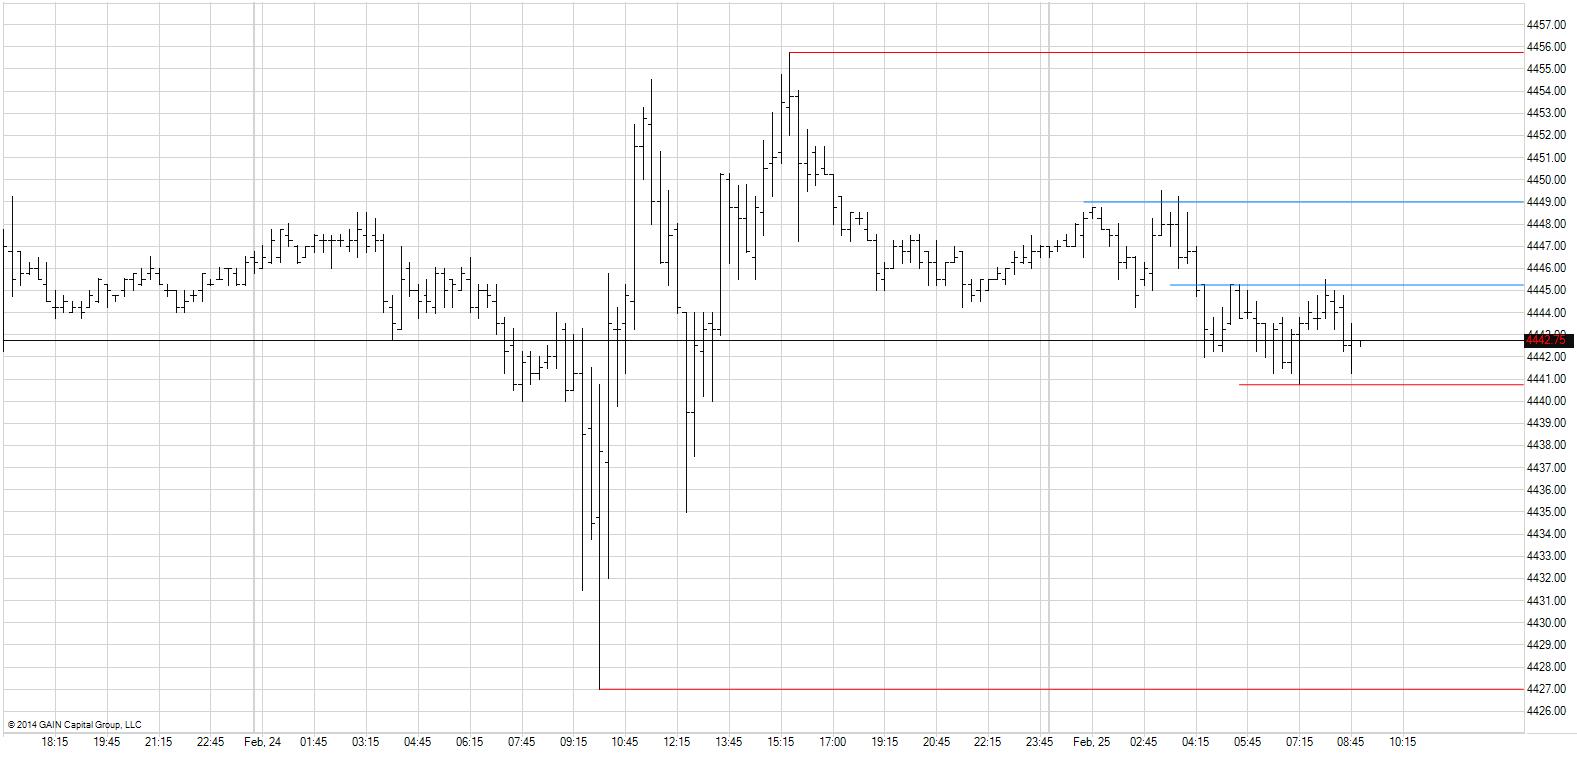
these are my levels for2-24 pre open
-
Kp for what its worth, be aware of the failures, I think you could have entered earlier at a for sure and maybe d too.
The more I watch price the more you will see price turn before the lines, db is right after you understand how price unfolds you are better off without the lines just my 2 cents. This is something I am still working on.
-
Niko, sometimes we have to take a step back to continue to go forward. It may be good to take a break and let your feeling settle. You have been an example and role model to me with your hard work and willingness to share. Wishing you the best bo
-
Nice play by play, thank you gentlemen
-
hell yes we care! we'll see you around, Good trading
-
Nice journal, good work, feel like I'm reading DbPhoenix, look forward to reading more Thanks
-
twice? I have to log in every time I want to view a chart (attachement) specifically Tupapa's log. This only happens in this thread? Thanks in advance
-
I'll reading along to Nik, thanks
-
Price has a HH on the 15 min. As long as price stays above the LSL I would remain bullish. Some targets 2786,2778-2781,2770 MP,2761.
Since several instruments are being tracked, don't forget to mention what it is that you're referring to, in this case the NQ.
Note: I started this thread six years ago because so many of us were so tired of the "Here's a trade I took this morning" nonsense that permeated TL at the time. While studying hindsight charts, particularly one's own, in order to improve one's trading is always a good thing, money is made, or lost, through trading, and one must learn how to plan his trades in advance, with foresight, in order to extract the greatest profit, as opposed to just groping one's way through the day and doing what feels good.
That's what this thread was about. And I am impressed that the process is now so ingrained that the traders who post here do it without thinking about it much. And the influence of this has permeated TL to some extent (at least one doesn't see so much of the "Look at all the money I made yesterday" business).
But because it has become so ingrained, there is little to distinguish this thread from the AMT thread. So I'm closing this one in order to consolidate a bit more and make it easier for people to follow the course of events, particularly if a particular series of charts is better understood in sequence.
From this point forward, then, members should post whatever might otherwise have posted here to the AMT thread. If nothing else, this will help members stay on the same page.
Db
20130305074950.png.db04fe0b3796a60bdb8a42887d341059.png)
-
Nick Quote "[so the data is free, it’s when we start actually trading (I know, a long way off) is when we have to get ourselves a broker and/or a live data feed where it would connect to NT or the likes, but in the meantime we can use this for monitoring and paper trading?]"
oec used to give free real time simulation and market replay if you fund an account,welcome and good luck
-
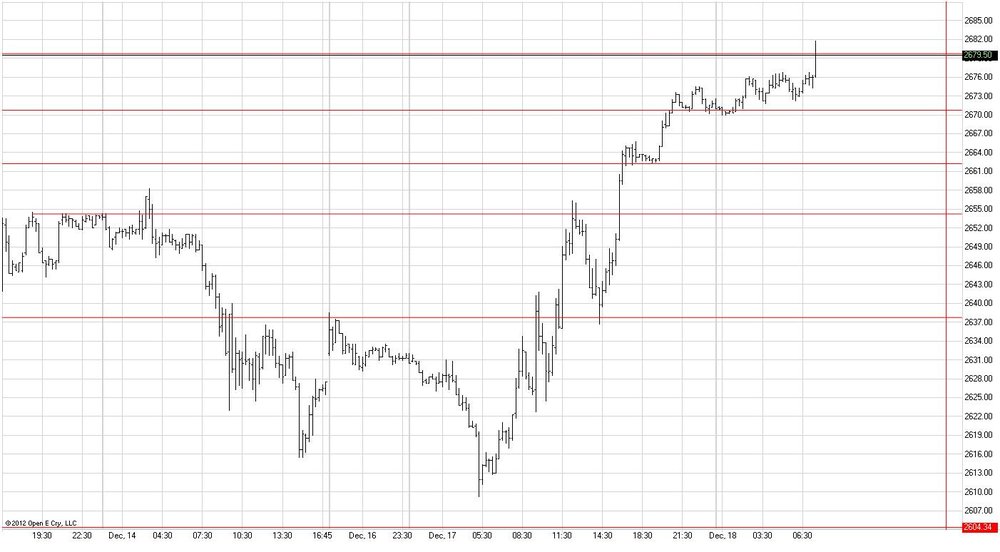
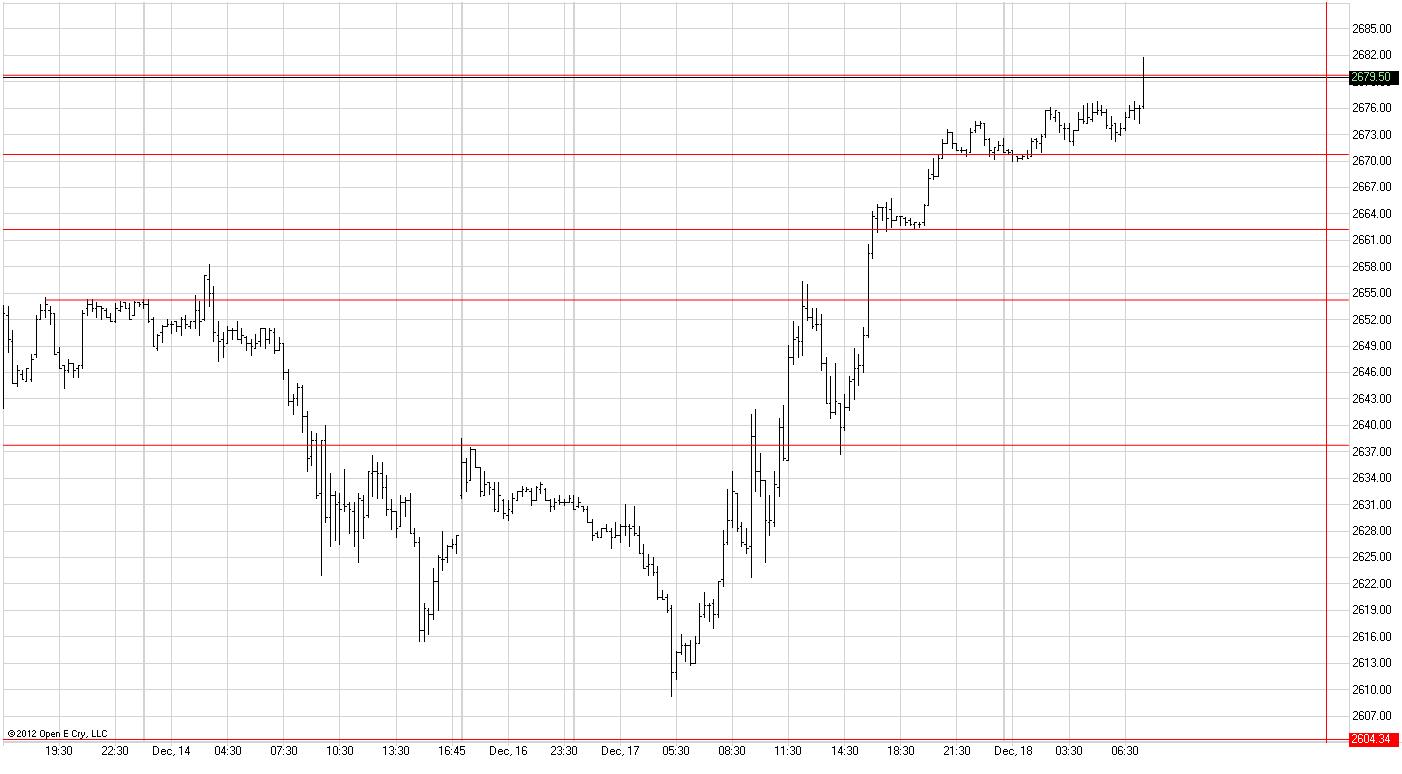
As I post this it appears price is moving towards 2690. There is some R at 79-80 an MP but if cleared I would be a buyer. above 90 my targets are more spread out 2726,2770. Below 2679 I have support at 2670,2660,2654 and 2638.
-
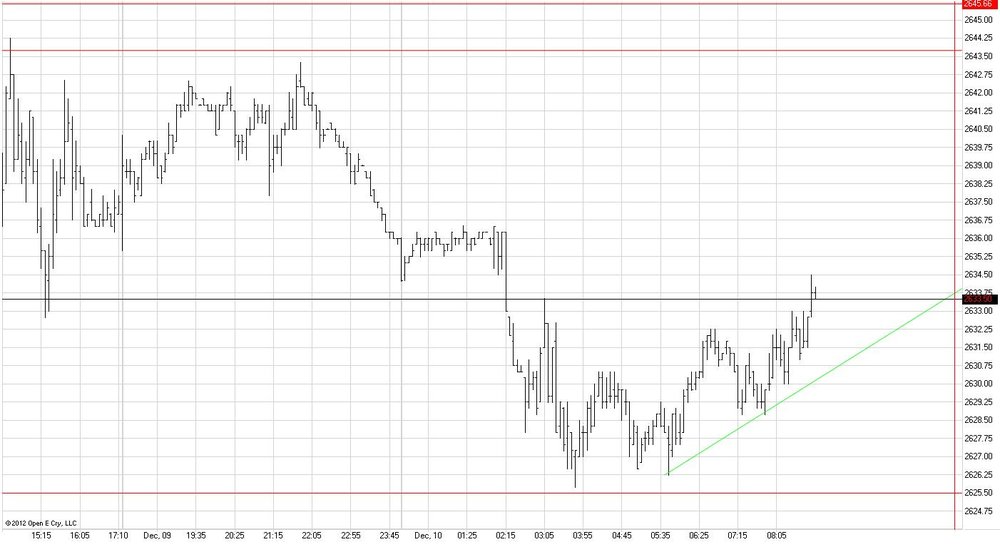
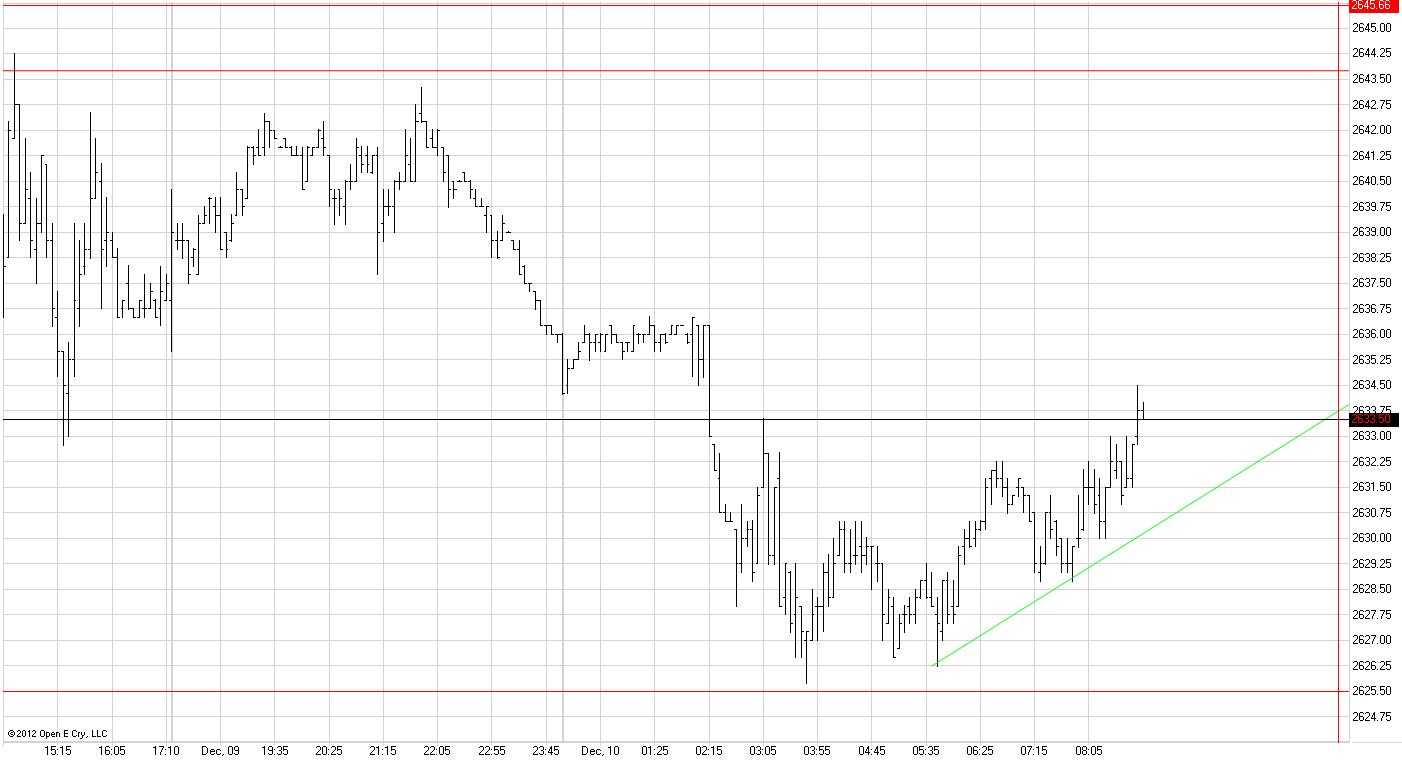
5 min chart price appears to have found S at 2625 and is making HH's and HL's.my levels to watch are 2625 and 2607 to the downside and 2643,2654 and 2678 if we continue up. The NQ is in a precaious position. A break of 2625 could mean a contination of the downtrend on the daily chart.
Trading the SLA/AMT Intraday
in The Wyckoff Forum
Posted
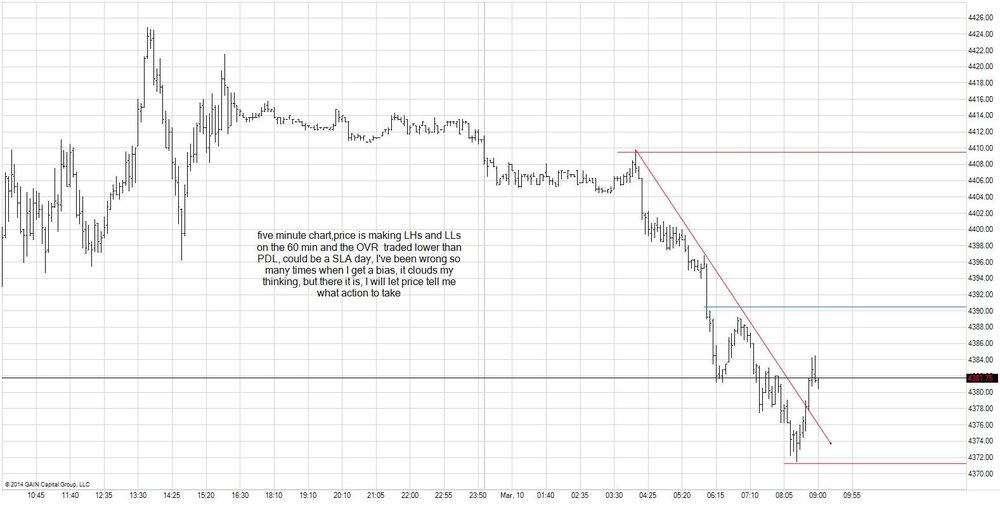
I see LLs and LHs on the 4 hr chart RET is there, the 60 min has a TR that is to small for me to trade I will wait for a BO followed by a RET
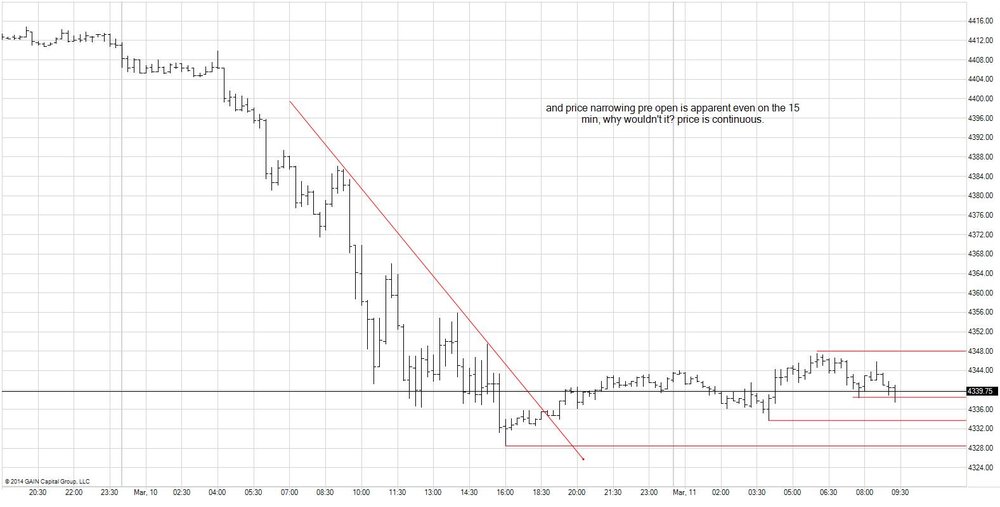
P.S. I see price dropped out of the TR as I was typing this lets see if 4.25 holds