
Welcome to the new Traders Laboratory! Please bear with us as we finish the migration over the next few days. If you find any issues, want to leave feedback, get in touch with us, or offer suggestions please post to the Support forum here.


SIMPLETRADES
-
Content Count
16 -
Joined
-
Last visited
Posts posted by SIMPLETRADES
-
-
Hi SimpleTrades,the charts above show data from mainly 9th June and 10 June based on the old June contract.
Because I don't update this file anymore, I can go back and play with it as I like now.
As explained in post #8 the gray vertical lines are placed at midnight New York time.
But to make it easier, here is, what I currently look at:
These charts show 12/8/4 "range" bars. (Not real range bars, as I said earlier.)
On the 12 range you should see a dark vertical line. This line marks
the begin of Sundays session this week. The gray vertical lines at midnight NY time, so that I don't get lost totally.
So on the 8 and 4 range the full day shown between the lines is Wednesday (Yesterday).
I think, that these charts also show, that it might be very dangerous (I know it for myself), to just follow blue/red toggles based on a quick 4 range or 8 range chart without looking on the context.
The losers start to rule then, because you have to cut the winners, to recover from your many small losses.
So we need filters, if we like to use these toggles.
And this should lead to the next step.
Feel free to post one of your charts here too!
Hal
my fault, sorry, i didnt look at page 1 of the posts. i know nothing about range bars besides the fact tradestation offers them. i'll look into them, but why not just use a tick chart with a very small setting?
-
In the UK where they originated (or where they were adopted early at least) they seem to be largely superseded by spread betting which has tax benefits over CFD'sleveraging for trading cfd's sound in many ways like the private capital trading firms (not brokers) in the US that offer 10x margin on small deposits.
I have a link to one if anybody cares.
-
Step 2:In an earlier post, I said that I will write more about Heiken Ashi, but this would be somehow misleading. So instead, I will write about about my color coded bars. I use these kind of bars already for quite some time, but I have modified the algorithm often, maybe trying to find the perfect picture. But there is none.
I think that this is easy to understand, because basically the color of the bars just depends on price versus a weighted, fast moving average. Well, and light colors appear, whenever the comparison with a 5 linear regression line, tells a different story (this often highlights the beginning of a pullback).
Now, looking at the chart below, it might be tradeable, if you just enter pullbacks into the direction of the dominant trend, but using these bars without a further context on quick charts, often tricked me into stupid counter-trend trades (because I hoped for more than a pullback). These trades then quickly ended up stopped. And, oh well, sometimes I have even allowed these trades a wider stop.
BTW.: I think this was my major mistake, combined with realistic (tight, sometimes too tight) stops and unrealistic targets (runner against the trend).
But what might be a good context for for these colored bars. Well, in step 1, I mentioned trend lines and s/r lines. Again I haven't drawn any lines, but where do the important color changes start?
They start when trendlines have been broken!
So if the context is given by these lines, the question comes up, if finally these colored bars are needed? For now I will keep them on my charts, but maybe at some point in time, I will not need
them anymore.
Its much more about patterns like HH, HL, LL, LH, as I see it now, but as I am used to use these colored bars, they can help me now to visualize these patterns (and their strength).
i'm curious how your paintbars compare to some of mine. what day was the screenshot and what time zone? thanks
-
Hi Guys,When i made my comment about the TransAct feed it was out if disappointment because I was very comfortable with the feed, and did not have to go out and pay extra for it.
What I am going to do is switch over to Interactive Brokers that's all, their feed will be just fine with Multi Charts.
I have been using MC for a year, and before that Sierra charts for about four years with TransAct feed, and can say I never had problems with either of them. I went to MC because of some easylanguage indicators I had otherwise
I would of never left Sierra.
Actually, I just might get Sierra (because I miss their charts) on my other computer with TransAct feed, and IB on my other so I can have two feeds.
Cheers,
email
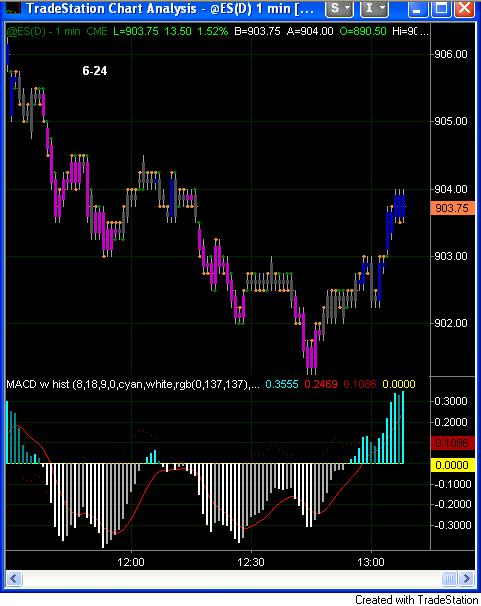
email, do you know anyone who can redo my ts /mc easy lang coded indicators to sierra format? here's a screenshot of my paintbars and macd. i removed everything else to simplify, but the paintbars go very well with boll band double bottoms/triple tops and midline breaks.
-
I use 10x overnight margin for daytrade. LOLthat doesnt make sense--if the overnite cme requirement is 5000 or whatever thats going in the wrong direction.
that sounds more like a securities trade than the futures.
-
Have you looked at Investor R/T Investor/RT: The Trader's Ultimate Toolbox only $40/monththanks but i'll probably try oec demo with multicharts for a month or so which hopefully will be long enough to get my tradestation/multichart indicators i wrote myself coded for sierra by someone. then i'll just be paying 26/mo for sierra charting.
-
Mirus ES margin is $500youre right. atcbrokers was 843. and mirus fesx might be 1100 if i got them confused--but whether its 1100 or 1575 or 2100 for fesx, infinity at 500 blows them away.
-
Mind you 6.30 is kinda expensive (if that is one of your main criteria)its $4 plus 2.30 exchange fees. Mirus I thought was 4.40 plus fees but the ES margin was 843 and the FESX was either 1575 or 2100 vs 500 each with Infinity.
-
Margin and commission at Mirus and Infinity are based on account size and number of trades executed in a month.Cant speak for Mirus--I only had a short phone call looking to find feed to replace transact with multicharts but I know Infinity doesnt discriminate against small accts. I 've always been a very small acct and pay 6.30 incl exchange fees. If you're right then it would be cheaper if my acct gets larger and they'd be beating other brokers by more.
-
Demo is live no difference.Find contracts here
OEC - Futures and Forex Electronic Trading System Margin Requirements
thanks, i may buy the demo but never trade with them. Infinity is 500 margin on both but OEC wants 843 per ES and 1575 for FESX. So does Mirus.
-
OEC demo feed for futures for $25.00 a month.is demo feed delayed? and can i get FESX as well as ES?
-
Sorry about the wait. I have been extremely busy trying to get parts of my software completed. This afternoon I went ahead and threw something together.Can you help me?
I wrote some software for tradestation that I need converted to Sierra.
One is a paintbar that colors blue, pink or gray depending on whether the 3 combined indicators all agree long, short or disagree.
Another is a MACD histogram that colors white below zero, light blue above zero and as long as each bar is as long or longer than the prior its the same but if its shorter it colors gray or darker blue.
I also have a showme that plots if my 2 EMA's cross and the slow stoch agrees.
The paintbar is a real priority. I can supply my tradestation code if it helps.
I did post on the sierra forum, but no takers yet.
-
I have been with Infinity for 2 or 3 years and like them a lot. I dont know Tom, but my first week I was trading the EC and overnite I closed a position and didnt notice that I must have double clicked and closed but then had an equal number of contracts now short until almost dawn. They broke the trade for me and never hid behind the often quoted but tired line about the risks of electronic trading. They were very nice.
-
This shouldn't suck for you. You should be happy that this data feed is no longer supported. I can't imagine making good trades on incorrect data.Go for IQ feed or trade forex

The only problem with that is is IQ charges a monthly fee, plus the feed plus there is MultiCharts pricing. It almost makes Tradestation subscription affordable at 275 for platform and ES.
If anyone has a cheap feed for futures to Multicharts let me know. I like Infinity as a broker and prefer MC to Sierra because Ive written software I like for tradestation which I converted to MC.
-
Mirus and AMP are IBs (introducing brokers) they clear through another company called an FCMs (Futures Commission Merchant). They are not "bucketing" your trades. They are actually executed on the exchange.I prefer Infinity Futures. $4 round trip plus exchange fees comes to $6.30 per contract. On the FESX its actually 6.30 Euros too.
Ask for Pat. Better margin than Mirus too
Won't Get Fooled Again
in Day Trading and Scalping
Posted
thanks, but i read up on range charts and i still cant figure them out and dont intend to keep trying. but good luck with them and i hope you are recovering.