
Welcome to the new Traders Laboratory! Please bear with us as we finish the migration over the next few days. If you find any issues, want to leave feedback, get in touch with us, or offer suggestions please post to the Support forum here.


AntaniTheBest™
-
Content Count
8 -
Joined
-
Last visited
Posts posted by AntaniTheBest™
-
-
why don't you post a diagram?Hi Tams ,
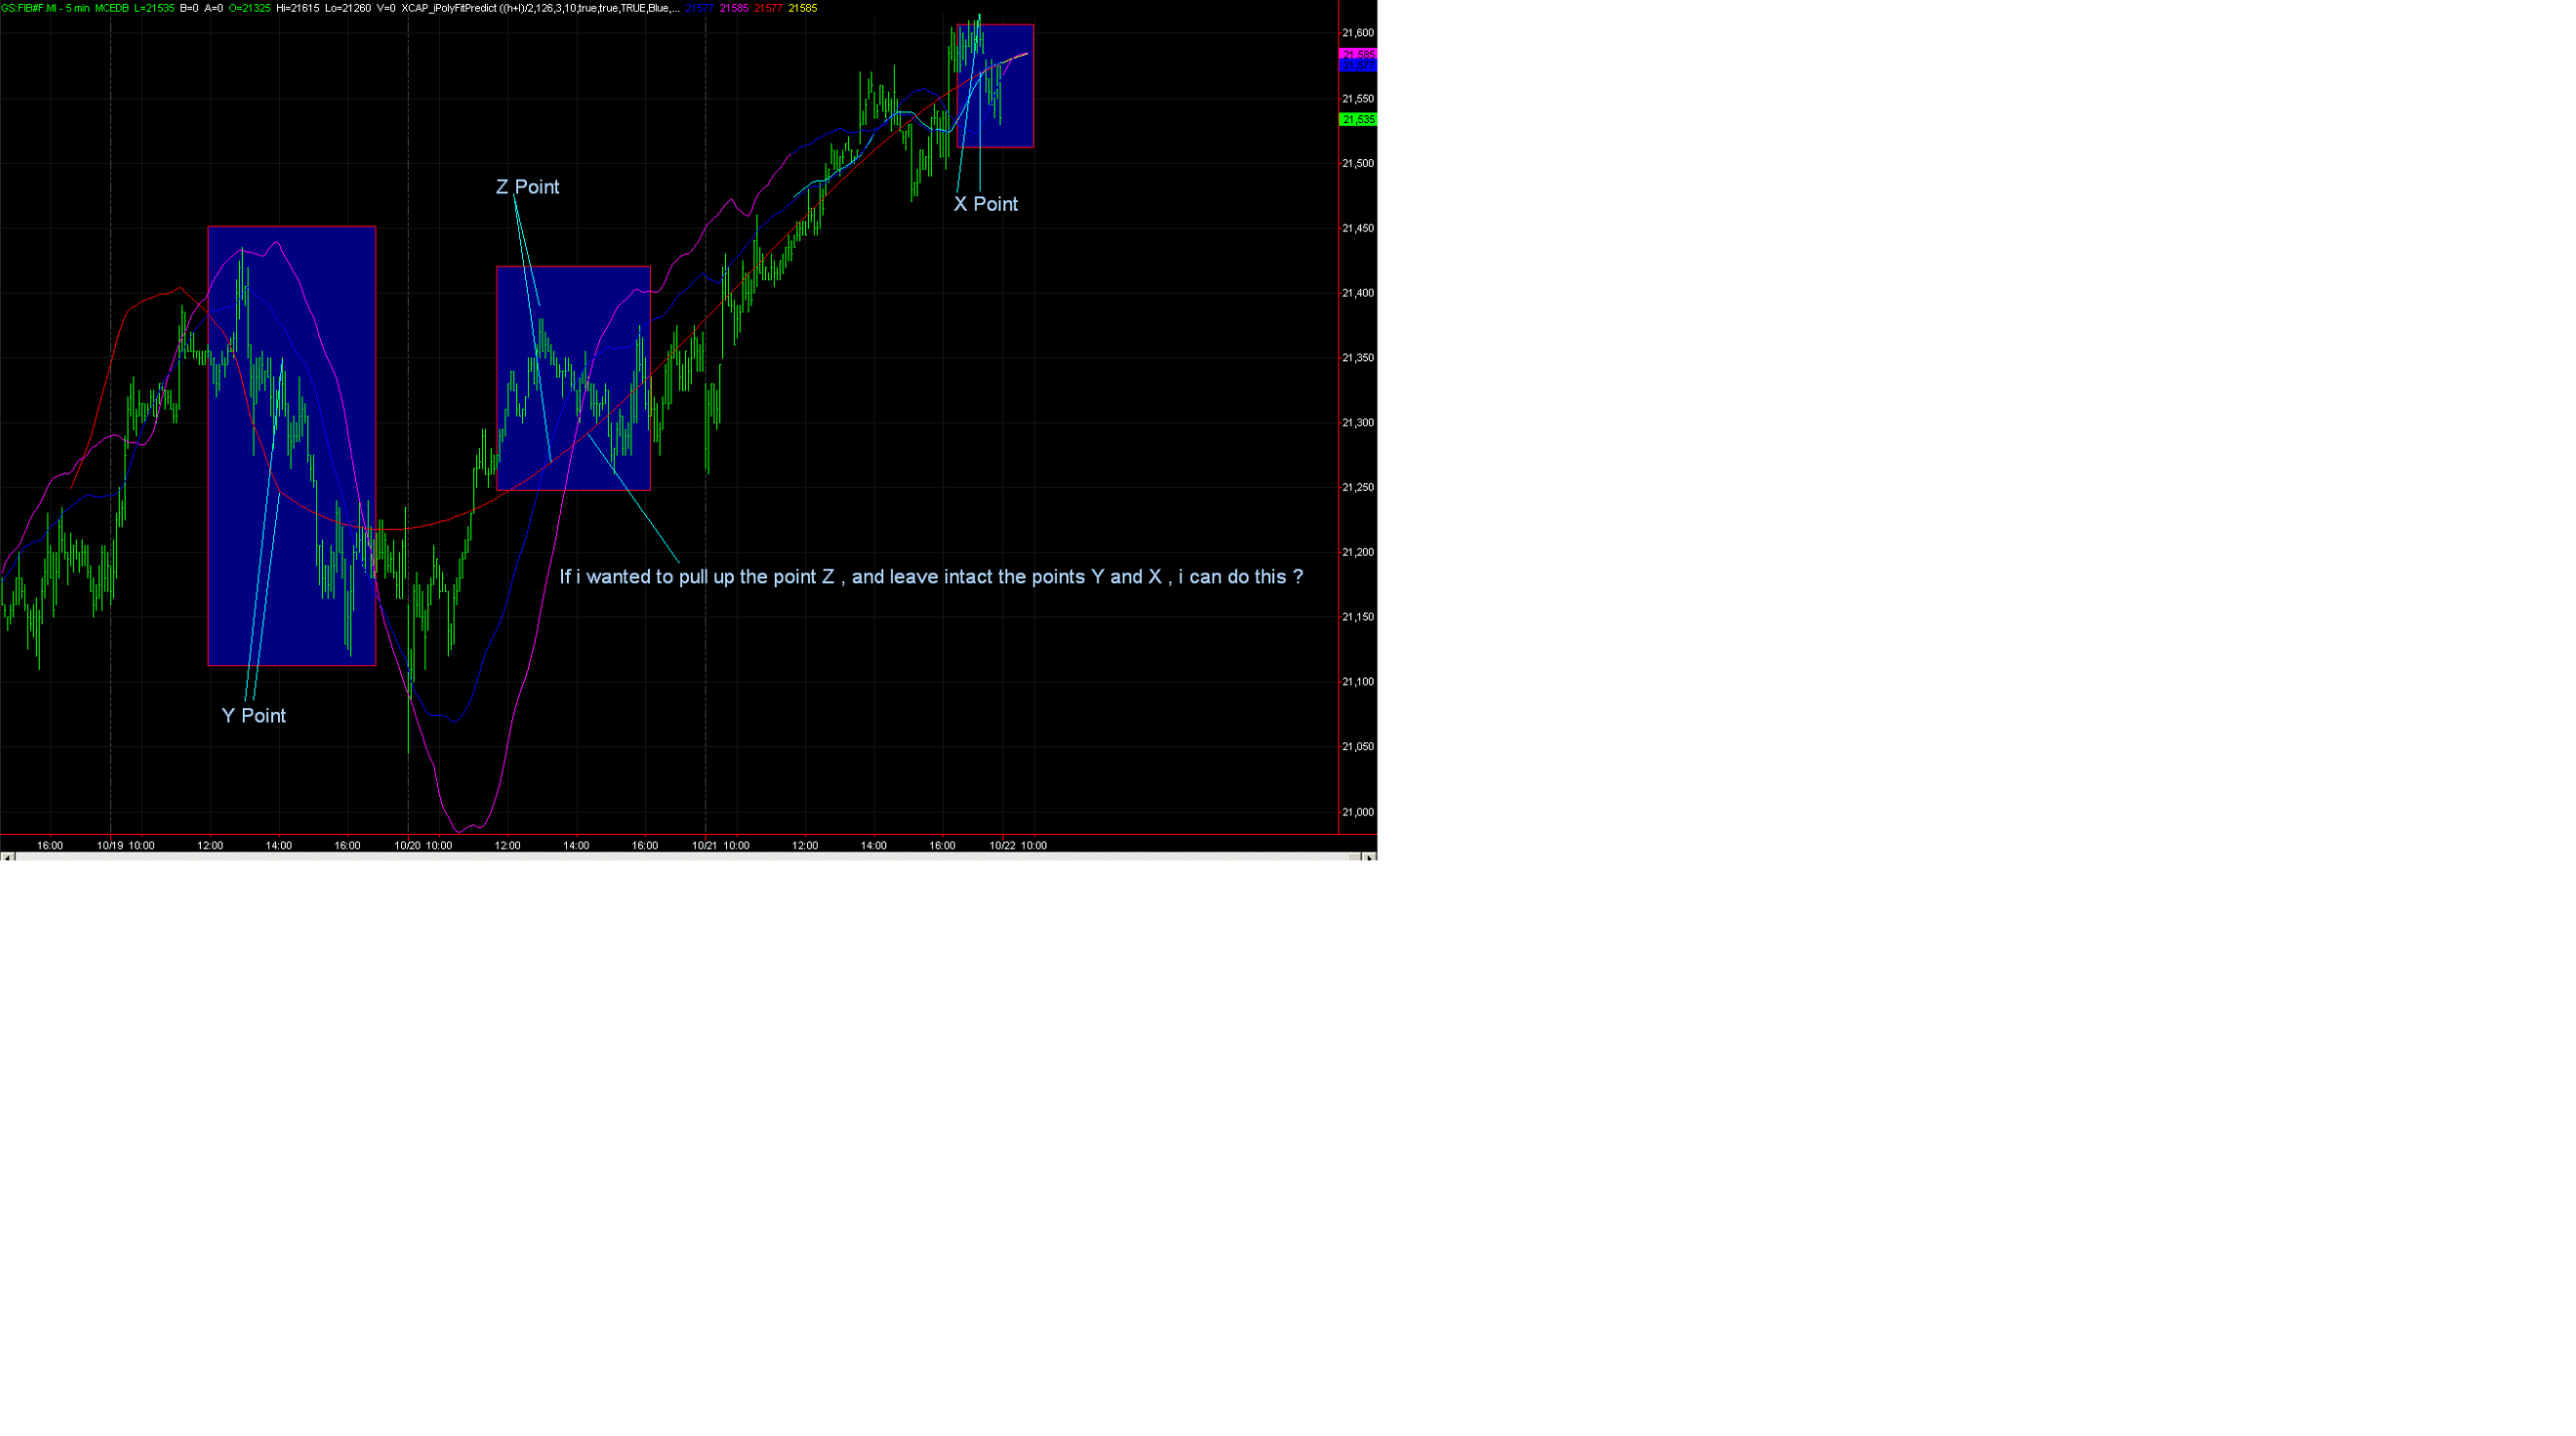
in graph attached . This is an example , with polynomial predict . But it could be any other indicator .
Tks
Roberto

-
One way would be to add an offset input and add that to the average before plotting it. If you wanted to shift it left/right too you would need to add a y offset too. Something likevar: Period(13),Xoffset(0),Yoffset(0);
....code to calculate average goes here....
plot [Yoffset](MyMovingAverage+Xoffset);
It would not be drag and drop but it would allow you to 'nudge' the average around by changing the offset parameters.
Tks BlowFish ,
But if I wanted to move the point Z? I try to explain better: Y is the beginning, X is the end: Z in the middle there. That 's what I want to move, leaving intact the Y and Z points. Something like that, it can be done? Is there a way to codify?
In addition, the drag and drop is not really possible?
Tks
Roberto
-
Hi,Not sure if I quite got what you were asking, but if you need to position a moving average around the chart you might find this indi useful.
I have made it so that you can apply horizontal and vertical shifts both positive and negative.
The chart attached shows the same indi loaded a few times with some parameters changed to show you how it can work.
Hope you find this useful.
Cheers
Brooky
Hi Brooky and tks for help.
I'm sorry, but I forgot to mention that the language on which the code was applied to EasyLanguage. :-P
Tks
Roberto
-
Hi ,
Would it be possible to move an indicator (such as moving average) in the middle of his career?
I try to explaine : a trendline drawn , if I wanted to move the move by grabbing his extreme. Here, if I wanted to move a moving average, to my knowledge, you can not because the MovAvg is anchored to the chart. I would only move the moving average and not everything that concerns the bar prices.
In addition, I would like to know if this movavg, it can not move from the extremes but in the middle or in a spot chosen by me.
Tks for help
Roberto
-
Hi EasyTrader_I ,
tks for help but doesnt work like in Metastock . :-(
Maybe i havent the right code.
Hi
Roberto
-
Hi ,
there's someone that can *translate* this formula MS in Easylanguage ?
*************************************************
D:=Input("Day",1,31,1);
M:=Input("Month",1,12,1);
Y:=Input("Year",1900,2100,2009);
H1:=Input("Shift",-100,100,1);
WA2:=Input("N Cycle",0,10,3);
{TR:=Input("Trend",-1,4,1);}
wavelength:=Input("LenghtCycle",1,9999,16);
{bars}
start:=Cum((DayOfMonth()>=D AND Month()=M AND Year()=Y) OR (Month()>M AND Year()=Y) OR Year()>Y)=1;
start:=LastValue(ValueWhen(1,start,Cum(1 )));
{x axis values}
x:=360/wavelength * (Cum(1)-start);
{sine waves}
phase:=-90;
w1:=Sin(8*x+phase);
w2:=2*Sin(4*x+phase);
w3:=wa2*Sin(2*x+phase);
w4:=4*Sin(x+phase);
**************************************
Tks ;-)
Roberto
-
Hi nasdaq5048,An array is required to store the TPO count at each price.
The definition of a tail is [snip...] Hope this helps.
Hi , it is possible to *translate* .eld code in .ela/els ?
Tks in advance
Antani
Repositioning an Indicator
in Coding Forum
Posted · Edited by AntaniTheBest™
//
Ok . Tks .:-(
i'll try to modified formula and variables. ;-)
Roberto