
Welcome to the new Traders Laboratory! Please bear with us as we finish the migration over the next few days. If you find any issues, want to leave feedback, get in touch with us, or offer suggestions please post to the Support forum here.


20814md
-
Content Count
23 -
Joined
-
Last visited
Posts posted by 20814md
-
-
Tupapa: the explanation for the high volume on Friday Sept 21 was due to Triple Witching.
-
He obviously meant a short here...Yep Db was wrong, you are right, he is human after all...

yes he is human, and a far more intelligent one than I.
-
The long refers to the long taken at the test of S, i.e., "if you were long here". Taking a long at R would be, well, not good.Db
Of course, and we are definitely on the same page regarding this and your previous post back to me. - Most basic concepts.
However I still feel there was something unclear in your post #171 and I now see that the typo was in the same second to last sentence I previously referenced. But it was "07" and I think you meant "17" as the exit.
Enough of this though. I am not trying to prove right or wrong, just clarification.
thanks
Edit -additionally the reference to 11:00 and 07 exit was another factor in my confusion in interpreting of your post. One would exit a long at 17 and ~10:25. The 11:00 and 07 would be for a short.
-
No, the drill is to go long off a successful test of S. This doesn't go far, but it goes far enough. One can then go short when the move runs out of steam. A short at S would be stopped out almost immediately.Db
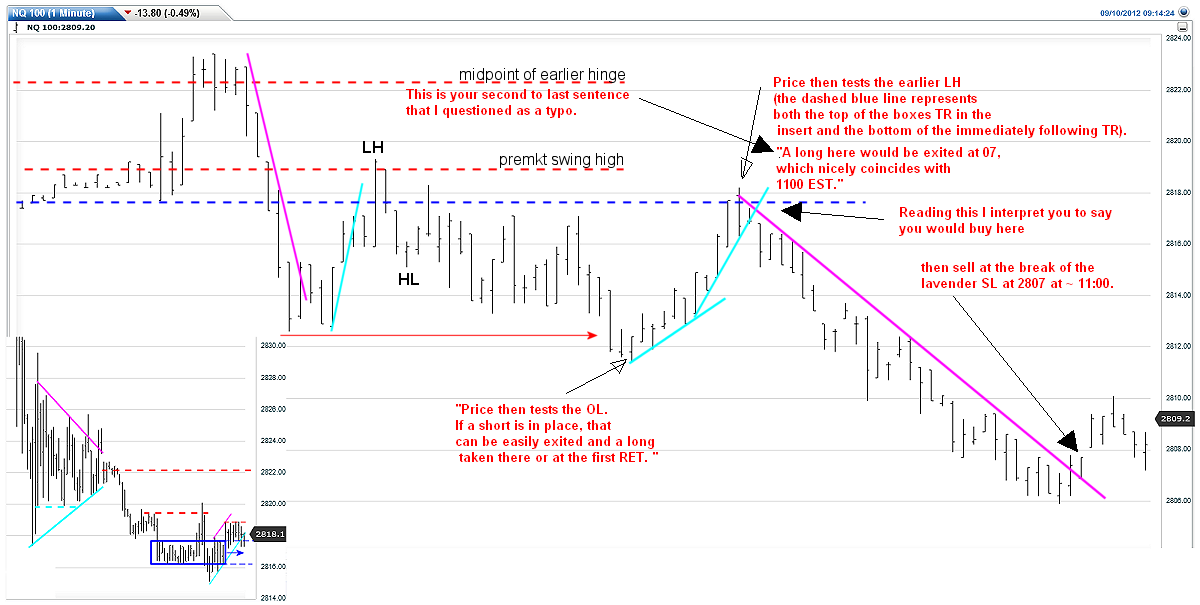
sorry Db, but somehow we aren't on the same page. Please see my annotation applying your quotes to your chart.
-
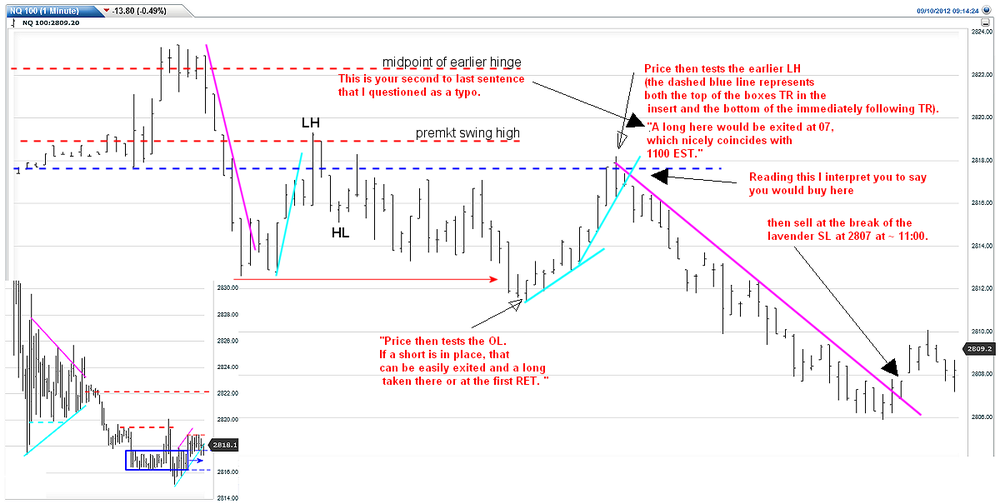
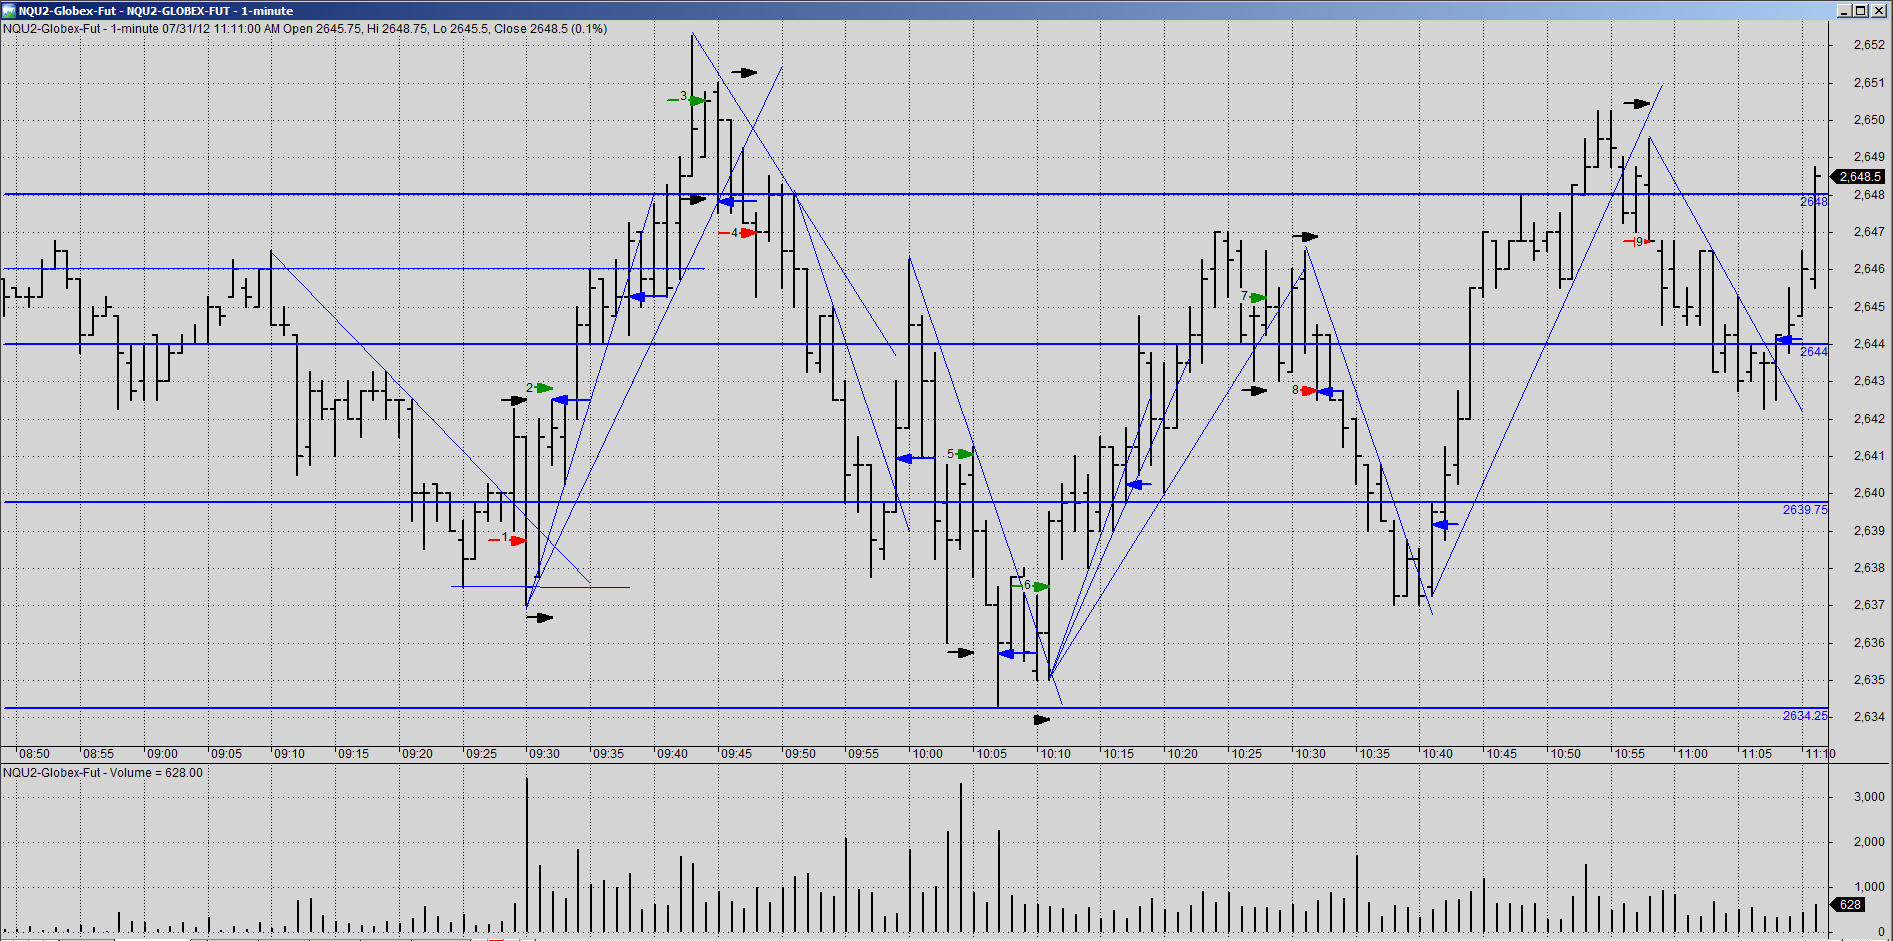
The inset in the lower-left of this chart is a copy of the chart I posted to the TIF thread before the open.This all plays out just as one might expect. Price tests the midpoint of the hinge at 22, no buyers can be found, so price drops all the way through both premkt TRs to 13 (there is no particular S here; in fact, one can anticipate price falling all the way back to 2786). It finds S there, then rallies to make a LH. When it then makes a subsequent HL, this is an indication that a TR is in the offing, and that is what price does for the next 18m (note, however, that one could make a number of both long and short trades if he were to trade without bias and he'd lose little or nothing; in fact, he might pick up a point or two).
Price then tests the OL. If a short is in place, that can be easily exited and a long taken there or at the first RET. Price then tests the earlier LH (the dashed blue line represents both the top of the boxes TR in the insert and the bottom of the immediately following TR). A long here would be exited at 07, which nicely coincides with 1100 EST.
Thus the range on the NQ was 17pts. The range on the ES was 5.
Db
thanks DB. I think you have a typo in the second to last sentence: "long here" should be "short here".
-
Gringo: you said above :
" 6) Get the win/loss and profit/loss calculation done properly. The trading platform for replay doesn't calculate profit loss stuff. Either I'll have to find a way to convert the buys and sells into excel or something but it will require some intervention."
Sierra Chart will track this on playbacks, but if you want to store your trade data from these you may need to copy it into excel before you repeat. I haven't used Sierra for quite a while so I am a little fuzzy and may be confusing this need to store externally between replays with actual back tests
Also, if you use Interactive Brokers (either practice or regular accounts), and want a way to track in RT (sim or otherwise) take a look at Bracket Trader if you haven't already. It does a nice job with the tracking trades and keeping stats including MFE and MAE. It saves data into files of varying detail for Excel.
-
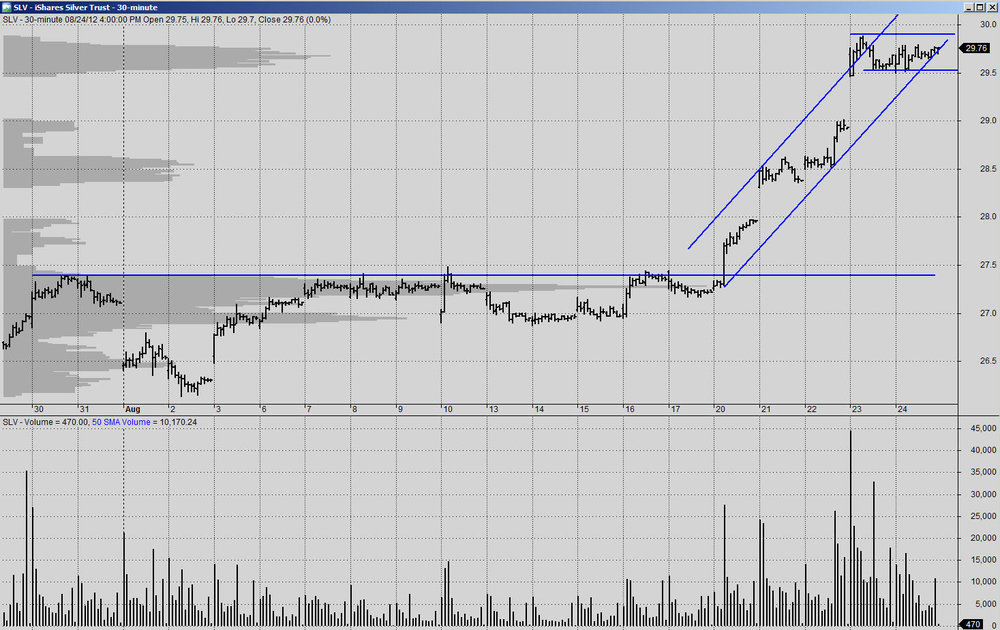
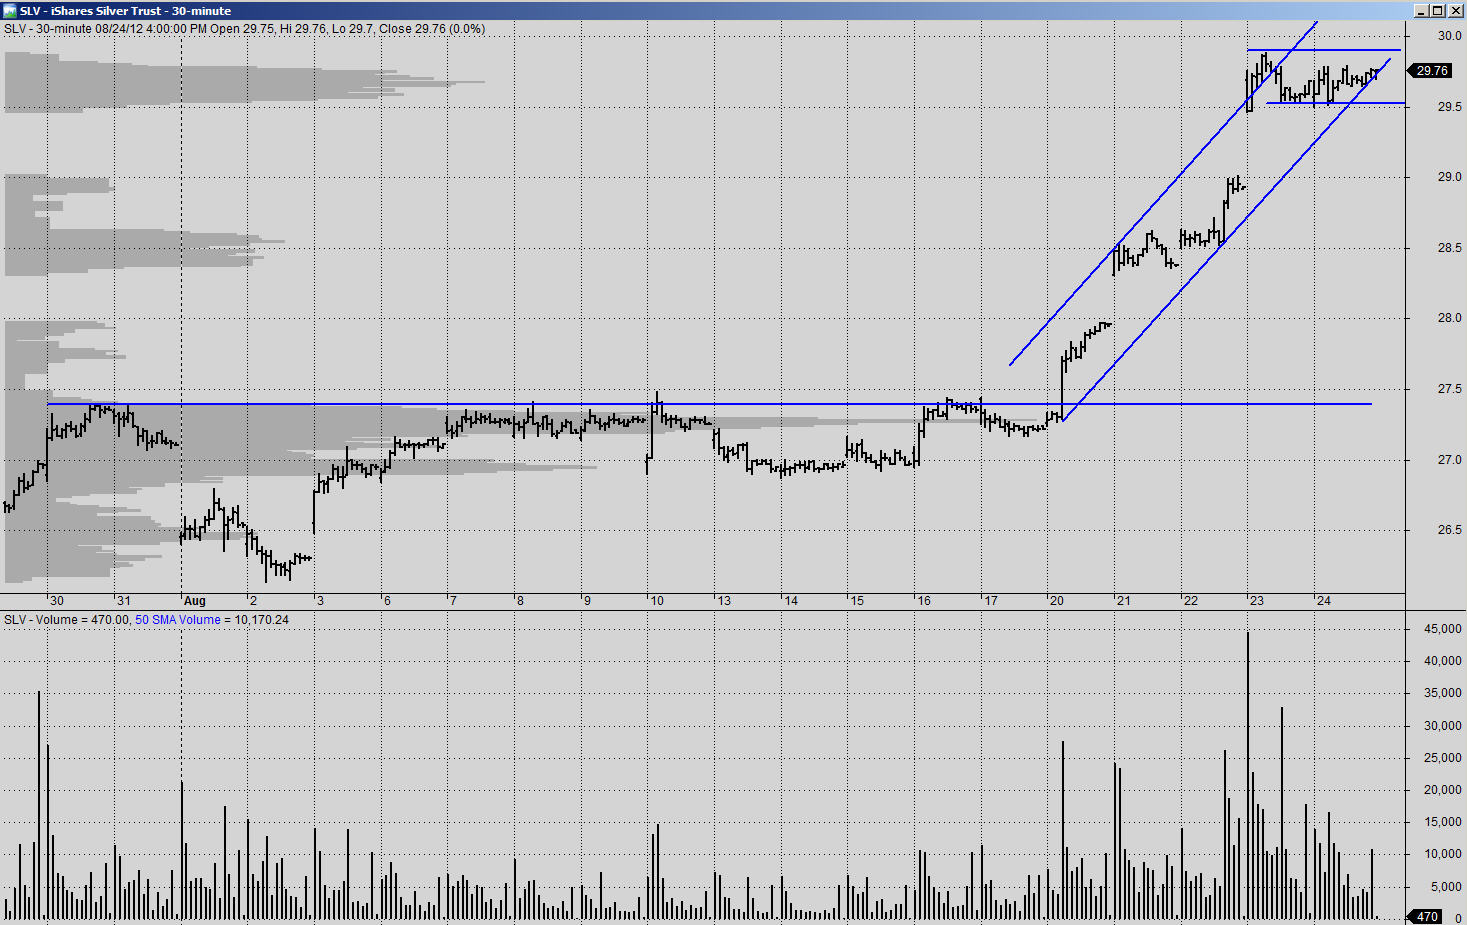
Since you referenced a 30 minute silver chart as one of the three you originally posted, I pulled up a 30 minute chart of SLV showing most of it's basing, breakout, and run-up.
Note that last Thursday's (8/23/12) open gapped up on the greatest volume on the chart and entered an overbought position relative to the trend channel (if you believe in using these interday on intraday intervals).
The opening bar volume is 1.6 x greater than the breakout volume on the 20th as price approached R and straddled the 200 day MA (not shown and non-Wyckoff, but just to note what most everyone else is seeing on their daily charts). The daily volume was ~26,000,000 shs with a 50 day average of ~9,800,000 shs.
This will be interesting to follow.
-
Thanks v20814md, seems like the best option to way for the pullback and see how price reacts to 29s and 28s, if it gets there...Not sure what instrument I'll be using, any idea on whats the option for long term Silver/Gold trading??
Thanks again mate
I assume your use of option is not intended to mean "option contract" and I'm no expert on ETF's, but iShares SLV comes to mind.
for silver ETF instruments see: Definitive List Of Silver ETFs | ETF Database
of course there are also futures contracts.
-
tupapa:
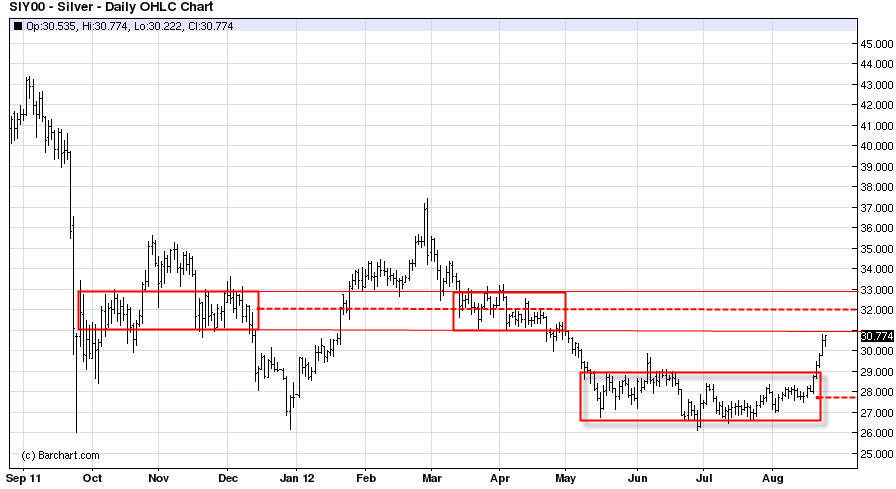
If you are looking for a $35 - $36 target I would be focusing on the daily chart. I don't know which instrument you would be trading, but for reference I attached the Silver cash index chart.
Price appears to be hesitating at R right now while in an overbought condition. This situation is ripe for a pullback. So perhaps a constructive pullback to a lower risk position will present itself on the daily chart for you to take advantage of.
-
Db Quote" Originally Posted by 20814md »
------ The 10:00 AM bar showed bullish action off the test of the 9:48 low and I bought its break on the next bar. Stopped out on next bar. -------
How "bullish action"?
As shown on my chart, the 10:00 bar pushed down 3 ticks below the 9:48 swing low and ~ 1 tick below the S level of 2640.25. Not finding sellers price respected the S level and bounced back to test the R shown as 2644 pushing through by one tick. As it pulled back I set a buy stop 1 tick higher yet such that if there was another higher push through R I would be long and the R was presumably rejected.
This premise was wrong and the 2640 level below needed more testing further developing a trading range.
-
What does a 30s or 15s chart look like at that point?Db
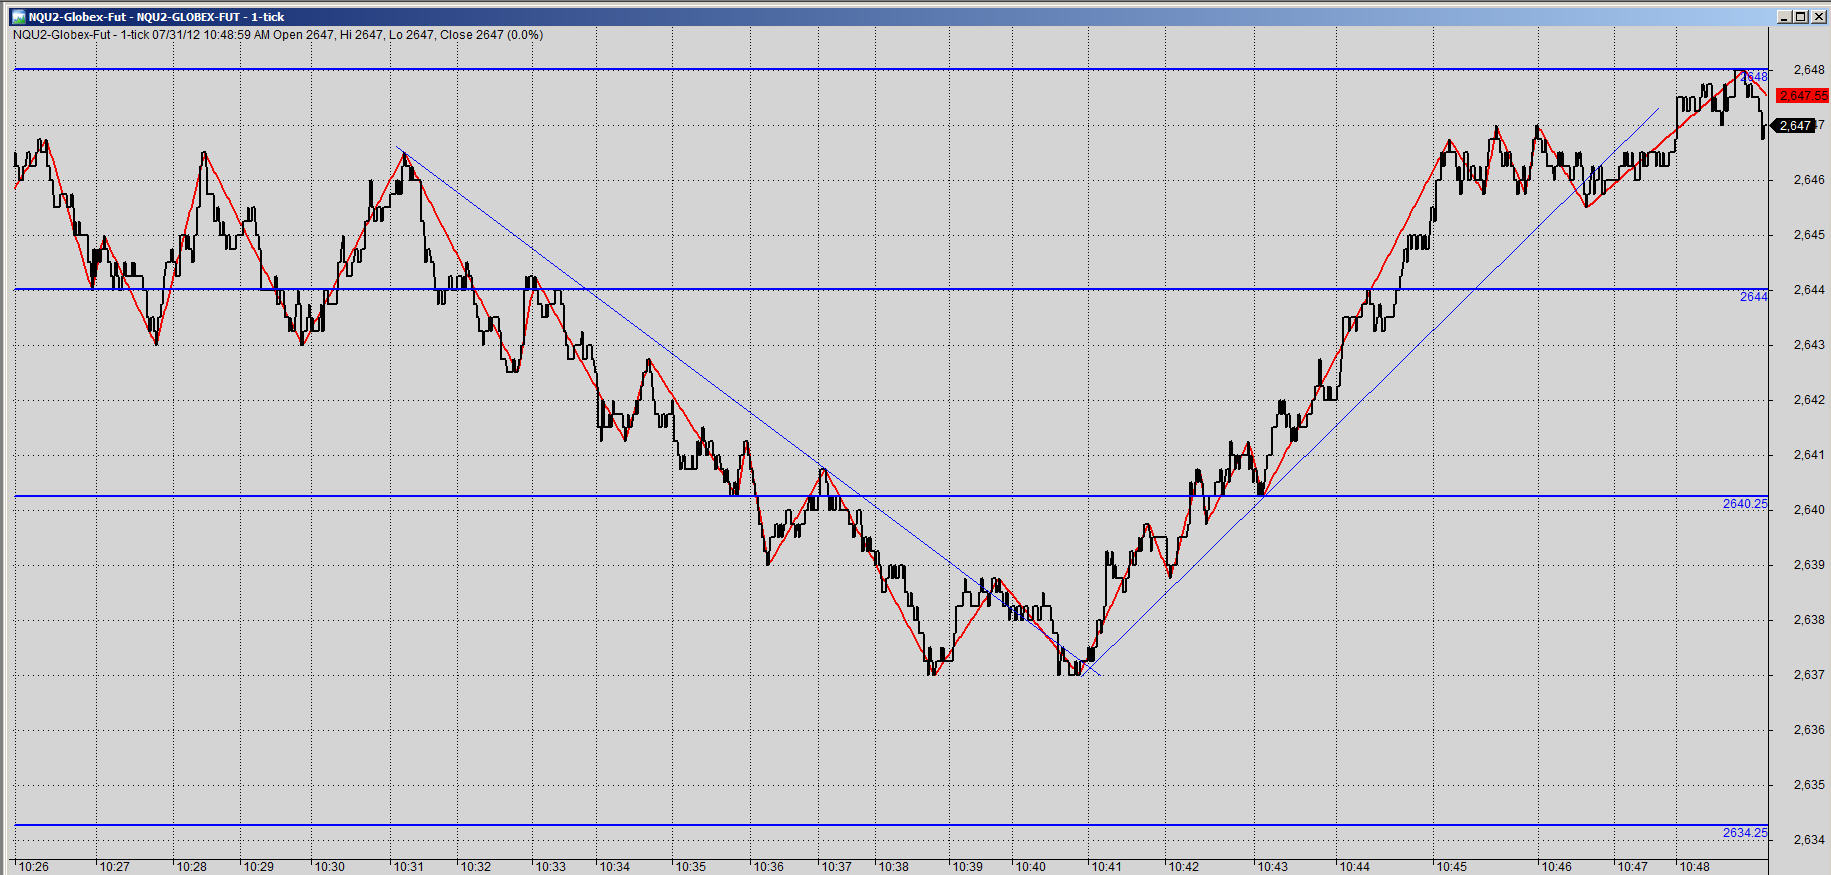
Good point. Going even deeper, the attached tick line chart (with zig-zag indicator to highlight the waves) shows a good opportunity on the 10:41 and 10:42 bar.

-
Quote from Db:
"I see now what you were doing on your first trade. I don't know that I would have taken it, given all the preceding clutter, but it appears to me to be legit. My only note here on this first upswing is not to be so tight on your demand line. If you haven't created and tested a plan around this, I can understand why you'd be fearful. But it is sim, after all, and since the bar that breaks the DL does not drop below the bars two and three bars back, there's no reason to panic. And by giving it a little room, you avoid the stopout and having to re-enter later and taking a loss on that later long (3).
I assume the arrows refer to the bar you're entering on rather than the entry point itself.
I assume you know there should be no long at 5. You're still traveling down.
Too tight on the DL after 6. It's holding just fine, and even makes a higher high. That also prevents you from having to enter again at 7 and lose on the SO. You'd also avoid being late on the short (three bars).
I don't see a long on that last upswing. Is that correct? "
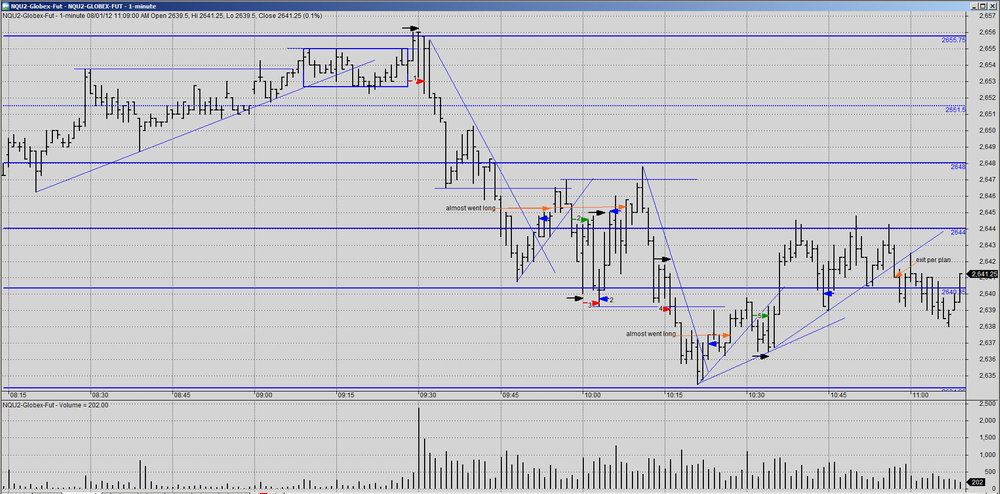
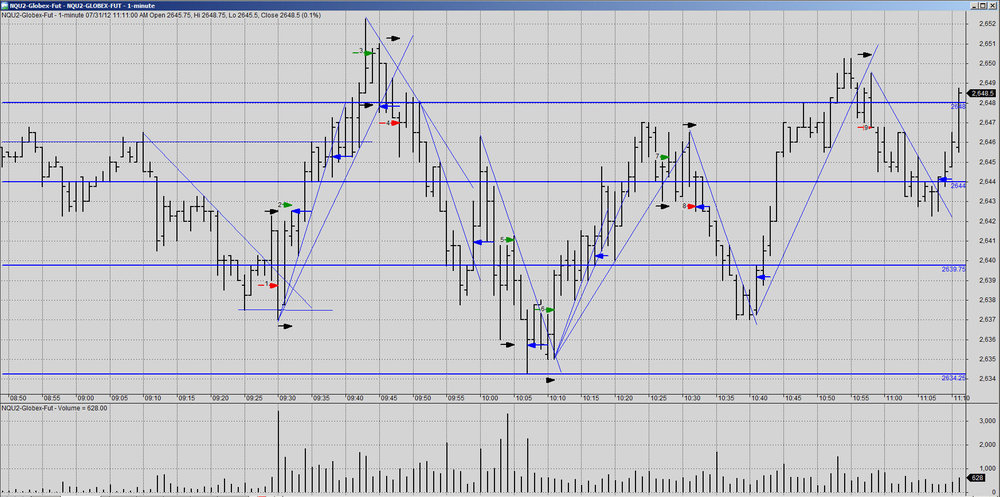
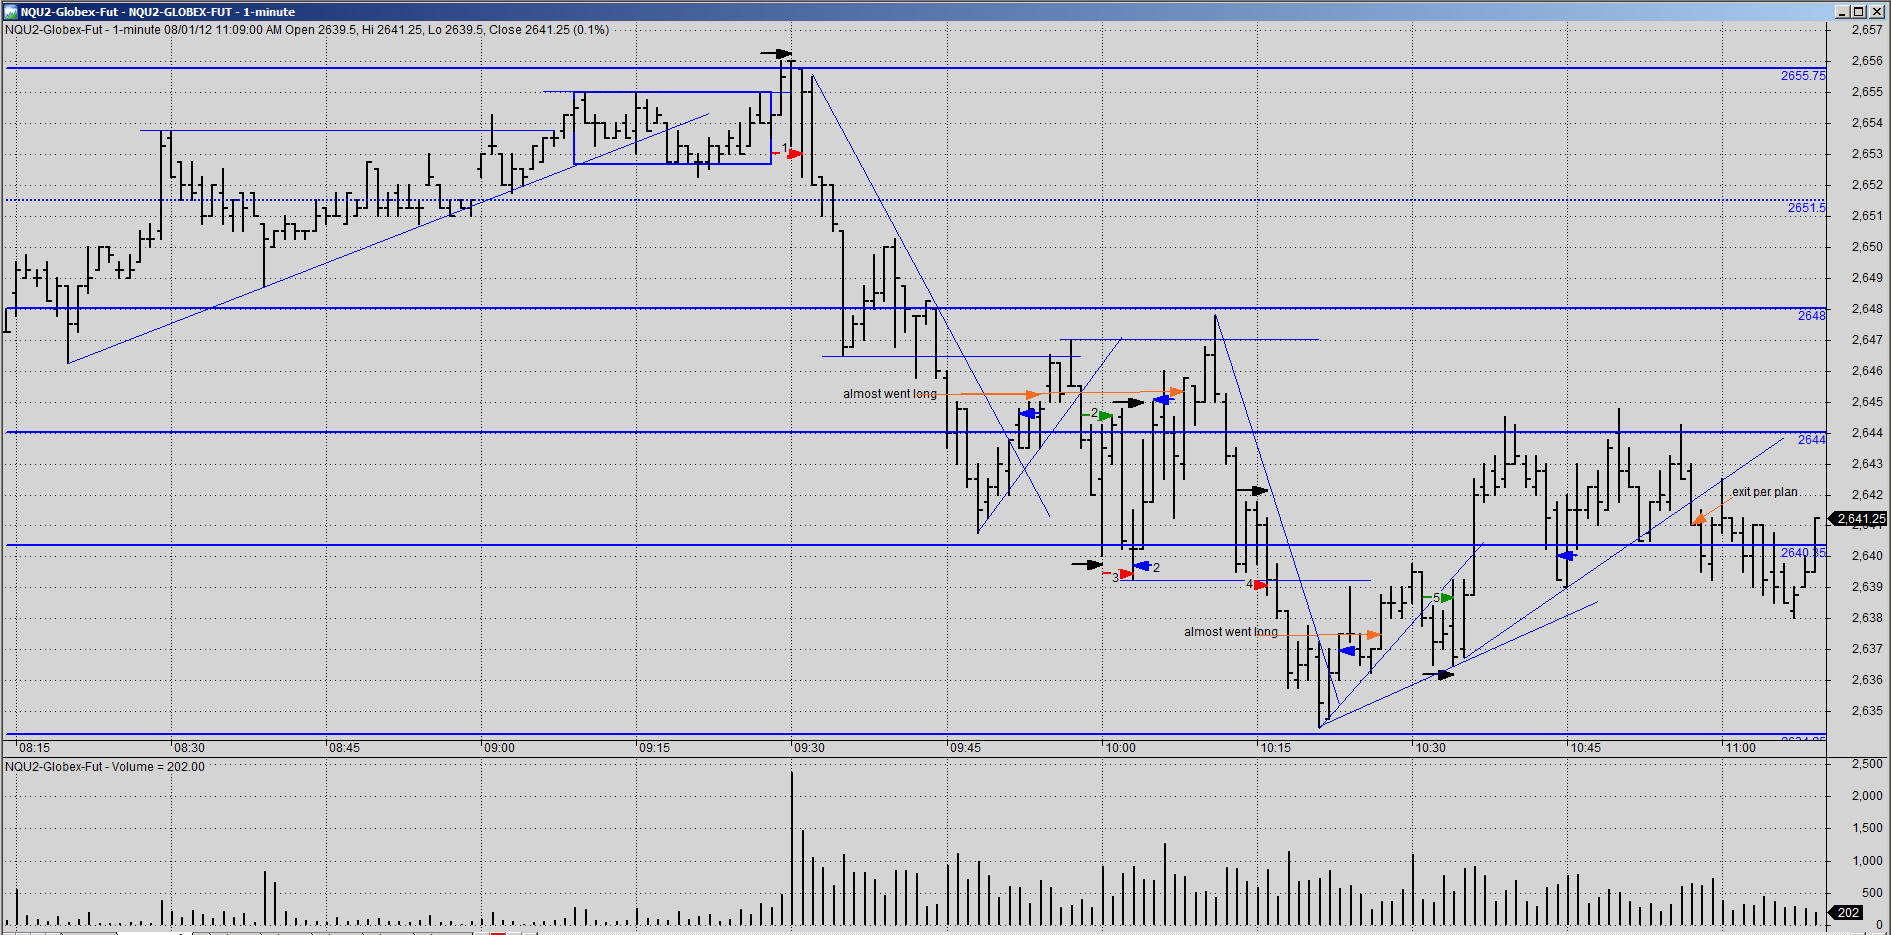
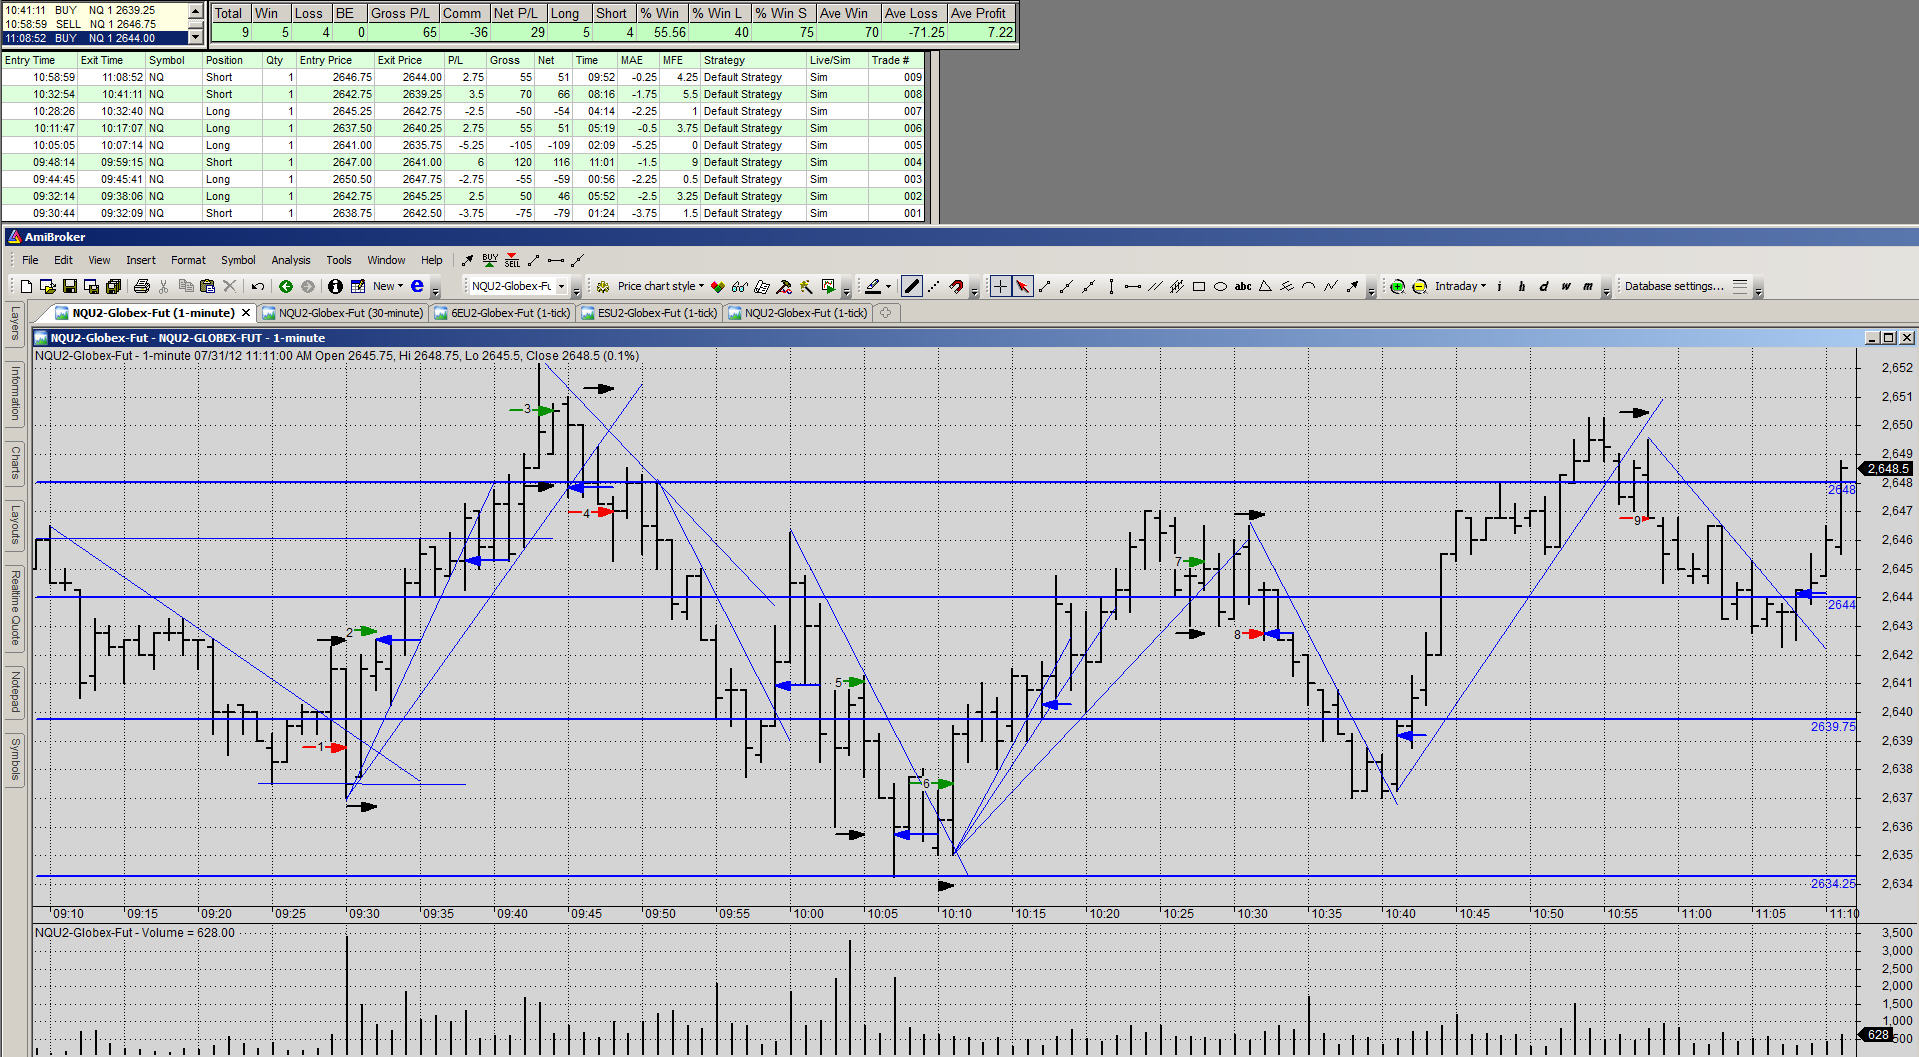
I assume you are referencing my chart for 7/31. The arrows do attempt to show the trade locations and. Green = long, red = short, blue = exit, black = stop-loss.
Arrow for trade 2 (long) is where the sim showed the fill and I put the arrow there to be consistent with the BracketTrader log.
Regarding trade 1, I was probably biased to sell short based on the downtrend immediately before the open. The 9:29 bar broke the Supply Line right at the confluence of my 2639 S/R line, but then the 9:30 bar plunged back down through both lines into my sell stop I placed there for this possibility. I assumed this event would prove rejection of S at 2639.
Trade 2, yes I definitely jumped the gun on the exit.
Trade 5 - don't know what I was thinking, yes it was still going down without any evidence of a bottom yet.
Re: last upswing you are correct. I let it get away waiting for a pull-back that didn't occur. The little double bottom with the inside bar didn't seem substantial enough to trade a reversal. I need to review and test these to see.
Thanks for your comments and help.
-
Today's effort.
1) sold short after rejection of R at 2655+/-. Was happy with the way I managed the trade.
I was then tempted to go long above the 9:54 bar at 2645.25 but then didn't think a significant enough bottom had been put in so I passed.
2) I normally wouldn't trade through 10AM numbers if potentially significant, but I did for this exercise. The 10:00 AM bar showed bullish action off the test of the 9:48 low and I bought its break on the next bar. Stopped out on next bar.
3) After 2) stopped out on the 10:03 bar I was watching the tick chart and I assumed price was rejecting 2640.25 as R on jabs up from below. I sold short to be stopped out two bars later.
4) Short on break of S.
5) Long. I exited early after R at 2644 was rejected and then the break of S at 2640 (which was below the half-way point further indicating weakness).
edit: DB's post above came in while I was working on this so I hadn't seen it yet.
Yes I was utilizing the basic approach per your examples at the start of this thread.
.
-
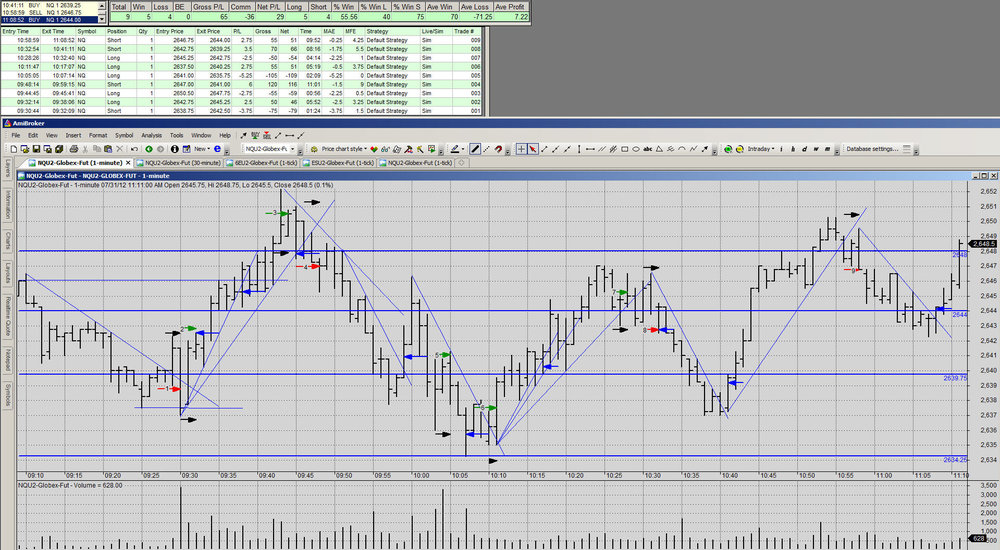
Here's my first real time (sim) shot at this from yesterday. Some good trades, yet some very bad which in hind-site have me wondering "what was I thinking"?
I need to work on patience, letting the trades better set-up, and not letting fear/greed cause exiting too early.
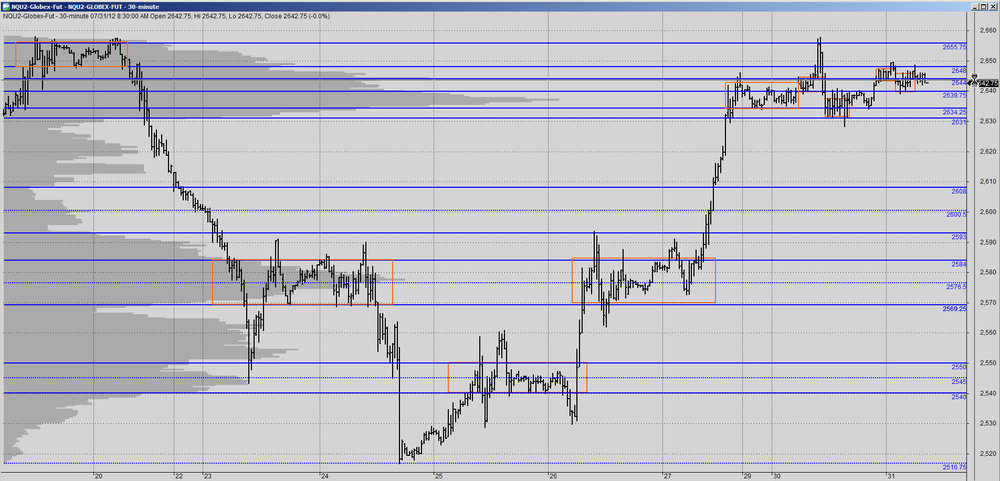
Charts included: Prep on 30 minute chart, 1 minute chart, and 1 minute chart with BracketTrader stats shown.
-
This is very good. You're picking up on the concepts well. It is not exactly as I would have done it, but not only does it work, you've provided the support for each step you took, which beats the hell out of "feelings".First, I would have placed a buystop above that first RET to the S/R line (when trading around a midpoint, avoid calling it a "support" or "resistance" line; that can bias you toward a direction; what matters is not the line but the behavior of price). This buystop would not have been triggered. But even if it had, I'd have been prepared for the SAR (this is a particular problem when trading "inside bars"; on a tick chart, the indecision at these points becomes much clearer).....
Db
Db: regarding this partial quote from post #267, I am having a hard time visualizing exactly where this buystop would be placed based on your description. Particularly if it would not have been hit.
Are you are referring to above the 14:37 bar on tupapa's chart?
Also thanks to you both for the examples and the discussion.
-
Edit: Db, the Scribd file is corrupted, do you kwow where else can this part of the course be found?It was recently posted in the Wyckoff Resources thread for download. give that a try.
-
I don't want to be directive. It's your life. But I do want to suggest alternatives. Trading EOD, for example has certain advantages, not the least of which is the ability to pyramid, if you're trending. And the sleeping issue isn't the problem it often is with stocks, though others may disagree. ........Db
Db: I'm not sure I am interpreting your thought given the context. Do you mean that trading EOD futures might have less gap risk than stocks, or vice versa?
Sorry to appear a little thick.
Thanks
-
AmiBroker can run in Linux under Wine or CrossOver
3rd party production for Amibroker-Linux/Mac
Interactive Brokers TWS runs in Linux and will provide real time data (actually .2 - .3 second snapshots) for AmiBroker. I have experimented with this in the past but don't use it regularly. Perhaps there are other data packages that will run under Wine also.
-
This guy has a lot of tweaks on his website:A lot of it is beyond me, but it might be helpful to some.
Another good one is:
-
waiting for the arrival of a used computer from compusa but it still got more power than what I have. My current one is so old 512K of memory is all it can handle.I have installed various Linux systems on my old computers and they run wonderfully. Too bad there is a lack of trading software for these OS.
 Vista crashed while I was writing this the first time LOL.
 -
Link is fixed now. Thanks for the notice Torero.James: the video link is not working again.
thanks
-
I created that file almost 10 years ago. It took some judgment and lots of time to extract the H,L,C and Volume, but I did my best. Please note that I doubled the Volume on the Saturday sessions.
I'm glad you posted it here because I was about to do it myself. Also for my own use (not in the file referenced here), I added some "price data filler" in the beginning to allow a chart window to be open full size and start the data scrolling with out messing up the scaling.

Trading The Wyckoff Way
in The Wyckoff Forum
Posted · Edited by 20814md
typo and thread reference correction
Look at the "Trading by price/Trading in 90 minutes" thread (Post #210) where DB talks about ForexPros charting as a decent free alternative. (I have never used it personally, because I own software, and it appears to have quirks regarding gaps and connectivity, however several contributors post charts with it).
Most, but not all day trading discussion is around the NQ (Nasdaq 100 futures). DB has discussed the positive attributes of this trading vehicle but I'm not sure in which thread.
Good Luck