
Welcome to the new Traders Laboratory! Please bear with us as we finish the migration over the next few days. If you find any issues, want to leave feedback, get in touch with us, or offer suggestions please post to the Support forum here.


cmach123
-
Content Count
10 -
Joined
-
Last visited
Posts posted by cmach123
-
-
There is no buy there. 1 bar back is a test. This test fails on the next bar as price trades lower on increasing volume. 5 bars back is a wide spread down bar on ultra high volume where some demand did enter. But that last bar made a lower low and closed lower than that bar.Your best options are to do nothing and wait for a successful test. Or look for a narrow range up bar on volume less than the previous two bars to get short.
To go long, the next bar should be a wide spread up-bar, with volume greater than the previous two bars??
-
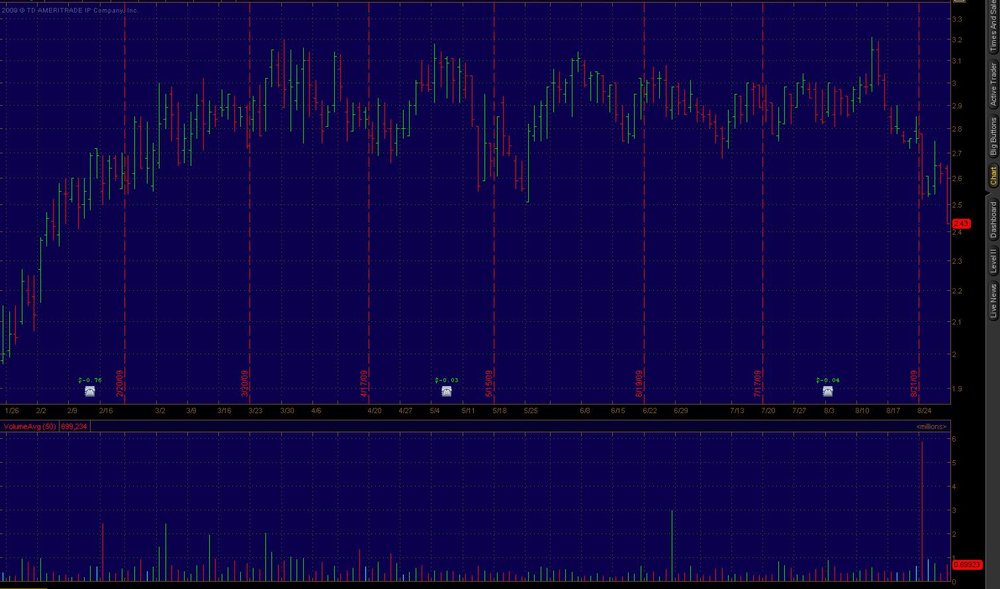
I have an example I would like to share, and I would like feed back in regards to the next day's instication of a buy. If you see in the attached files, this particular stock closed at $2.43, which is the same as the bars low.
In order for the next bar to be an indication of a buy:
1.) Does the next bar have to open below the previous bar's close; the high is higher than the previous days high, and the close has to be higher than the previous bars high and the volume has to be less than the volume on 8/28?
or
2.)Does the next bar's Low, and Open both have to below the the previous day's bar, and the high has to be lower the the previous day's high, and the close has to be higher than the previous close?
or
3.) Simply, tell me what to look out for...
-
I inserted Sevensa's VSA Indicator into Tradestation, it seem's the no supply, no deman bar are doing the opposite. If there's a no supply bar, the price should go up..but instead it decreases...
-
Thanks for the response. I appreciate a detailed answer. You made a point related to background weakness. How does someone measure this?
-
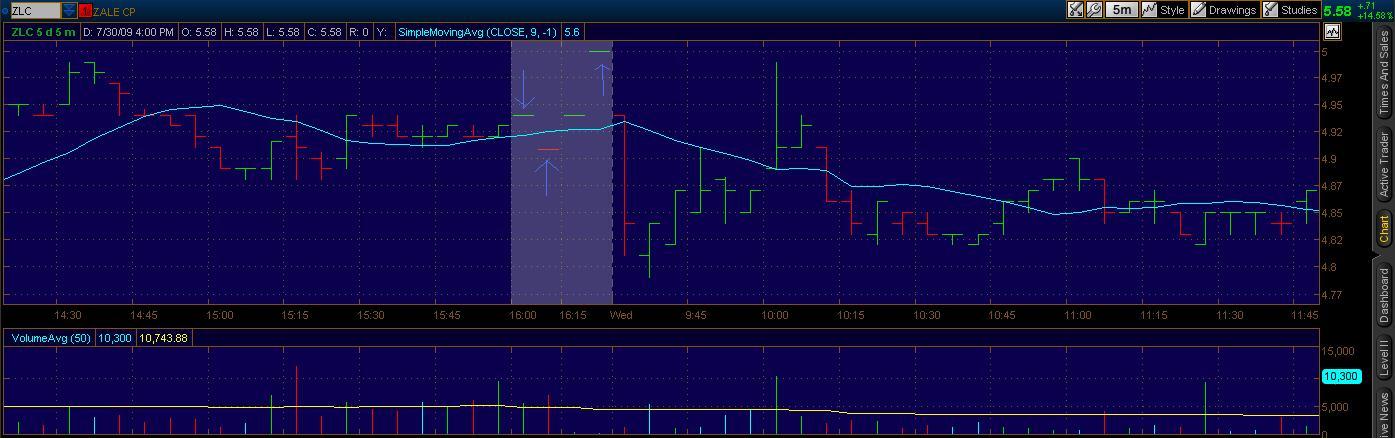
I have pretty good understanding in regards to reading a candlestick/bar chart, and what to expect. But when a horizontal line (blue arrows pointing) appears, I have no idea what to expect. Can anyone explain what this means? Is it no demand bar, or no supply bar?

-
Hello Cmach123. Happy that you like the VSA approch to the markets.About charts in VSA 1 thread, they are still there up and running. So do not really understand what you means.
I am reviewing the thread now and the charts are they ( i am on page 12 though so maybe that change later on.)
Also, if you look in all the threads on VSA, particularely the sticky ones, you should see lots of interesting posts and charts there.
As VSA in now my main focus for my trading methodology coupled with market profile and S/R levels, this forum on VSA is really great and we are very much priviledge to have great VSA traders like VolumeJedi, Eiger, PivotProfiler and CandleWhisperer before (if they are the same person should not concern anybody but and is not important at all). The quality of their posts and charts is what make me so happy studing this application of VSA
Sincerely
Shreem:)
The posts related to pivotprofiler...
-
I know this is VSA part3, but where are the charts in VSA part 1? I could benefit from these charts b/c the explainations were really clear....

Detecting Whether Stock Price Will Bounce After a Slight Decrease
in Volume Spread Analysis
Posted
Does anyone have a method for depitcing whether a stocks price will bounce after a slight decline? For example, in the attached, you'll see a green arrow pointing, after this the price declines. When the price declined, by a few cents, how can one tell if this is just a test and the price will bounce back up? As you can see, this stock crashed hard...
If you need another pic, showing the background, I gladly add it...