
Welcome to the new Traders Laboratory! Please bear with us as we finish the migration over the next few days. If you find any issues, want to leave feedback, get in touch with us, or offer suggestions please post to the Support forum here.


emmster
-
Content Count
5 -
Joined
-
Last visited
Posts posted by emmster
-
-
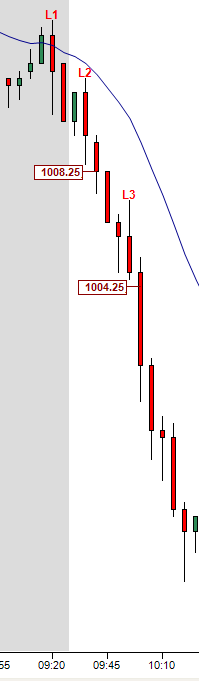
Using the methods described in the book, the first trade of the day was an L1 short at 1008.25 off the 1st bear trend bar. The next trade I saw was also an L1 short at 1004.50 off the 4th & 5th double bottom bear bars. Any trade around 1010.00 was before the first 5 minute bar of the day closed and thus was not compatible with my understanding of Al's methodology since it was too early to look at a lower time frame for setups, the market not yet having proven itself in a strong trend.Thanks for the reply. I just started reviewing some of the posts and wanted to see if I had a rudimentary understanding. The difficult thing for me is knowing where he resets his count, so I saw the 1008.5 as a L2 and the next as L3. This might become clearer to me later. Thanks for the info.
-
Can someone tell me if there was an ES short signal @~1010.00 right near the open at 9;30EST on Fri via this method? I am trying to see if I am understanding it with any accuracy. Thx.
-
Thank you for the responses Jerry and BlowFish. I can see that I must be careful in the terminology I use because I may be introducing my own mental "bias" by using the wrong wording in my head when reviewing the posts.
In ES Thurs, I see where skew and trend match, producing very nice outcomes.
The idea of a breakout against the skew is also clearer on review and Jerry's comment above to dbntina - "the distribution function is dynamic. Note the emphasis on the word dynamic. Reversion to the mean, does not necessarily occur."
(Lightbulb starting to flicker on....)
-
Thanks to jperl for his generous insights, and dbntna and BlowFish for their work on theTradeStation code to see what is being discussed on the chart (received a copy from a trader on this board).
Sorry for being dense on this, but I am a bit confused on the trade direction when viewing the Price vis-a-vis the VWAP and the PVP.
My understanding is that the skew is in the direction of the VWAP (so VWAP > PVP means skew is up).
When VWAP > PVP but current price < VWAP, is there a directional bias?
Thanks for the threads and any clarification.

Futures I Trade Show & Brooks Book
in The Candlestick Corner
Posted
Sorry, but I thought the requirement for the L2 was a high that is higher than the previous bar. (?) The low of the L2 bar-1 tick is 1008.25