
Welcome to the new Traders Laboratory! Please bear with us as we finish the migration over the next few days. If you find any issues, want to leave feedback, get in touch with us, or offer suggestions please post to the Support forum here.


JeremyGoh
-
Content Count
8 -
Joined
-
Last visited
Posts posted by JeremyGoh
-
-
Hi everyone,
I have converted Eiger VSA analysis to PDF for my own use,
however I decided to share it with everyone here.
Do let me know if I can or should continue to post the PDF here,
if not this will be the first and the last.
Jeremy
-
Oh no... what I fear most had happened...
I keep asking myself to read and download all the posting.. from traders laboratory.. but keep delaying.. Ai... should have done that earlier.. sad sad
sad.. I'm going to miss many lessons..
-
Hi all,
Anyone facing problem viewing picture on this posting? http://www.traderslaboratory.com/forums/151/vsa-volume-spread-analysis-part-ii-3428-140.html
I try to open a few pic, but they are all blank, however the latest picture on page 207 is alright. Anyone having the same problem or me alone?
Hope all the past picture are not lost...
Jeremy
-
I'm very interested in the things you guys are talking about here. I've attached a chart below to get some feedback by some of you veteran VSA traders. How do you interpret this action?Thanks for any feedback
[ATTACH]8891[/ATTACH]
Not sure if I'm correct.
Looks like climatic action/stopping volume with the next bar up.
Start looking for no supply signal before entry.
Jeremy
-
S/R and trend lines are best learned from studying the Wyckoff course materials. Tom Williams also discusses how to construct trend lines in his Undeclared Secrets book as well as what to look for as price approaches trend lines and S/R.As for stops and exits, both of mine are much wider than yours. What I do really isn't relevant to what you do in this area. Stops are a function of your account size, risk parameters, and the individual trade set up. You need to first understand risk, how to calculate it, and how that relates to your account size. Then you can translate that into a plan and test it out thoroughly with a fair amount of practice. You will not get all you need to know just from the sources you mentioned. You must go outside these threads and study other sources. For risk and money management, start with Van Tharp.
Hope this is useful,
Eiger
Hi Eiger,
Is the Wyckoff course materials from http://wyckoffstockmarketinstitute.com/course.htm?
Jeremy
-
Hi Mark,
True test appear on down bar, what if it close the same as the open or 0.25 above the open? do you still consider it a test?
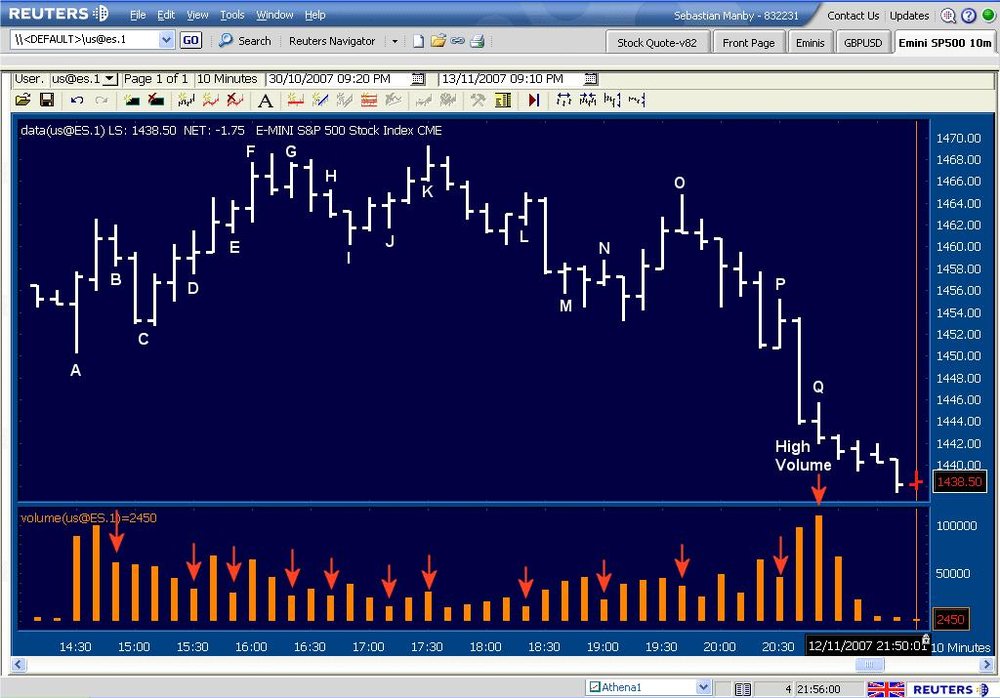
Take Bar J(New chart - 12 Nov) for example, isn't it a test of the previous bar? and bar M is also a test? can I also consider it a down-thrust?
Thanks for your explanation on no demand and supply. As you mention, about up move with No demand. Is it easier to look for No demand on down move trend and when the No demand sign appear it will be a buy signal? It is better to look for No supply on up move, whenever no supply appear, it will be a buy signal.
Hi JJ,
Thanks for reminding me the important of looking at the background and trend.
Currently I treading this way, First look at the trend of the market. If the trend is moving up, I will constantly look for no supply for entry. However, if there’s weakness in the background before no supply and down-thrust, I try not to buy. Same goes for down move, keep a look out for up-trust for entry provided there isn't any strength in the background. Is it correct to trade this way?
Hi Eiger,
Thanks for taking your precious time to do a close analysis on this chart.
I don't fully understand S/R, trend channels. Do you have any recommendation where I can learn more basic stuff like S/R, trend channels etc. Btw, I have only read MTM by Tom William, and DTB by Wyckoff and many and many chart analysis by Sebastian and many posting from VSA forum. I don't want to spent time reading stuff not relevant to VSA but now I feel I need more basic stuff.

Can you roughly show me where will be your entry point be? I read chart by Sebastian but he didn't mention about entry point. Can I know more stuff like what is your stop losses 0.25 or 0.5? and your run? usually how long does it run? 2 to 4 to more and what is your best run? I just using your number as a guide so I know if I’m doing the right thing. Currently, I trying to stop losses at 0.5 and 1 and my closing max is about 3, usually 1 or below. I'm trading using 3min and 5min chart most of the time. Still trying to using 60 mins chart as a guide.
I have read a few chart by you from this forum. Still busying reading and testing out what I read and learn.
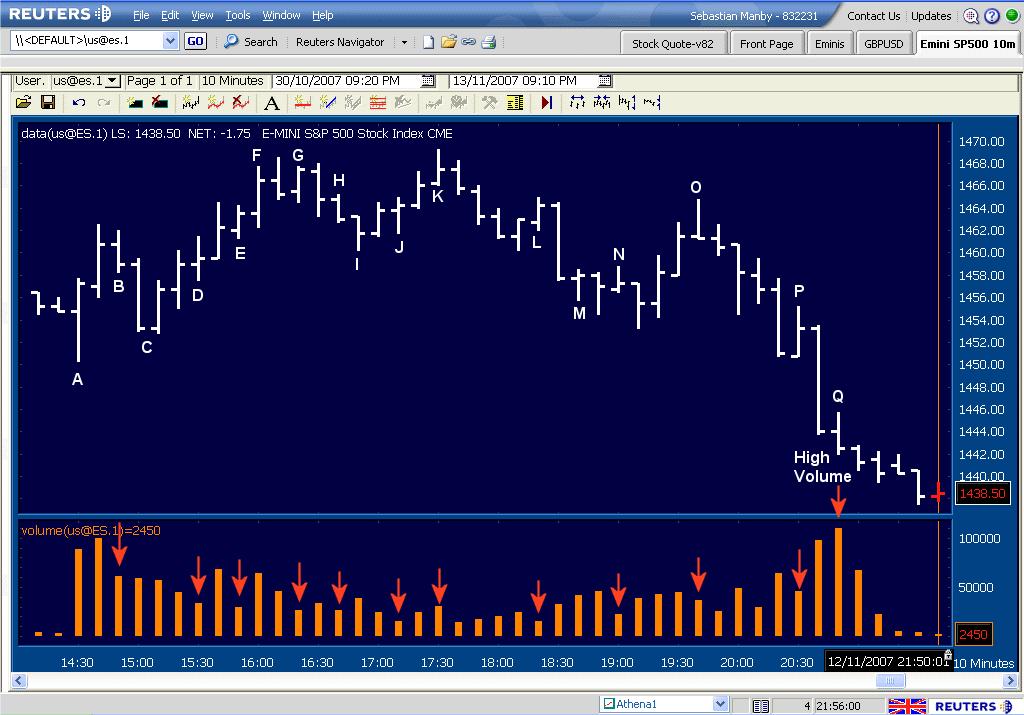
It really confuse me, Bar L and O is no supply? Why bar L is no supply because it close in the middle? Bar O is no supply because O close on the low with narrow spread?
I got more questions to ask regarding no supply and demand again. Sorry for asking such basic questions. Please help me get this right, if not I don’t think I can ever fully understand VSA.
For Nov 12,
Sebastian mention about
Bar D is No demand. Doesn't it look like a up-thrust?
Bar J is also no demand why? Because is close higher than the previous bar?
Bar N is no demand doesn't it look like a up-thrust?
What exectly is no demand and no supply?
Close higher than previous bar on up bar and close above the open is no demand on low volume?
Jeremy
-
Can someone please explain to me more about no demand bar in VSA. I read many many times, but I still cannot fully understand.
How come bar I is not a test for supply yet a no demand bar? I read from MTM - page 32 - No demand bar = low volume up-bar, on narrow spread. I can understand Bar N is no demand bar but I cannot understand bar I at all.
Can I consider bar J a test for supply bar? and consider it a successful test?
I; A no Demand up bar, volume clearly low, and it at the same level as bars C, D, indicating that prices will not push through this old high, and this is bearish. Next bar down.
J; this is a down bar closing very close to the open and look at the volume, very very low, you do not want to be short with this bar at it's close. The next bar is up also on low volume, but this could be that there are very few sellers and this is known as a vacuum.
Jeremy

Pure VSA
in Volume Spread Analysis
Posted
Hi Eiger,
Can you please explain why.
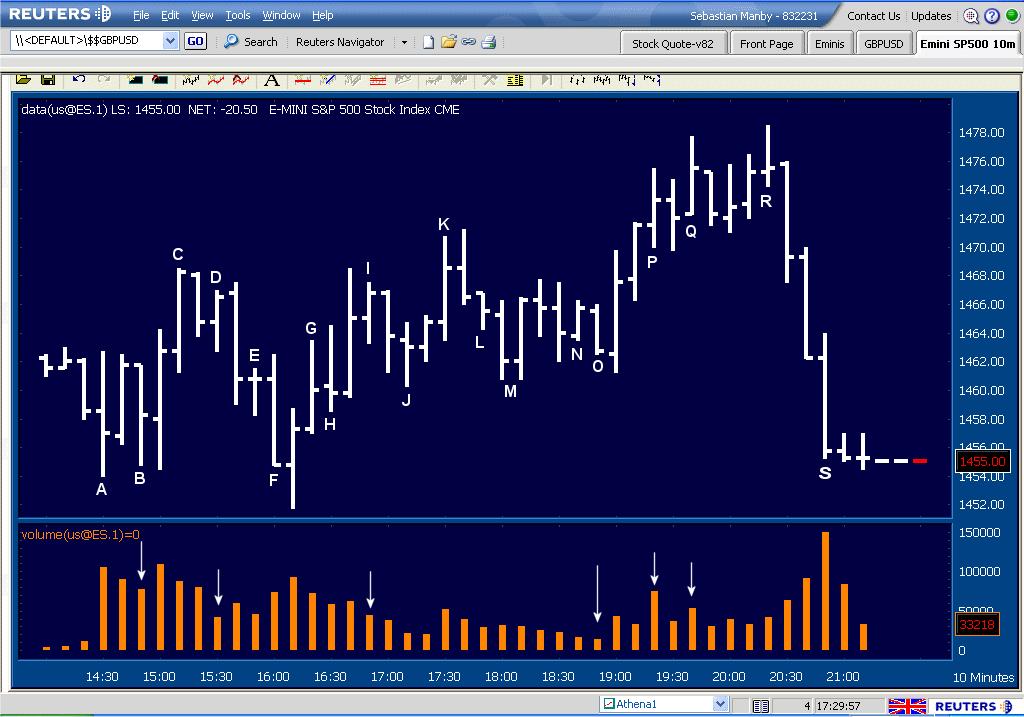
B - Market falls, but volume recedes. On B and the bar before B, closes are in the middle indicating buying coming in. Note the lack of progress on the lows from the bar before B and B. Next bar is up.
My Question : With low volume on B, next bar up, indicate buying I can understand. Isn't this bar B with low volume shows that professional traders are not interested in the up move?
C - Market rallies and volume comes in on C, indicating buying.
My Question : I thought when we see a UT on C, with the next bar down, it indicate selling. Why did you indicate buying? How do you know what bar is buying and not selling?
Many Thanks,
Jeremy