
Welcome to the new Traders Laboratory! Please bear with us as we finish the migration over the next few days. If you find any issues, want to leave feedback, get in touch with us, or offer suggestions please post to the Support forum here.

disperados-x
-
Content Count
21 -
Joined
-
Last visited
Posts posted by disperados-x
-
-
Has Read the reviews about Stock Market Technique on Amazon. The Conclusion - in book one Philosophy not revealling essence of the method Wyckoff. There is beside Wyckoff books which reveal the essence of his(its) methods to trade or this only in SMI course?
-
Yes, language can be a bitch, but we'll keep at it
And, yes, examples mean more than verbal explanations. A picture's worth a thousand words and so on.
So, let's move on to your specific concerns rather than go on again about concepts.
Absorption is first addressed in Section 7, p 8.
Hypodermics are first addressed in Section 7, p 11, and Section 8, pp 5 and 15.
Springboards are addressed in thirteen different sections, beginning with 4 (not posted here), 7, and 8. Use Ctrl+F to locate the specific pages. You can also refer to the springboards section of my blog.
As for "stopping volume", this is not mentioned in Wyckoff's course, though it's pretty self-explanatory, i.e., volume which is heavy enough to stop price in its tracks. This type of volume can often be found in climaxes, though it often occurs shortly after what appears to be -- at the time -- climactic volume.
If there's anything more than doesn't have to do specifically with Wyckoff Resources, feel free to take advantage of the Ask Any Wyckoff-Related Question or Trading the Wyckoff Way, or any other thread which may be more specifically related to your question. Annotated charts are probably going to mean a lot more to you than more verbal explanations.
Thank you Db!
You may briefly describe the contents of the book Wyckoff -Stock Market Technique? Never read this book, there is in her description of the action in trading range and main notion glossary Wyckoff? Cost(stand)s her(its) read for the best assimilation philosophy Wyckoff and his(its) notion, or it is enough information this Wyckoff forum, SMI course, and opinions Pruden, Coppola, Forte, Williams and others?
-
Perhaps the only way of answering this satisfactorily is for you to obtain the Taylor course, the Pruden material, the SMI course, and the original Wyckoff course in its entirety and make the comparisons yourself. Otherwise you're in the position of relying on somebody else to tell you what you should know rather than relying on your own work to make that determination.Some may say that I myself am setting myself up as someone who is telling you what you should know, and if the Wyckoff material weren't here, then that would be true. However, it is here, and one can study it at his leisure without paying the slightest bit of attention to anything I say about it.
Therefore, if you want to spend the money to buy other courses and materials, nobody's going to tell you that you can't. It is, after all, your money and your time. But I'm not in a position to advise you on those purchases.
(Note: seems I posted this before you posted your edit. However, what I've posted above still applies to anyone who wants to do more than trade the market superficially.)
I have edited the message since have understood not correction its question. I have understood that you not introduce;make familiar with with material these course Stewart Taylor and Pruden. Itself I their already studied. Particularly course Pruden SMI and book Behavorial Skill, with S.Taylor I while sign less. In course SMI from Pruden I have found the general principles from Behavorial Skill and separate parts from the other work possible most Wyckoff - absorption, hypodermix, stopping volume and others, but they were without explanations (only pictures). I it is difficult to judge about that pertain these notions to original Wyckoff. Since from his(its) original work I sign only with Studies tape reading (in her is not revealled essence of the method trading range) and Investing in stock and bonds (little useful information). But read Coppola, Forte, Pruden, Williams, Taylor, Hutson, Db. So I should like to honour Stock market technique. I seem in her are stated main notions trading range (the type hypodernix, absorption, springboard and other) in original Wyckoff. I am a rights? Itself I bad know english so paper texts for me not available since translation by means of computer translator.
-
Db,
Thank you for unrolled answer! I am pleased existence of the similar forum due to, which possible get and be divided by greater information on Wyckoff method!
-
Always good to see credit go where it's due. And I know what you mean by the "lots of time" part. I've restored a number of charts in the original course, and in many cases it's bar by bar by bar.But it's a kind of therapy as well. Like basket-weaving.
Db!
What is the difference between SMI course Hank Pruden "Analyzing the Price and Volume Movement of Market Tradable Item According to the Principles of Mass Psychology" and the SMI Stewart Taylor course "Wyckoff Analysis, The art Price and Volume"? What does Pruden and Taylor to the Wyckoff Stock market institute?
-
LaurenceI am not a guru.
I have studied and use both Wyckoff and VSA concepts.
Understand this: VSA is derived from Wyckoff.
In wyckoff there is nothing like
"markets do not like upbars on high vol" and "professionals lurking in the background to pounce on you". This is all hype in VSA. Context is the what matters.
There are some very useful setups in VSA , again based entirely on Wyckoff but presented in somewhat simpler way and that is all you require. Drop the rest, especially the urge to figure out who is moving the market, each bar in the right context reveals if there is Buying or Selling pressure. Vol is activity, on each bar selling and buying contracts are equal, what the price does tells you who is in control and that is all you need to know. Anything else is just distraction.
In your quote ref P39 chart 7, the explanation is confusing: The context is "Pushing through Supply", There are lots of traders who were long and are itching to get out at breakeven if price reaches the level at which they bought after a fall. To absorb this vol, the demand has to be greater than supply ie. buying pressure is in control, there are more contracts on the bid, totally forget about professionals:)))
If you wish to progress without getting mired into lot of VSA jargon, get hold of the latest Al Brooks Book "Reading Price Charts Bar by Bar", Preface alone will set you on the right path. and is worth the price of the book
Attached is a pdf : The first section of the book on "Price Action".
Next go to the Wyckoff forum, there is enough there to guide you further on how to read vol which is Effort and price move which is Result. You really do not need any more, no fancy software, seminars, etc period.
End of day, Your choice.
Good Luck
You has a full Al Brooks book? Will Be able its here show? Long ago want to look her. But while on the first part me she did not like on interpretation of the material. Wanted hear whole she such.
-
Sorry,
I am bad know english
-
Overall, I think the picture is still weak.Strength entered the market four bars back on a down close with ultra high volume that closed off its lows with the next bar up. When strength appears, it appears on down bars. This bar was stopping volume/climatic action. The close of this bar is now our trigger number. For more information on that, watch the trade guider videos.
The next bar is up but the range is narrow and the volume is lower. Something is keeping the range narrow-overhead supply. The close is also in the middle of the range.
The next bar is again an up bar with a narrow range, but this time the volume is even lower. We now have volume less than the prior two bars with a narrow range bar closing up and closing in the middle of its range. This is no demand. This bar happens to also be a NR7 bar so we can conclude that the BBs are not active on this bar. However, the bar does not complete, so we are looking at no buying pressure not no demand.
The last bar has an increasing range on volume that is still decreasing. This bar still remains a sign of no buying pressure. This bar has to be taken with a grain of salt as it is a holiday shorted trading day bar.
Barring the government's coming in and changing the rules, It looks like this market is poised to fall down and either give a test or push thru the close of the climatic action bar. Most likely, it will begin to build a cause and then test before moving higher.
P.S. I don't use moving averages, but the price is still below the one on the chart. A no demand that trades up to that average would be pretty powerful as well.
On the grounds of what you judge about entering the demand in bar of the stopping volume? Realy increased volume, under else more extended spread is a base to speak of that that enters the demand? Buying with minimum spread stopping volume quite little. Demand entering into hammer, and not fact that this temporary demand. With such probability, increased volume can give the push to continuation of the reduction. But judge the situations only only after happened bar, easy.
Than more tenders vsa that more are dysappointed in Wycoff, since he nothing not better Larry, moving average, Livermore, Gann, WRB, Elliot.... , such subjectivity, but more pleasing for perception so is founded on real not grabled to statistics so and tenders to her. On different graph all maded examples will look on miscellaneous
-
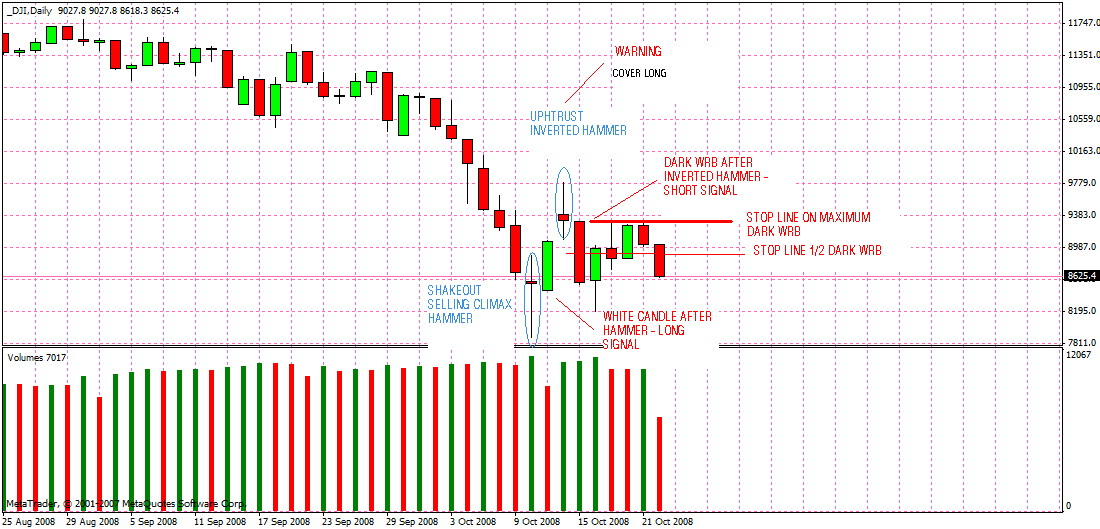
Good signal is seen On my drawing for entering in short, but after we see that to remain in short I was able only having installed foots above maximum dark. But after all I entered nearly on minimum dark WRB.
1) Under possible following motion upwards after my short position I lose 300 point if stop is installed on maximum WRB.
2) Under possible following motion not above maximum WRB (as it was got on my picture) I lose short to position if stop I had is installed to example on half dark WRB
-
The Example:
the signals of the entry in long
- effort (wrb on high volume)
- Pushing Up Through Supply
- Shakeоut
signals of the entry in short:
-uphtrust
- selling pressure
- effort (wrb on high volume)
And signals of the acknowledgement of the trend after main signal
Possible, together beside us to be reduce subjectivity of the method VSA
-
Looks to me like the "hammer" is an example of No Supply. It closes down from the previous candle, closes near the middle of its range and has volume less than the previous two candles. (BTW this is not a "hammer")The WRB you identified is an Effort To Rise candle. Note that the volume is not that high. Markets do not like very high volume on up candles, but here the volume is relatively low. What we see after this Effort To Rise, is NO RESULT from an Effort To Rise. This shows the general weakness in the market.
Moreover, two candles later we have a Test. This is a good test as the volume is less than the previous two candles and the close is in the middle. The market does close up the next candle. But then price moves down. This is weakness: no result from a Test. If you count 4 candles forward, you see a dark WRB closing lower than the Test bar. Again this shows weakness.
Simply, the market is weak. Some buying entered on the candle before the No Supply "Hammer" which was followed up by an effort to move higher. That effort, however, is soon negated as price moves down.
There has not yet been enough CAUSE for higher prices.
Allow to be created in strategies to trade VSA, I see since participant of the forum processed vastly material, but strategies to trade hitherto do not concern carefully. It Is Got VSA required for description already happened motion, rather then for real trade. Why not to adapt the strategies from trade message to value VSA, with some change bound entering the volume?
In them certainly much subjectivity, and sample for trading does not happen often and not always they correct. But why not probe change their having reduced their subjectivity?
-
No. Volume is not nearly high enough to qualify for a Selling Climax. Volume needs to be abnormally high. Spreads need to be ultra wide, and we need to see a close mid-range or better. A Selling Climax occurs after a significant trend down. You will also normally see an acceleration of the down trend just before the climax on a substantial decline (though not on a minor decline).Eiger
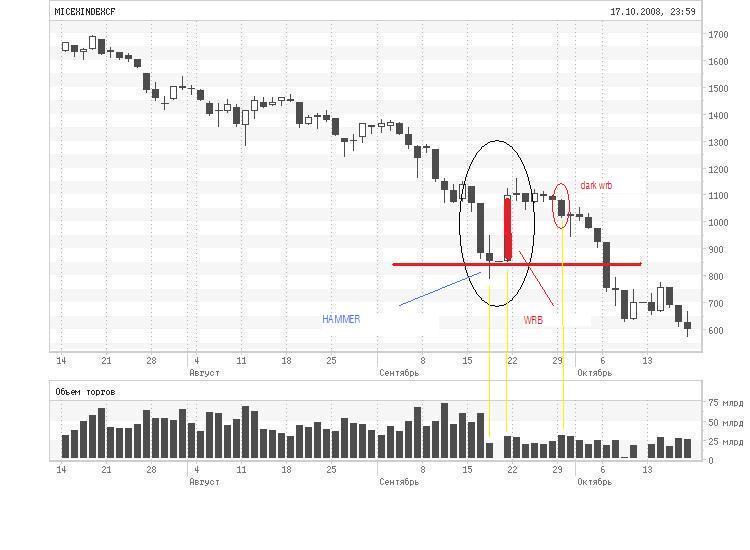
Thank you for answer. Really so, indeed this was manipulation hits to activities on background of the prohibition shorts, and continuation was hereinafter fall. Well that VSA distinguishes the manipulate from truth. Enclose the picture of the continuation.
But after fall was a hammer, but then appeared WRB (manipulation). After the trader entered on WRB in long and output on her(its) minimum, he has lost much money.
Hammer - Long lower shadow. WRB - bullish price action and Bullish Engulfing. But there is else output on dark WRB with high volume.
I am a rights?
P.S. : Delete my messages 1634 and 1635 - they duplicate my text
-
No. Volume is not nearly high enough to qualify for a Selling Climax. Volume needs to be abnormally high. Spreads need to be ultra wide, and we need to see a close mid-range or better. A Selling Climax occurs after a significant trend down. You will also normally see an acceleration of the down trend just before the climax on a substantial decline (though not on a minor decline).Eiger
Thank you for answer. Really so, indeed this was манипулятивный hits to activities on background of the prohibition shorts, and continuation was hereinafter fall. Well that VSA distinguishes the manipulate from truth. Enclose the picture of the continuation.
But after fall was a hammer, but then appeared WRB (manipulation). Ated the trader entered on WRB in long and left on her(its) minimum, he has lost much money.
Hammer - Long lower shadow. WRB - bullish price action and Bullish Engulfing. I am a rights?

-
Thank you for answer. Really so, indeed this was manipulation hits to activities on background of the prohibition shorts, and continuation was hereinafter fall. Well that VSA distinguishes the manipulate from truth. Enclose picture of the continuation.
-
Apologize that wrote message not in necessary subject of the forum
-
Another non-constructive post. This is not the thread for comments like that. It is for those who are interested in VSA to learn, not be discouraged. Go to the crock or not thread if this is your mindset.I expected such answer to my message. But there is opinion - "truth" will be born In dispute. And the main not to be a fanatic to ideas, since nearly all ideas carry the mistakes and subjectivity.
I not against VSA and WRB, but I also see their subjectivity, and not possibility to be a full truth, either as many other methods to trade.
Itself I study - VSA and WRB, Wycoff, tape reading - these methods main in my study. The A great deal I have studied on this forum, and for this thank you Traders labaratory. But I not fanatic them. And want to use them in less subjective side.
If the main participants this subject against critics, I shall not enter in dispute from respect to forum.
-
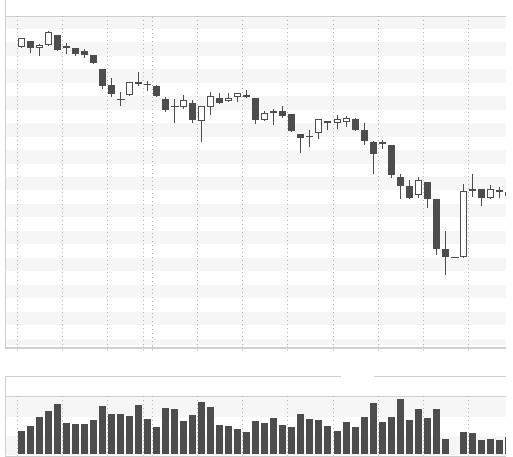
Much bottoms to similars Selling climax on picture. If after each will get up in long position, possible destroy the deposit. That to find output?
P.s.: Sorry, I am bad speak in english.
-
sevensa, Admittedly, I'm still struggling with this. VSA is so elegant, I would dearly love it to work, and I may yet understand it well enough that it will help my trading. My problem with VSA remains the same, namely that it all sounds so logical in hindsight, but I have yet to see a VSA "expert" who can use it in real-time without getting egg in his beard.Darn good idea to re-post my query in the indicator section.
Not to distress. VSA as any other way to trade subjective, and wins more lucky, this not saint grail and possible not the most best method (excuse me, i am, dont speak english)
-
Hello guys! This is selling climax in WSA (WRB)?
-
Hello guys! This is selling climax?

VSA Official Summary Part 2
in Volume Spread Analysis
Posted
Soultrader you are megatitanium! Thanks!!!