
Welcome to the new Traders Laboratory! Please bear with us as we finish the migration over the next few days. If you find any issues, want to leave feedback, get in touch with us, or offer suggestions please post to the Support forum here.


Plaste
-
Content Count
15 -
Joined
-
Last visited
Posts posted by Plaste
-
-
On the question of opening gaps here are some stats you might find useful.
From S&P futures.
If the open - close yesterday is greater than 0.1 x 10 day ATR then buy open:
Trades 1326
Win 176 points
Win % 54.3
If the close yesterday - open is greater than .2 * 10 day ATR then sell open:
Trades 781
Win 292 points
Win % 49.17
Stats from 19970101. No slippage or commission.
Not much information on their own but definitely useful when combined with some kind of 'move off the open' strategy as advocated by Thales. Eg yesterday it helped to make 7 points at a time of the month when I would normally only be going long.
-
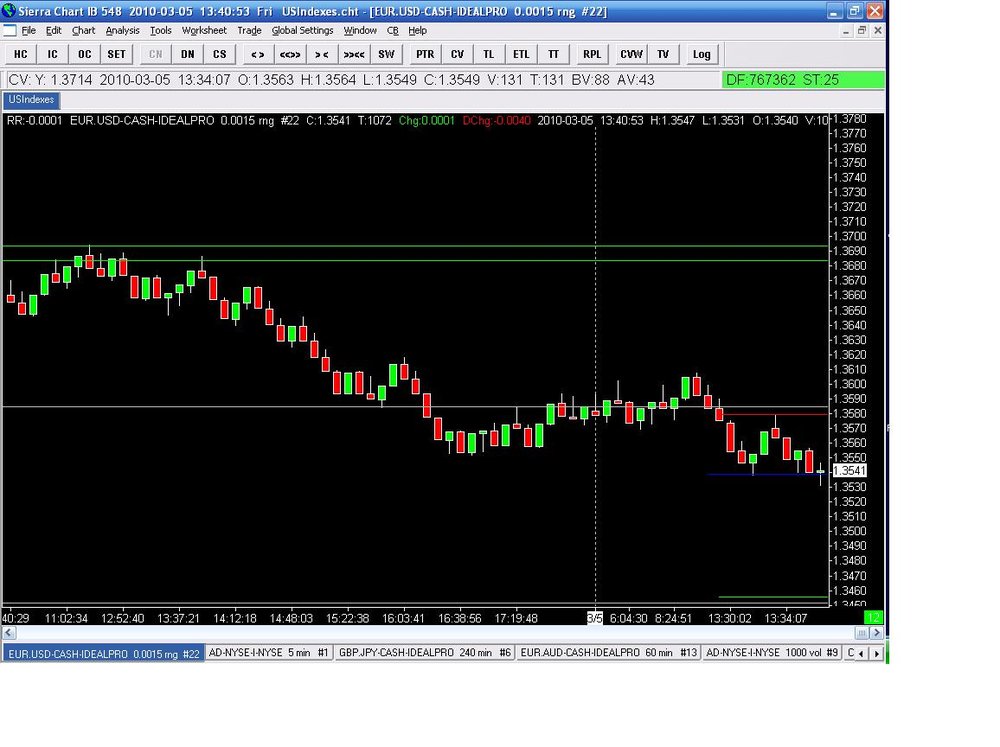
Short euro cash 1.3540, stop 1.3565, PT 1.3455Stopped out at 1.3565 (should have been 1.3580 but I entered the wrong price). For the sake of completeness I am now long at 1.3583, original stop @ 1.3540, now 1.3567.
-
Short euro cash 1.3540, stop 1.3565, PT 1.3455
-
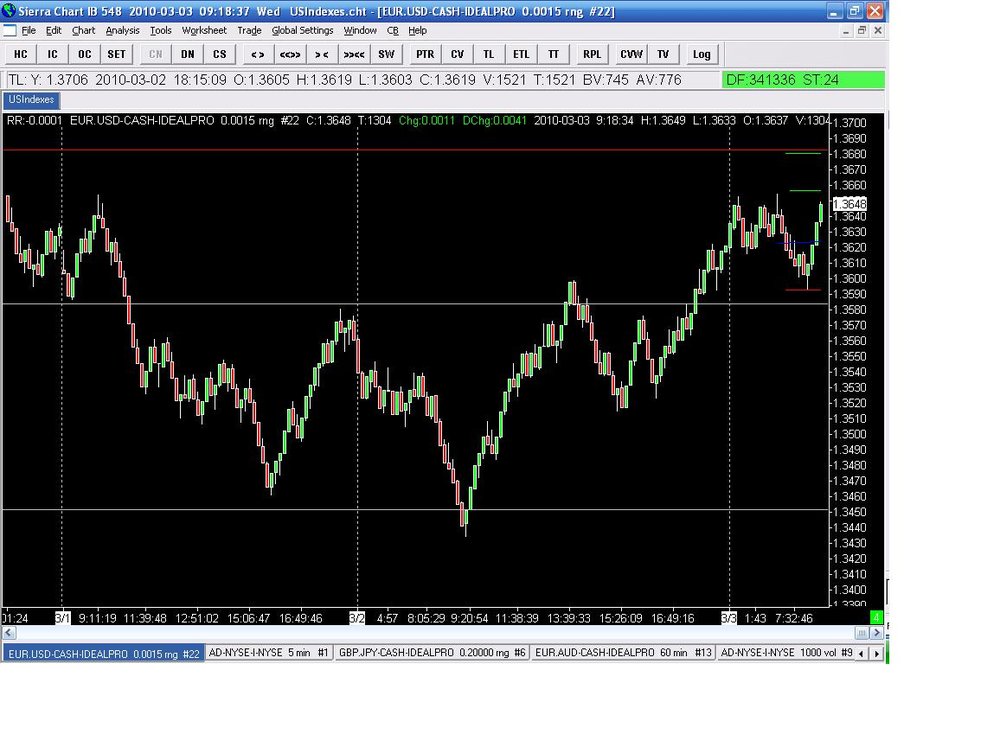
my reply is definatly in hindsight since I dont trade FX very often. But let me explain why TTT may have help take the profit at 1.3655.Today is a Sell day and as such we should expect a rally that started on the Buy day low (yesterday) at 1.3433 I have 2 different ways to calculate what the average rally should be.
One is based all the data since Jan 1, 2008 and that TTT rally would take you to 1.3615
Second is based on data of the last 20 cycle or 3 months Called TTT MA that is at 1.3550
The rally was mostly accomplished on the Buy day. The Sell day opened at the TTT Rally level and tried to continue higher causing a penetration of the Buy Day high.
The average MA penetration takes you to 1.3660 and the regular to 1.3703
So for me TTT would dictate that some profit should be taken at the 1.3660 level
Also most Sell days where the rally has been mostly accomplised on the Buy day, ends up being a confusing day. What I mean by confusing day is that they are usualy see-saw days.
I hope that helps expalin how I would have used TTT in this situation.
It was a bit of a shock to me to find so much interest in TTT. When I first read the book it made no sense at all but you guys have persuaded me to dig it out and have another look...
-
If you're still here plaste, here are two long opportunities in hindsight from your morning and from my last night (as in I was sleeping when these occurred).In each case, I see a perfectly acceptable long opportunity, but since each was taken near the top of the current range as defined in my above post, I would have exited the entire position at the green line, which would typically have been PT1 where I'd only exit 1/2 and leave half on for a higher PT2. When long near a top, my expectations are less than if I am long near a bottom.
Best Wishes,
Thales
Thanks for the input. Your first example is the one I took. From my paper trading I know that I can reasonably guess where the market is going next but that this is usually not far enough to generate enough profit. That is why I move the stop to b/e and look for the next leg of the move - in this case up to the 1.3683 level.
The second trade I didn't see as I was using range bars but I know from some backtesting I've done that those small inside bars have value. However the message I'm getting loud and clear is that I'm trading up against some serious resistance that needs to be paid a bit more respect.
Tom.
-
Thanks for the comments folks.
I took the trade for the following reasons:
1. On my 15 tick range chart we had a breakout to the downside of a bull flag that was rejected at nearby resistance (yesterday's 1.3549).
2. I'm currently looking just at the pound, yen and euro for daytrading and the euro looked stronger than the pound and the yen was just choppy.
3. Trade was early in the (european) morning when any decent move might be expected to develop.
4. It felt right! My paper trading of this style of trading suggests that using a little intuition can be useful, not so much for initiating trades but for avoiding them.
Target was the resistance Thales refers to. And the fact that this trade didn't go anywhere suggests we may be near a top or chop zone. I'm on the sidelines for the time being.
Thanks for the comments about NFP, Thales, you pre-empted my question.
Tom.
-
Sorry to post after the fact but always forget when I'm in the middle of setting limits and so on and just wanted to get the ball moving. Here's a trade I'm currently in. Long Euro $ cash at 1.3624, stop 1.3591, limit 1.3681. Stop to b/e at first green line.Well that all took so long stop is now 1.3625.
Out for + 1 tick. Maybe should have taken profits when price quickly rejected 1.3655. Any comments or suggetions welcome.
-
Sorry to post after the fact but always forget when I'm in the middle of setting limits and so on and just wanted to get the ball moving. Here's a trade I'm currently in. Long Euro $ cash at 1.3624, stop 1.3591, limit 1.3681. Stop to b/e at first green line.
Well that all took so long stop is now 1.3625.
-
Thanks Tom.Definately the best way to go to smooth returns over a portfolio is to add various strategies - if they actually increase returns over the long run they are even better. Did the website I directed you to help, or did you already know about it? (very different to this one - more tailored to trend trading) There are endless discussions about combining strategies there. Thats why I use this site more to ask and learn about day/short term trading - or associated trading ideas.
Thanks DugDug, I'd been there in the past but not for a long time. If they've got some useful stuff about combining strategies I'll go and have a root around. In my experience it takes a lot of work to come up with two trend following systems that, when traded together, actually improve risk adjusted performance rather than just returning an average of both.
-
Here are the edited highlights of backtest results from my current systems:
Long term trend following only:
Compound annual return: 22.91%
Max Drawdown: 37.1%
Longest Drawdown: 1.65 years
Sharpe Ratio: 0.99
Add the medium term trend following system to the above:
Compound annual return: 32.57%
Max Drawdown: 32.57%
Longest Drawdown: 1.07 years
Sharpe Ratio: 1.17
Add the divergence stock index system to the above two:
Compound annual return: 41.48%
Max Drawdown: 31.17%
Longest Drawdown: 1.34 years
Sharpe Ratio: 1.48
Obviously we're not going to see figures as good as this in practise, but the principle certainly held up last year in practise when a lot of trend followers had a hard time but the above mix of systems still came out ahead.
-
Hi Tom, I have done a lot of work similar to this, and was looking at expanding more into intraday trading (too much time on my hands!) hence the tread to look at combining strategies in order to get the most of it by taking profits on smaller trades to smooth the PLDo you only trade the short term divergence and the trend trading on the stock indexes, or do you have a more diversified basket of commodities, FX, rates, and stock indexes?
Do you find that it sufficiently smooths the returns without detracting from the PL (21% pa is good)
how are the max drawdowns? (seemingly inherent in most trend following systems - however stop and reverse may be different)
How was the recent 12 months (it looks good on your chart)- most long term trend follwers have not enjoyed them - even if 2008 was good?
(plus if you PM me there is something organised via another site you might be interested in if you are in the UK specifically related to trend follwing)
Sounds like we're both in the same boat at the moment. I'm currently reworking an ORB index system to help smooth returns and trading S & R a la ThalesTrader in very small size for the same reasons.
The divergence trades are only on the indexes, the rest is on everything (but not individual stocks). Here's my current portfolio:
Shorts: Gilts, Euros, Spanish SM (SM = stokc market index), Italy SM, EuroStoxx 50 SM, France SM, Corn, Brent Crude, Swiss Francs, Gas Oil, Silver.
Longs: Dax, Nasdaq, Australia SM, Yen, Canadian Dollar, Euros Schatz, Eurodollar.
I've been through 50% drawdowns (though I didn't know as much then) and it is a problem with the method to some extent. 2008 returned 12.4%, 2009 9.3%. If I get a chance I'll run some simulations on Mechanica to show how adding systems improves things.
Tom.
-
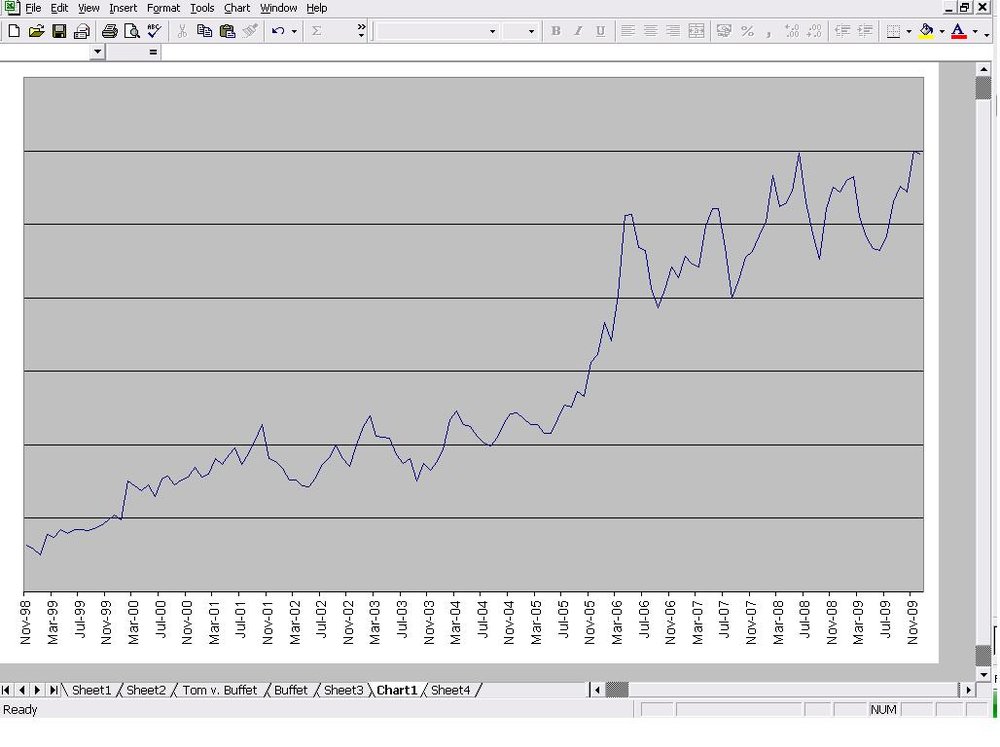
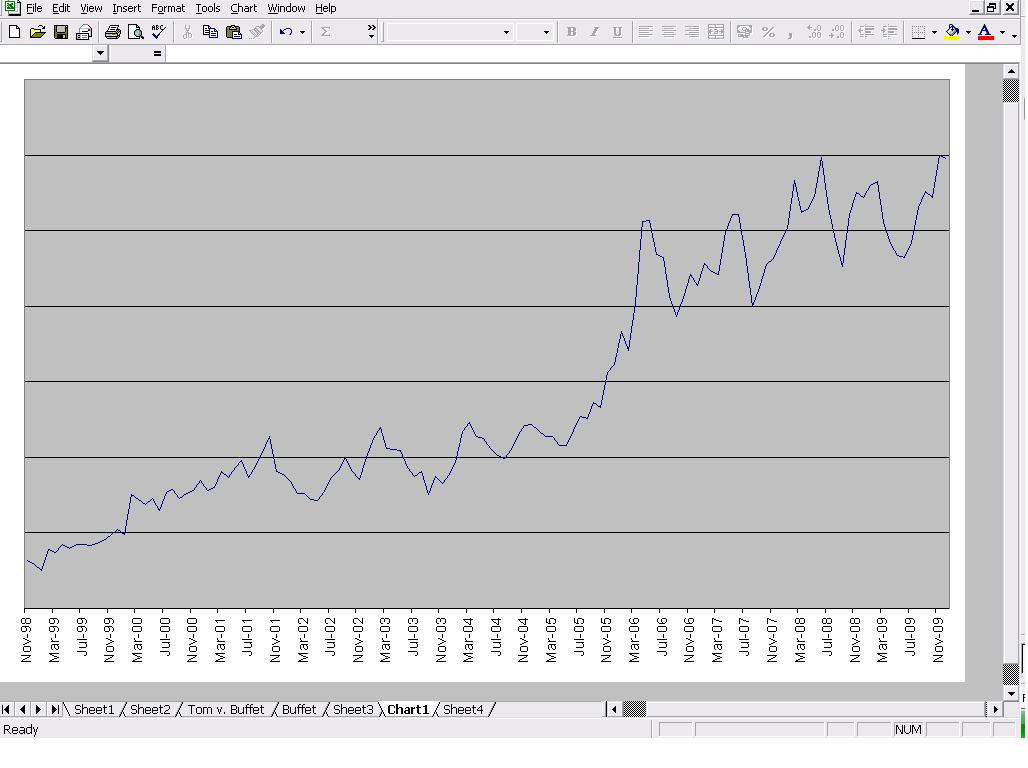
After re-reading wizards it made me think too. I figured use a spread bet account so you can trade small size and diversify. Diversification is another important factor imho, these systems tend to use diversification to smooth the equity curve. The thinking being that all you need is one or two instruments on a roll to offset any whipsawing in others. If you approach it from a portfolio point of view trading different systems on the portfolio is likely to help but simply taking 20 fairly un corelated instruments in the first place is likely to be simpler). The turtle document lists there basket for example. Actually there is quite a lot to be learnt about other aspects of trend following from it.Well, that's exactly what I do. I trade a long term trend following system, basically a stop and reverse system. I then trade a medium term trend following system that exits on a time stop and then in addition to that I trade a short term divergence system on a basket of stock market indexes. All end of day. All with a spread betting company. The graph shows the results of every trade I'd made up to the end of last year. (Only the last couple of years were traded as outlined above. I started out trading Aberration but as its results degraded over time I've added my own systems). One losing calendar year, compound annual growth of about 21% per year.
Hope that's interesting to you.
Tom.
-
Double yes! That's the essence of Fisher's ACD methode, which I often use with FDAX.Currencies trade around the clock, so the method cannot be applied to them.
Morning Gents, nice thread you have here.
Whilst I've certainly been able to make opening range breakouts work on the SP (based on the first 15 mins action and trading entirely systematically) I've had no success with the DAX. Seems to me that European stockmarkets are afraid to do anything until they know what's happening in the US. On the other hand it seems that currencies slow down a lot after lunch in the States. I'd be interested to hear what others think are the best times to trade different markets.
Tom.


Reading Charts in Real Time
in General Trading
Posted
But despite the big gap down and move away from the open this morning the system hasn't given a signal. An interesting day ahead.