
Welcome to the new Traders Laboratory! Please bear with us as we finish the migration over the next few days. If you find any issues, want to leave feedback, get in touch with us, or offer suggestions please post to the Support forum here.


gomes
-
Content Count
18 -
Joined
-
Last visited
Posts posted by gomes
-
-
Hey ryker,
I found the problem. I was putting the date data prefix so when I clear this I got it working properly finally. I am good to go now.
I have one more question if I may bother you.
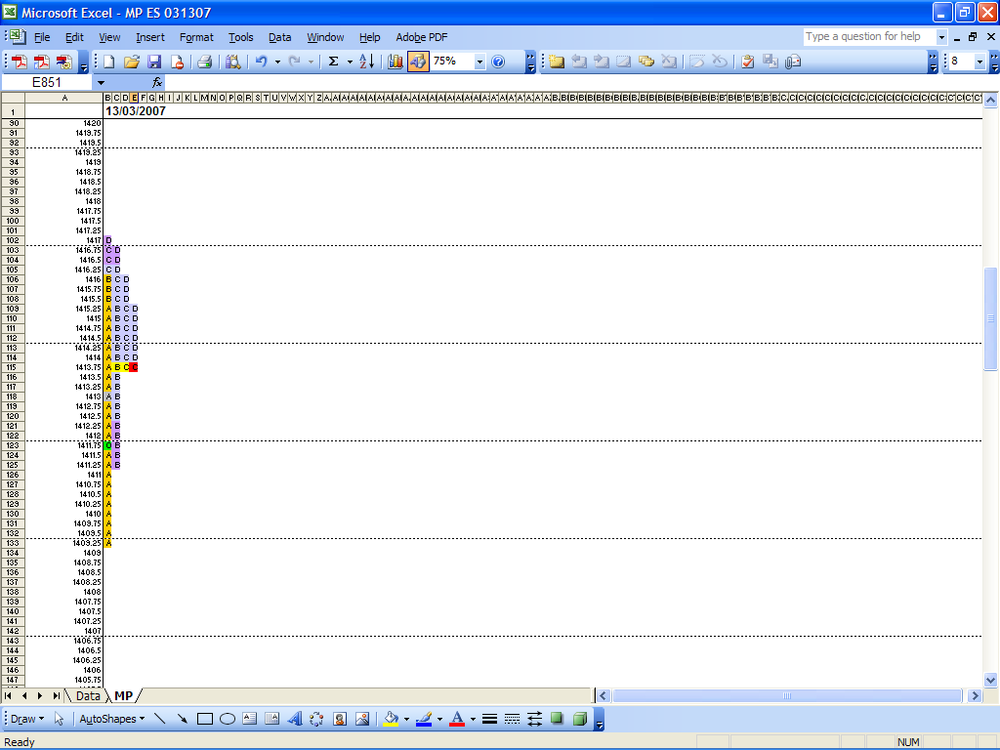
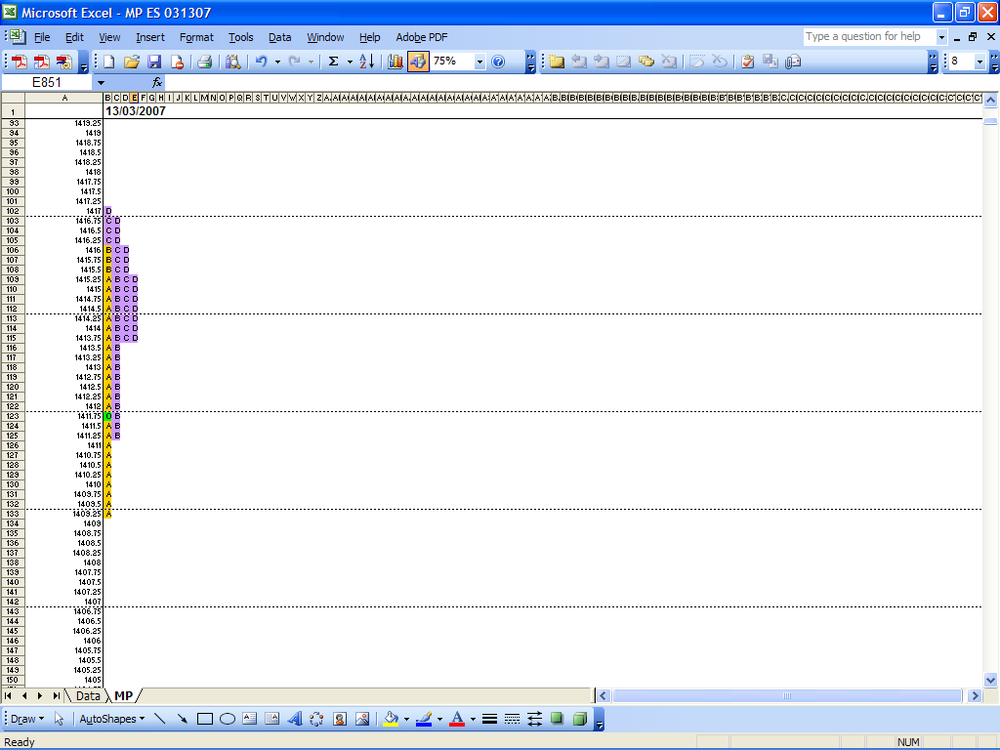
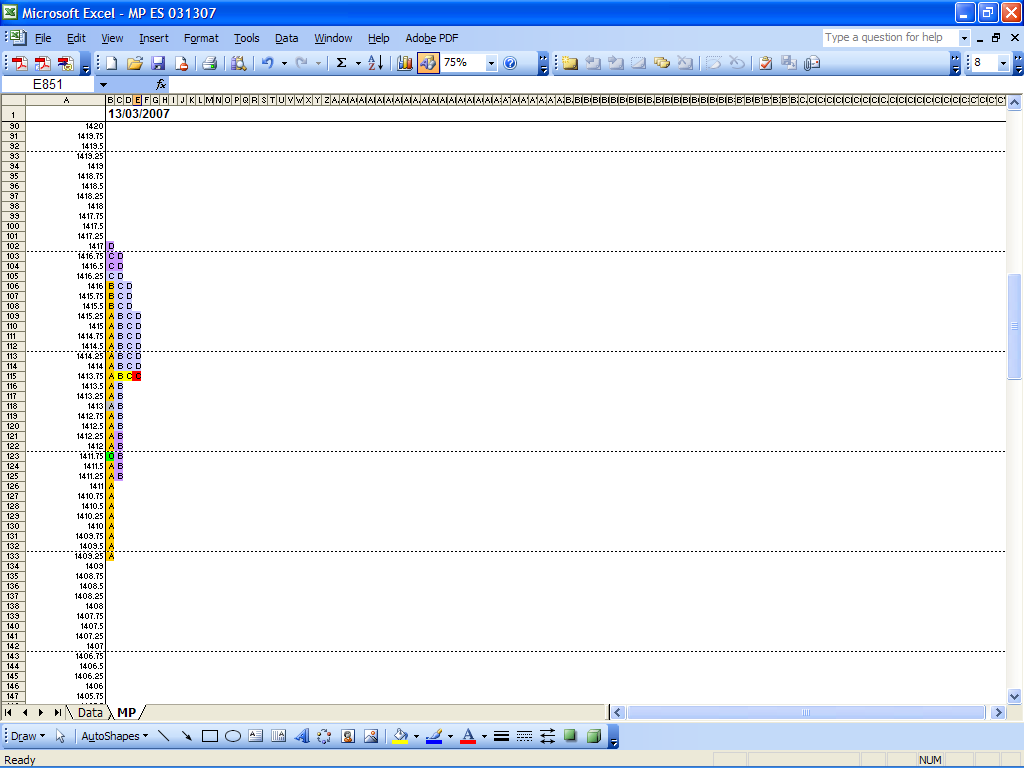
What is the gray A in the first bracket, I am just curious about that.
Thanks for all of your efforts and time.
Regards
Humberto
-
hey ryker,
I think something wrong from my end, with the same data, 4 time slices I don't have value in my MP. I will try to see what is problem, hope I can fix this.
Thanks for your help.
Regards
Humberto
-
Hi ryker
I am sending my data file. I hope you can find the problem.
Thanks a lot.
Regards
Humberto
MEGAUPLOAD - The leading online storage and file delivery service
-
Hey ryker,
Everything is going smooth, but I have a question.
As you can see from the file I posted, this is 7. bracket but still there is no value area on the MP. On this day I got value area on 9. bracket. Do you know what causes that. I can understand after first couple brackets if there is no value area, but after 8 bracket, I thought I did something wrong. Whenever you have time could you enlighten me about this. I may be doing something wrong or I need to change something in it.
Thanks in advance for your time and effort.
Regards
Humberto
MEGAUPLOAD - The leading online storage and file delivery service
-
I think files didn't come through.
MEGAUPLOAD - The leading online storage and file delivery service 03/13/07
MEGAUPLOAD - The leading online storage and file delivery service 03/14/07
see how it goes
-
Hey, ryker
Day first,
I didn't know your spreadsheet comes with a bonus trade like this.Yikes! There is a handsome profit.
Look at this MP charts. One from yesterday and one from today.
Thanks a lot mate.
Regards
Humberto
-
Hi, ryker
You are 100% right. I made it. I did as you said and finally I was able to create the MP. It couldn't be easier than this but I couldn't see it.
Thanks a trillion to you ryker. You are a good fellow.
I will use your spreadsheet each and everyday.
Regards
Humberto
-
Thanks bobajob,
You answered my questions
It was interesting to see your take on MP. There are somethings in it to beneficial to anyone who knows what they are looking for. you are very generous to share your analysis.
and I want to thank everyone for their contributions to the subject.
To wrap things up, the reason I asked for MP on excel was to see how the value area changes with the price changes during the day and if I have some kind of tool like the ryker has I can run the price before it gets there and see how the profile looks like. Where the POC is going to be and wit that where the value area is moving to and market looks balance or not, if value area stuck how it will be balanced again etc. This was just a thought.
And I have one more question to ryker,
Ryker I am unable to paste the info in the sheet to chage the MP, but I can change the info in that symbol you send. So I am asking you if you can share the excel spreadsheet for ES symbol if it is handy. I was going to PM you but maybe someone else can benefit from it, I asked you in the forum. Thanks in advance.
Regards
Humberto
-
MEGAUPLOAD - The leading online storage and file delivery serviceThe pdf attached has 4 days trading - not consecutive. Lets start with page 1:
So the chart shows the price on the left, it's the ES by the way - 2004 in January. Then there are 4 profiles of the previous days. On the right are 5 minute bars in a profile. They are gradually updated as the page goes to the right. Each profile is a half hour addition. I use this to see if I can identify patterns. I will share some features of what I look for here.
The previous day had touched the highs of a few days previously but could not trade higher and in fact built a balance area below these highs creating a relative tail. Notice that a tail should not be just single print TPOs. So the market on our day opens up below the high volume area. Another point to weakness. So you would think that we are looking to short the market - ideally at the highs that could not be breached, but it might not get that high of course. So next I look at how the day starts to develop. That means I tend not to look for trades early in the day, there is not enough profile to base my decisions on. The main point to remember with all these trades is always to buy below value and sell above value - unless the distribution has been broken - in that event you can very often trade at the POC as this becomes the final tipping point that starts a trend move. On this day you can see I marked a short trade in the second peroid (the shaded area). I would set a stop for this very close to my trade (1 point in the ES). This is because I would rather reassess the market and get in again if need be. My studies show that this creates consistent profits for me. You can see how the market fattens at the lower area - this is just asking for the market to test lower. It is a sight that I don't think you see often as a profile trader. The market does however trade higher. I place another short because this is such a golden opportunity to short the market. This time I take profits on my first trade when the market heads back towards the POC - insurance if all goes wrong - remember prediction is only guessing at the end of the day. The dashed lines show the extremes of that period of trading and help me identify ideal trade location after the day is over. The market continues to fatten and then breaks as expected. The next problem is where to liquidate the short. Watch the previous distrubution areas for this. With hinesight we can all see where I should have liquidated - however I got a bit greedy. The market started to develop so I had to take a lower profit. This is why reviewing the day is so important - it matches what you did with what you should have done. So that day would have made 8 points without commission. No bad.
The other days should be self-explanatory given my notes - The first trade was stopped out and the next was a small profit. You may see that my trading at the moment catches reversals well - but the break trade is still a problem. I must work on that as it will offer the most profit in the end.
I hope this helps a bit and I am happy to explain any other features of what I uploaded.
Thanks Bobajob for the Pdf. It is full of information. More like a puzzle I tried to put it together. I can't say I fully comprehended but I did dig into it. When I was digging it some questions came to mind.
You are saying "buy below value and sell above value" without seeing value on your charts, how do you determine where the value is?
Can you talk about this subject a little more "The main point to remember with all these trades is always to buy below value and sell above value - unless the distribution has been broken - in that event you can very often trade at the POC as this becomes the final tipping point that starts a trend move.". What do you mean unless the distribution has been broken? What I thought is, when we have double distribution, it tells us that there is a shift in market's value, value has been changed and market didn't find its new value so we don't know where the new value is yet. But again I think we can sell above value and buy below value. If market has broken down the bracket and llooking for new value below the bracket thats we can short any rally close to popular price areas from previous day.
On your first sheet, you say "should cover at C given that market wont go into cluster" before the fact how do you know that or how did you see that?
what is break trade "but the break trade is still a problem"?
Can you compare your trades on page1 and page3. what are the differences? Page1 you wanted to short it, Page3 you want to buy it, Why?
Also special thanks for explaining your 5min bars in a profile. I loved it.
Market sends us messages, but it is our job to decipher this message. I think MP is one of the good ways that appears to me. It is like a bright star shining.
Thanks in advance again.
Regards
humberto
-
Thanks
This is a bit strange I have to say. First thing is that you must respect format in if not, it won't work. Second maybe scroll in the chart areato check if the chart is not somewhere where it's not visible? And third, if it's not working you should have an error message?
If it's still not working just contact me on PM and I'll take a closer look (but should work as I've tried it with at least 30 symbols, inclunding bonds, futures and forex...).
Ryker
Hi, Ryker
I am sorry for my ignorance, I didn't mean I changed the code or anything in excel sheet you made it. What I mean was I tried to change the symbol, and tick size etc.. I think my question was how can I change the symbol. sorry for the bother again. thanks in advance
Regards
Humberto
-
Humberto - I am not looking to swing trade - the trades I take - (not actual trades at this stage I must add - just theory) are all day trades. I am trying to put together a manual of my trading techniques. Unfortunately I feel I may have to ask a small price for this info - I have put alot of effort into it - and I will bundle it with an automated version of my MP learning tool. That is nowhere near ready yet however. I will post a pdfs of a few charts that highlight how you can trade without a value area. The main point is that the entire bell curve is either an acceptance level or it is rejected - that is about as specific as MP can get. I believe if you try to employ the 70% rule you will come unstuck. My opinion of course. You have to look for very high probability trades. You may want to look for a guy called Frank Butera at BalanceTrader. He has a video course that is quick cheap all things considered. I was a little disappointed at first with the depth of the course but with retrospect I think his actually focusses on the inportant points of MP and discards the esoteric. Take a look. It is worth it.Thanks for the info bobajob.
I wish you good luck with your manual you trying to put together. I can imagine it isn't easy job. Can you elaborate the sentence "The main point is that the entire bell curve is either an acceptance level or it is rejected - that is about as specific as MP can get.", do you mean that if prices traded inside the Yesterday's bell curve and stayed there certain amount of time and it shows acceptance. Also the shape of bell curve if market traded upper half of the profile it shows higher prices shows market accepted higher prices and market valued itself for higher prices. Is that what you mean. Also thanks for the advice, I will definitely take a look at Frank Butera guy. I know maybe you think I can't shut my mouth. Yes you are right, not even underwater. I will then look forward to seeing your pdfs. I am waiting with my four eyes wild open.
Regards
Humberto
-
Ok, I joined the spreadsheet.Please note:
- You can plot many days as long as you have data (not too much because of restrictions in excel).
- This is note the last version but as I'm still working on it and have made a lot of changes in it, I can't share it for now. Probably in the near future .
Waiting for your feedbacks,
Thanks
Hi, Ryker
I thank you very much for sharing your MP excel spreadsheet.
I haven't seen many MP on ecxel but I can tell you that this is the best MP charts I have seen on excel. they are just great.
And I have to tell that the spreadsheet I downloaded, I tried to change the data and tried to create MP, I couldn't. Is there anyway to change the data and draw a new MP chart. If it is possible I will be glad to know that. Thanks again.
Regars
Humberto
- You can plot many days as long as you have data (not too much because of restrictions in excel).
-
Hi, bobajob
I am late a bit to respond. excuse my laziness.
bobajob, you surprise me again. you are saying you don't use value areas on your MP chart. I would like to know how you trade without value areas. I imagined to trade without it, I probably can trade without it but will be much harder and number of trades I take will be much lesser then normal. Very interesting. It would be more like swing trade, buying and holding for certain amount of time. I would be looking at singles and high TPO areas and buying and selling tails. Value areas come onto table when these are not presented at the market. Thats all I can think of right now. I would like to hear your trading style with MP without value areas.
Regards
Humberto
-
Hi, Nick
I downloaded your excel file. On first sheet (ES data) I didn't see MP, I think this is because I don't have a real time data feed into excel thats why I wasn't able to see MP. Correct me if I am wrong. And I have a question whenever you have a time to answer. On second sheet (daily analyze) I was able to create a MP with yesterdays data and I was amazed. But I couldn't see the Value Area numbers. I think I looked at everywhere on the sheet. If you please point me where and how I can see Value Areas I will appreciate. Thanks again for your hard work and sharing.
Best Regards Humberto
-
Hi Nick,
I don't know how to thank you. I can't tell you that when I saw your reply that you are sharing your 3 years work (easy to say) and this is so much for me. I think this is something that I don't forget. You are very nice person. I will download it right away. Thanks a million.
Best Regards
Humberto
-
Hi, Chris
thank for your fast reply.
What I am looking to do with excel spreadsheet is front running the numbers and before it happens I want to see how the MP will look like. It is kind of a projections. things that I don't see on the software. exp If I have the excel spreadsheet I can run the market price higher or lower and can see the changes in the profile before the bracket ends. Things like that would be very beneficial for my understanding of MP. Looking for your responds
Humberto
-
Hi, everybody.
First of all I want to thank you people who started this forum and all the participants that contribute.
I have a question about MP software. I want to be able to have MP on the excel spreadsheet. If anyone knows where I can find the MP code for excel I appreciate if you would share it. I have a MP software. I am looking for this learning and testing purposes. Thanks in advance.

MP on excel
in Market Profile
Posted
Hey ryker,
Yes I like to see that gray price, so I can easily see if the action is on the upper half or bottom half of the profile, I think it is necessary for me.
TPO count and MP values would be super duper feature. I was going to ask you if you can add this feature but I didn't want to ask to much, you already share your hard work. I was kinda afraid to ask.:o If you can add this features will be very much appreciated.
Thanks in advance
Regards
Humberto