
Welcome to the new Traders Laboratory! Please bear with us as we finish the migration over the next few days. If you find any issues, want to leave feedback, get in touch with us, or offer suggestions please post to the Support forum here.


szubaark
-
Content Count
41 -
Joined
-
Last visited
Posts posted by szubaark
-
-
The $25K Rule to daytrade SPY will eliminate 90% of people who bought the book and on this forum. Back to the Eminis LOL
-
yes bottom of the bar with the arrow. the chart i posted is end of day
-
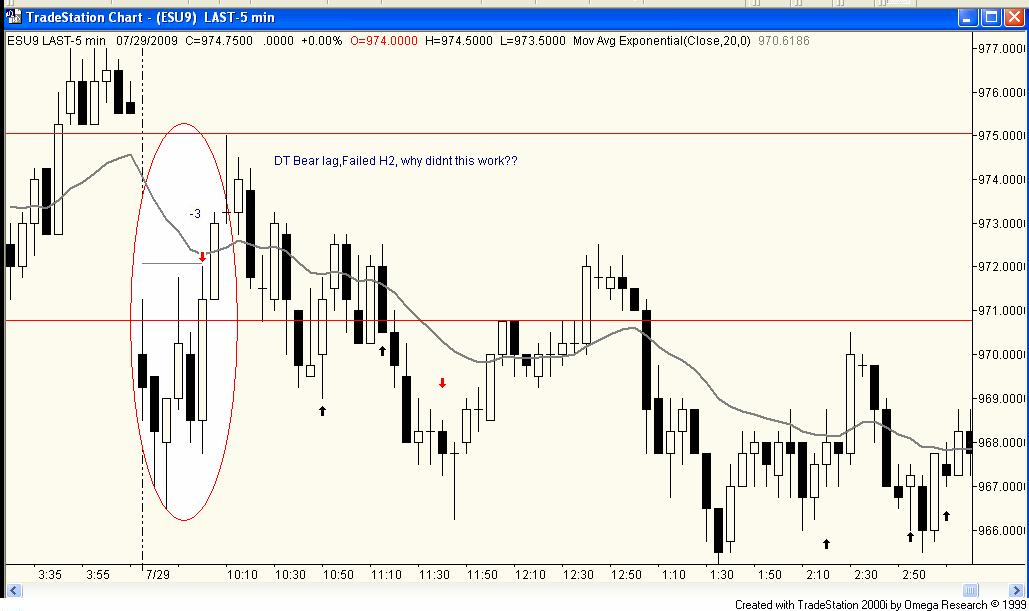
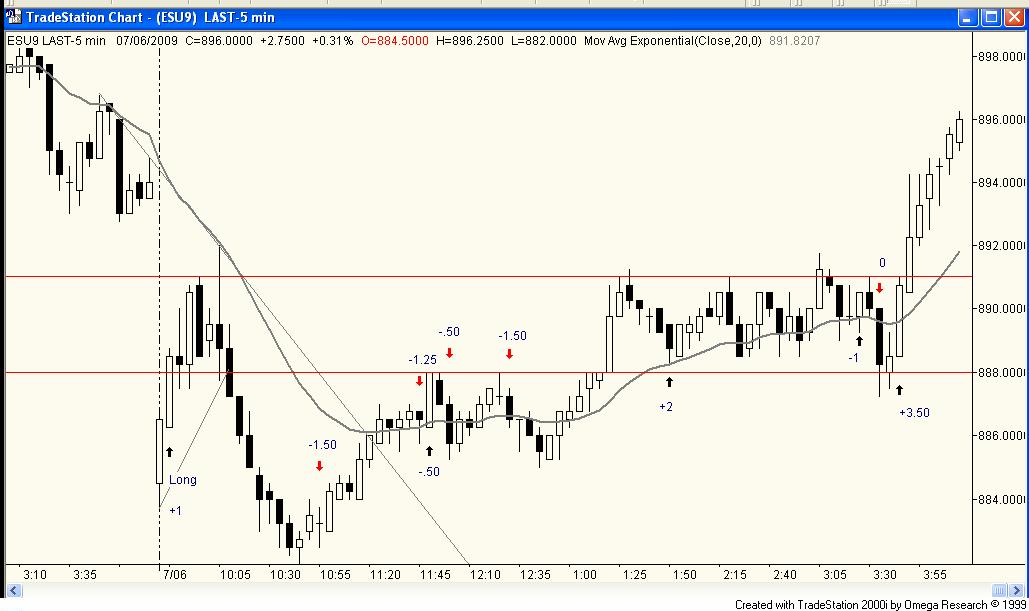
I took this Open trade. My reason was it was a Double top Bear Flag, 2nd attempt to close gap,and we were below EMA..why did this FAIL?Entry was 5th Bar (9:55 Eastern candle)
took -3 Stop ouch
sorry it was 10am the Entry Bar (L2)
-
I took this Open trade. My reason was it was a Double top Bear Flag, 2nd attempt to close gap,and we were below EMA..why did this FAIL?
Entry was 5th Bar (9:55 Eastern candle)
took -3 Stop ouch

-
"1. Volume: Brooks does not emphasize volume much. A BIG MISS in my book.
"
Actually he does talk about Volume, but its using the 1minute on rare occasion to confirm a Climax of a Bottom or Top.
I never watched Volume so thats probobly good, one less thing to worry about and cloud my reactions.
-
Thanks ACS kiwi hal
Yes sometimes i focus too much on the Setups and miss the big picture.
That Double Top at Open threw me off as i thought we tried TWICE to gi higher and Failed so felt Sellers were in control. But once gap closed, they took it higher, in a slow controlled upmove. than the BW after the 2pm Higher High attempt caused most of my losses. That BW made sure only strong hands survived and got in on the upcreep to new Highs on day.
-
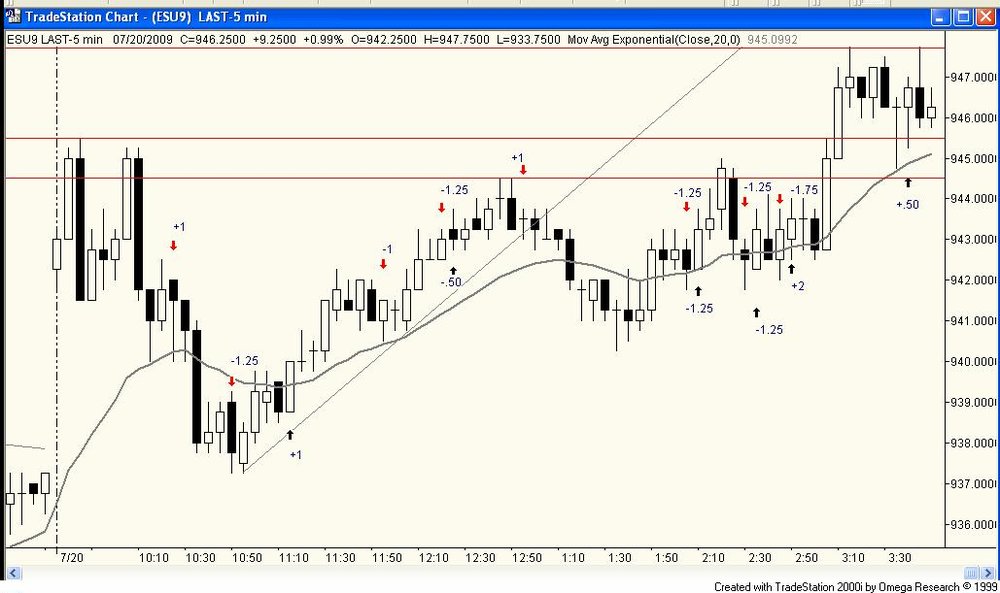
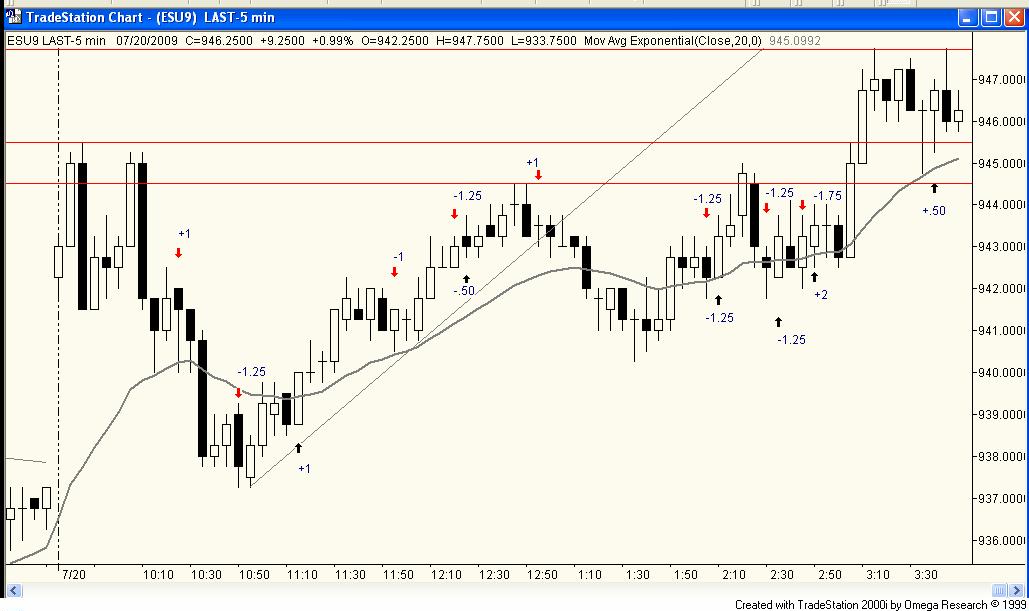
7/20
5wins 9 losses Total -6 ES Points
After 2 months so far, im not getting anywhere with this "Al" method.
Im getting 4 Ticks but then -1.50 to -2 Stops are needed to catch the 4 ticks. AND U DO NEED THE FRIKIN 2 PT STOP.I can have 4 out of 5 winning days in a week and then One bad day will make me negative for day. Cherry picking these setups is a stressful way to live and even then these setups are 50/50 i feel. I guess i just cant make this work in a REAL Trading environment. At end of day marking up the charts, sure thats easy.
Think Ill stop posting charts for a while.
-
Trade 1 was an L1 short. Felt like a breakout pullback from LOD, certainly didn't trade like one. Came after a doji, any other reasons not to take this trade? (Traders took the H2, and the trapped L1s [myself] covered and brought the market back up).2 - breakout pullback, H1, reversal bar failure, micro trendline break.
3 - H1, probably not the best trade of the day, but with trend and looked good enough to me.
4 - trendline broke, looking for two legs down, H2 at HOD, after a doji
In theory I could have taken the reversal bar short on the next bar since that is where the longs exited who just brought the market up.
My question is: Is the HOD a higher high test after a trendline break?
I see we BOTH got caught on Trade #1. sure looked like a good setup. Loys of people got trapped as u can see by the size of the next bar
Trade#2 i didnt take. Was afraid of High of Day BW
-
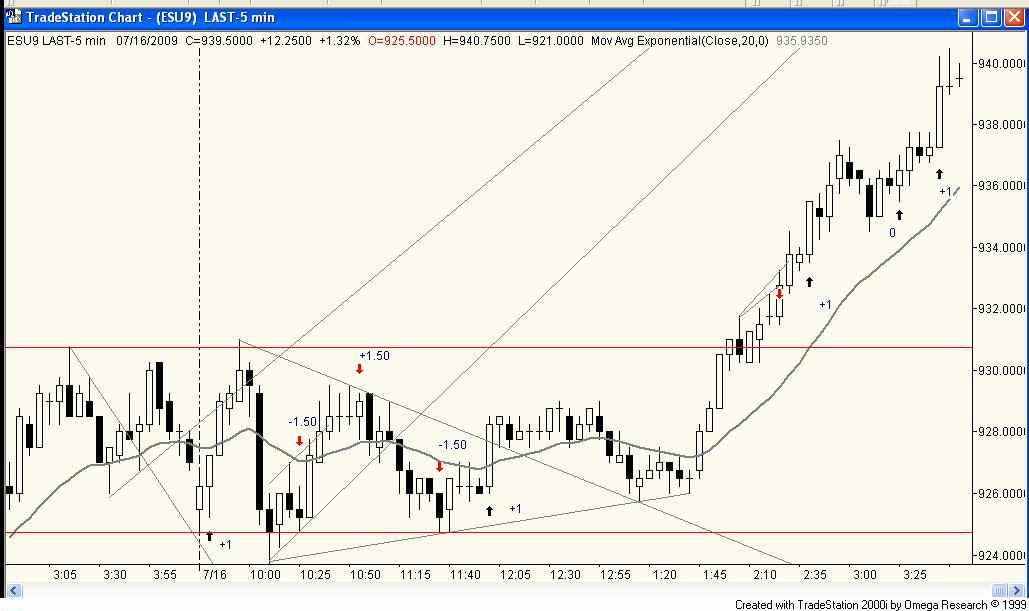
7/16
8 trades 5 W 2L 1 BE
Daily Goal reached
4th trade was a Failed Final Flag that i missed
Longs worked really well after the 2pm breakout from Range. lots of people didnt catch it as everyone was talking today will be Small Range Day. WRONG!

-
ACS yes those have been working lately. Almost any trade above/below first Open bar gives you scalpers profit. Lets see when it Stops working LOL
-
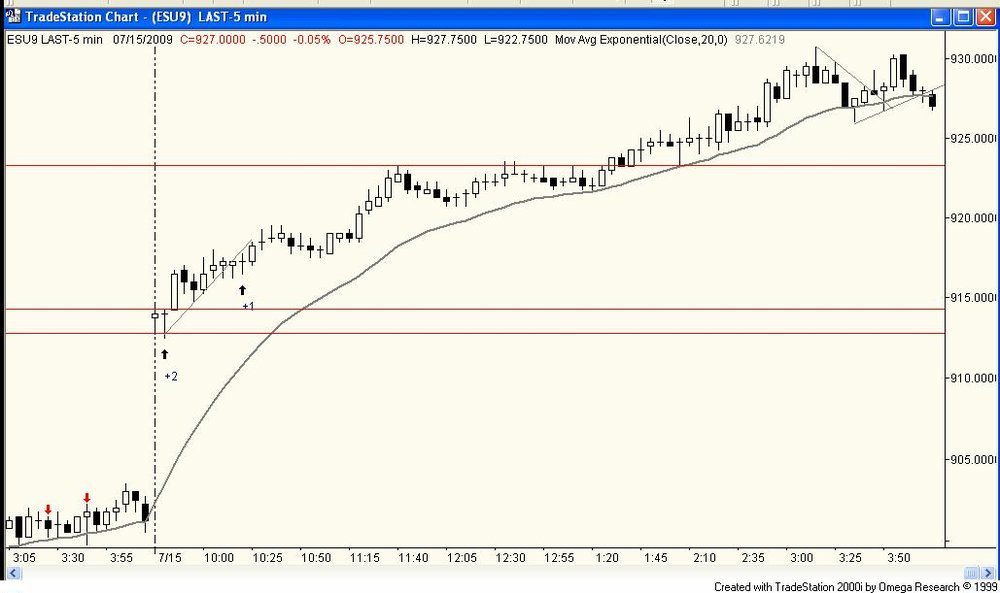
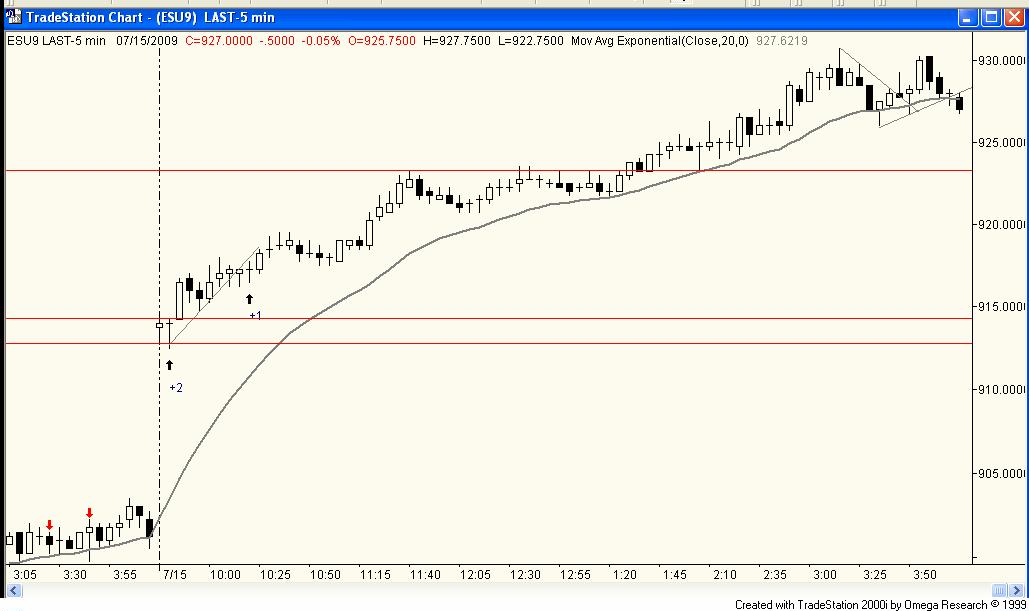
7/15 trend from open type day.
2 Trades 2 Wins 0 Losers
First Trade was Gap Up B/O Trade for +2.
Second Trade was "ii" for +1
I stopped after that. I realized this was a strong trend day with the Huge Gap Up and Weak Pullbacks. We dont many like this, but if your read i right, milk it hard.
-
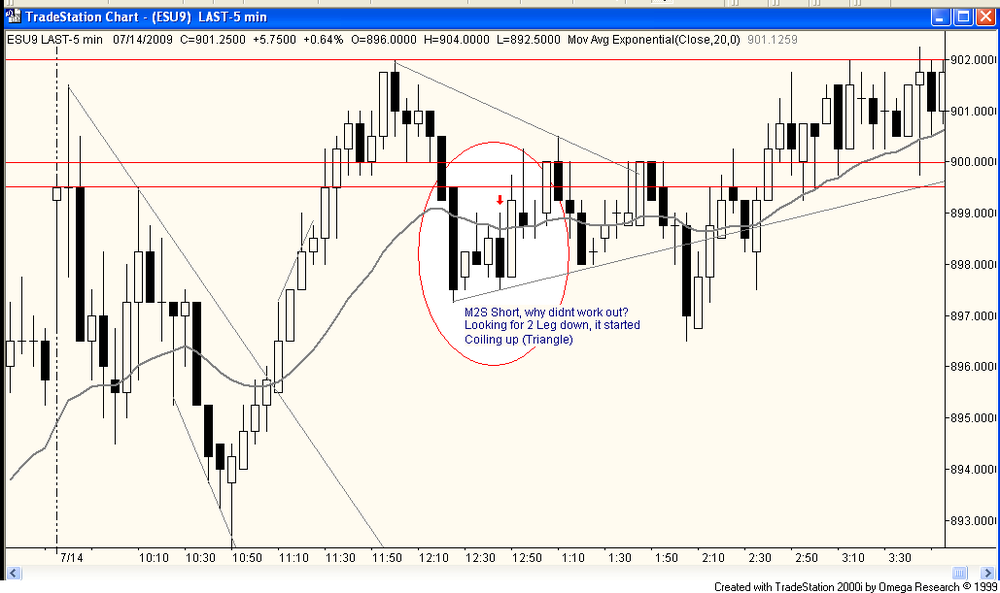
I took this M2S Short (2nd attempt to break above EMA) After a Strong downmove off the High expecting a 2nd Leg Down. ALso Double Top Bear Flag, sucker went up for -2.25 Stop on me. It started coiling up for hours after that.
-
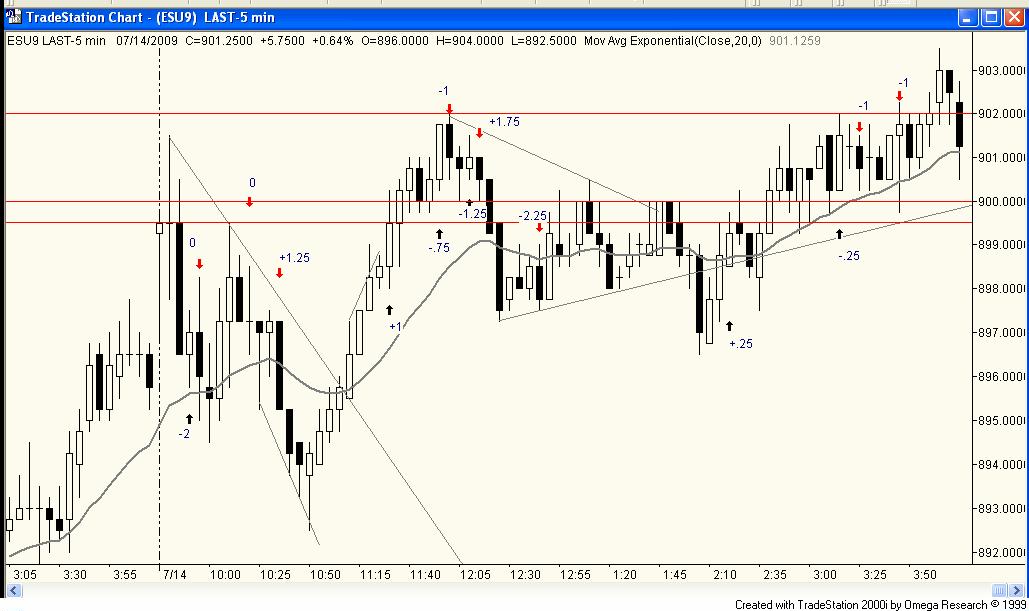
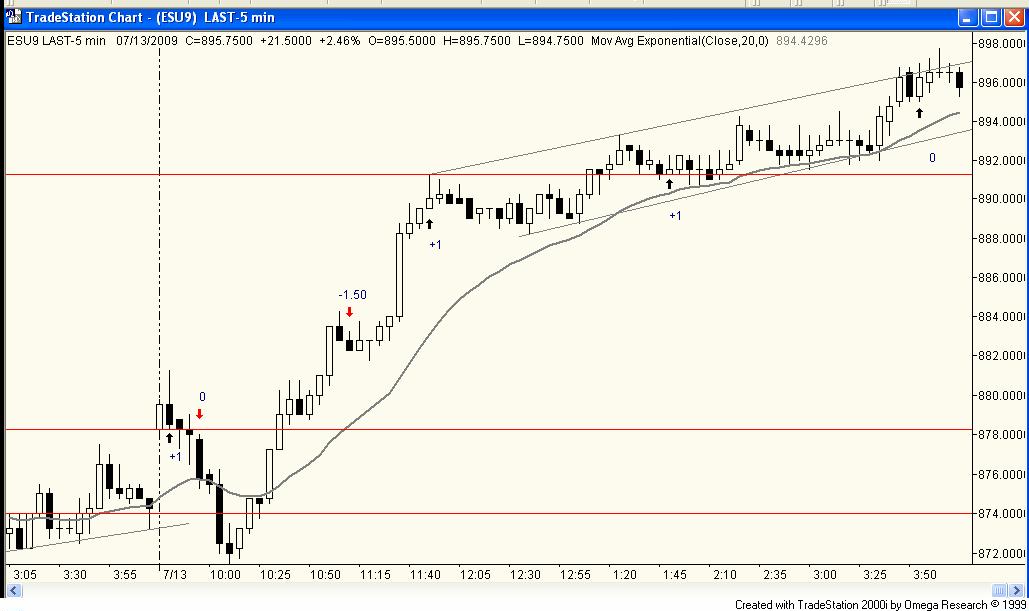
7/14
Not a good day.
Total 14 trades 4W/8l/2BE
Overtraded as i had a bad start took a Hit for -2 right at Open. Had a lot of Failed +3 Tick setups. Got frustrated at end of day and started forcing a few trades. Again today, the Major move of the day started with H1 with no frikin second chance to get Long. Right at Low we just started going higher 11 Green candles in a Row with no LL to get in.
so -6 Pts for day

-
I also noticed our candle setups are different sometimes. Some will show Doji inside candle as 10 am candle (Eastern) and im showing small red candle with lower low. So each Data Provider will Print differant candles sometimes.
-
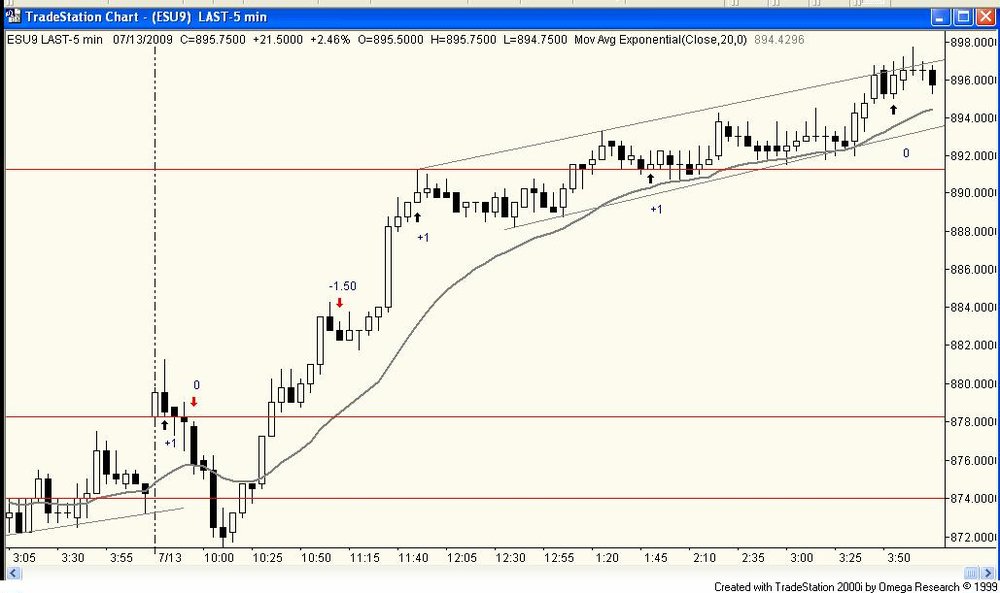
6 trades Total
3 winners 2 Even 1 loser Total +1.50
I coudnt call this strong trend from open because of the Selloff at Open..that threw me off and I kept lookign for Shorts and took the 3rd Short L2 for a Open High test also Prior Flag around Open high showed me this could be Failed Final Flag, but they just Ran it Parabolic. that was my only Loss for day -1.50
A lot of people were confused with todays action as was i.
we had a total of 6 Push Ups..amazing,usually we get 2-3 then 2 leg pullback..this Parabolic upmove sucked.
Like Melator said most of the Long signals after 12 (the move was done) were in BW.
-
Most of us here trade ES.
-
Highlighter area..I had Short there real time i posted
3 Pushes Up AGAIN (#2 Push was possible DT Bear Flag) but it DB with previous swing low for another push up #3... IF we bounced AGAIN here at EMA we would re-test day highs most likely
As you trade this style you will realize there are a lot of naunces to this.
At the end you just trying to make it your OWN Style.
-
3 trades.. +3 I stopped after this so i woudnt give it back.
All Targets Reached withis first hour
Brutal Chop at day high, glad i stayed away from it.
-
Here is a chart of the ZN today.I marked this up, after 3:00PM EST.
That being said, those trades are all trades that were in my plan.
Was wondering if anybody had read the remarks Brooks had about trading bonds and would care to share.
Nice trades Maletor. im having hard enough time with ES, so wont trade Bonds. I hope you keep posting your trades trading Bonds.
I remember Al said that they go into BW a lot.
-
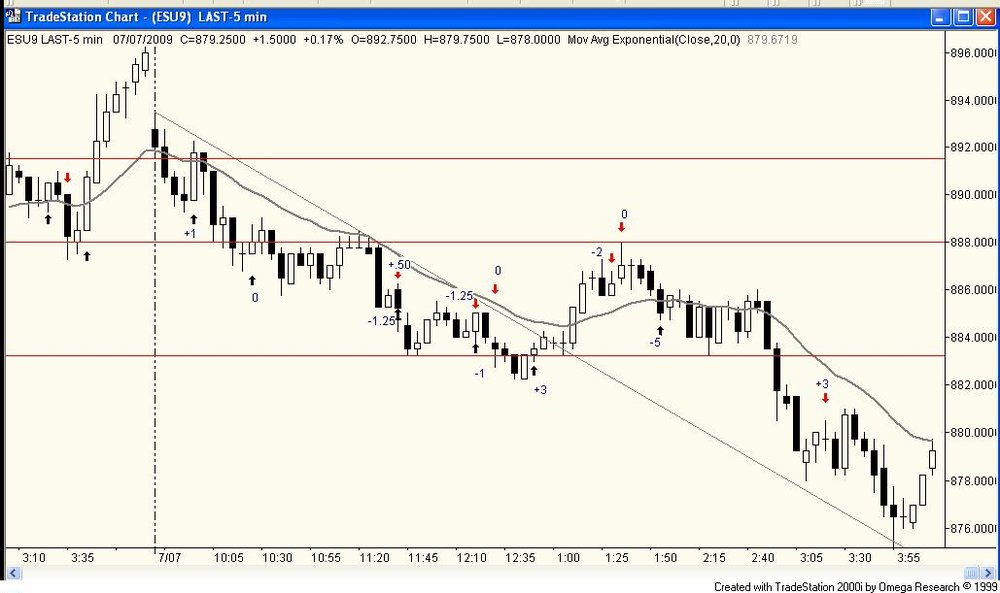
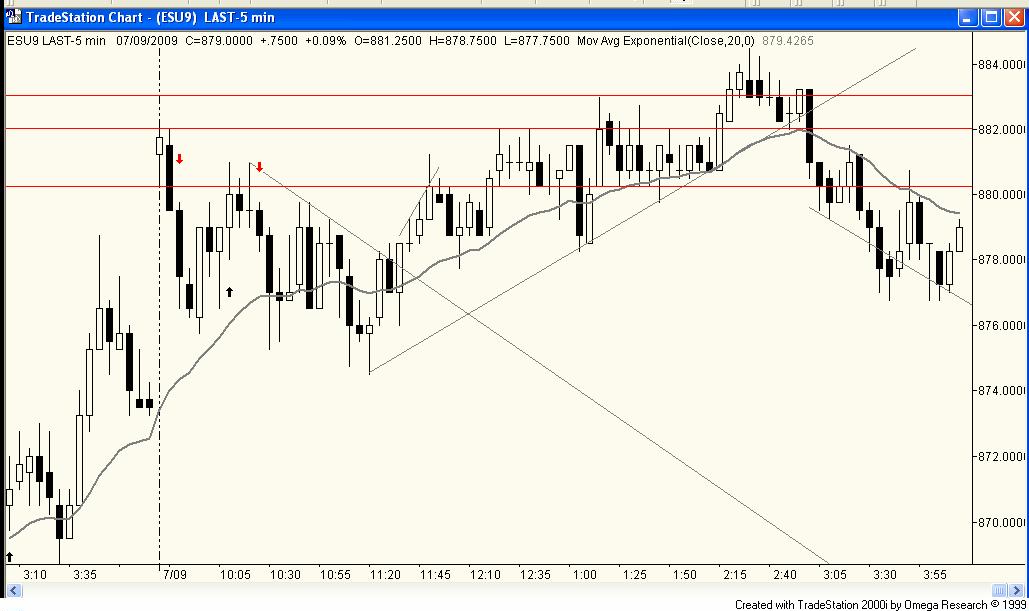
7/8
Total 10 trades.. +4.25 - $50 commissions=+3.25
coudnt get Scalpers Profit at Open (first hour or so) because of of the Tight Range even thought i took entries at Tops and Bottoms.
After we broke out of Range i Realized we are in downtrend now. So held Shorts for Longer. What reall helped me was my "intuition" Long at end for +6 after the DB Reversal and 4 days of non stop selling, we were due for a POP.
This is real trades i took so they wont look as pretty as some of the end of day charts that get marked up and posted here LOL

-
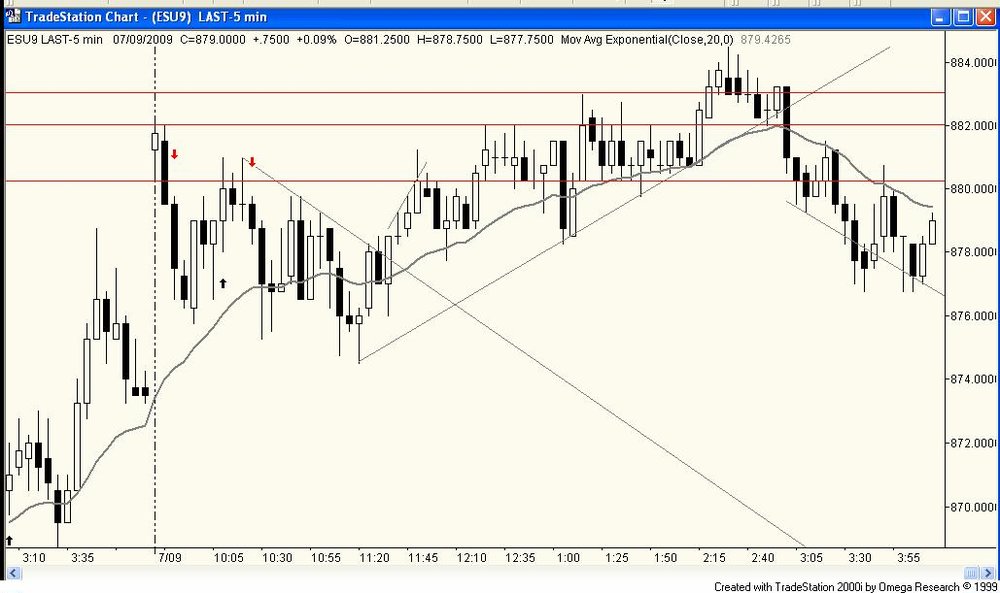
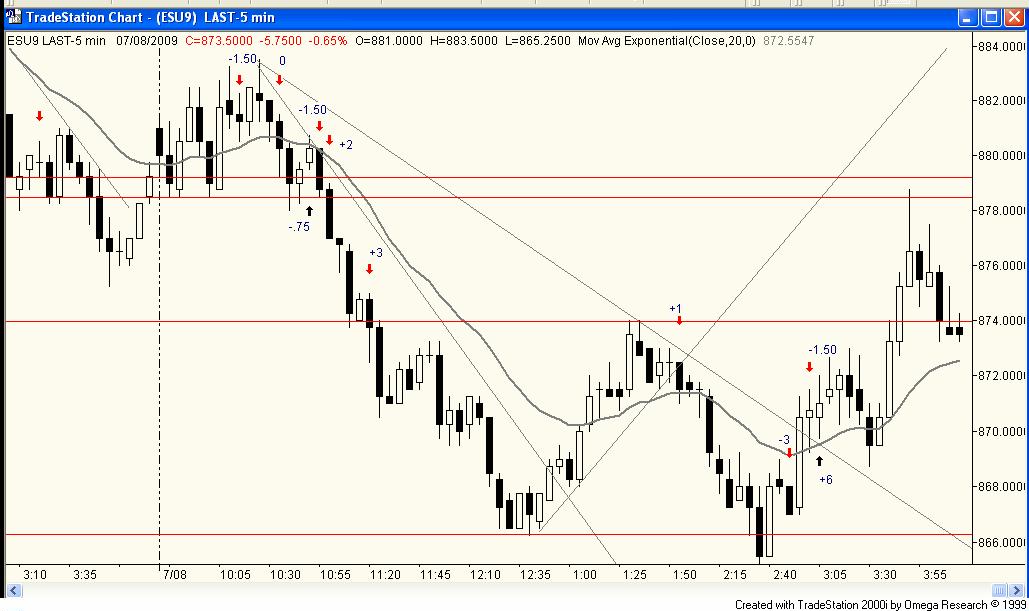
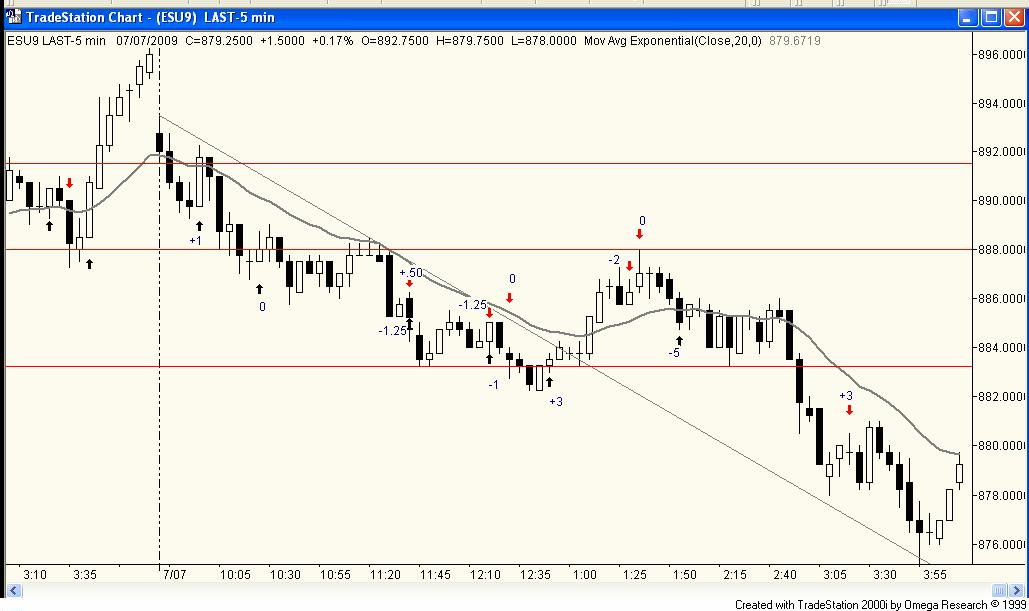
7/7
Total 12 trades for -3.50
On one trade Price never went below prior candle low but BID Flashed and i got filled anyways, got Mad -2 Loss
After the consolidation around 1:35 i thought market is trying to put bottom so got stubborn and rode my Long for a -5 Loss.
Another tough day for me. This is REAL Trades i took. Not marked up end of day crap that i see a lot being posted here. REAL TIME trading and end of day are not same.
-
"Here is another example on the current 15 minute EURUSD: If EURUSD trades below the back line, price will have printed a High, a low, a lower high and a lower low. I would sell a break of that line. If price breaks and holds below that black line, I'd expect it to reach at least the first blue line. Will it? Maybe. Maybe not. I do not know. But, I would expect it to reach that line. If it breaks and holds below that blue line, I'd expect price to reach the next blue line, and so on."
What do you consider "break" and what "holds"? Do we have to Close below the black line for it to break? or just Poke through it? Price doesnt just Break S/R. It will usually do fakeouts back and forth LOL, especially low Volatility summer days
-
1 contract
$12.50 AFTER Commissions -$40
10 trades 3 Winners, 7 losers
Got caught in Chop(In hindsight). Chop(Barbwire) continues to be my biggest Problem. Its EASY TO recognize AT END OF DAY, but real time its Hell.
No setup to catch the morning Drop UNLESS u chased. Big moves usually happen with no clear setups.. nature of the Beast
-
Nice. I see you let your Profits run if possible.
U trading 1 contract or 2?
thanx

Futures I Trade Show & Brooks Book
in The Candlestick Corner
Posted
This book will be easy or hard to read depending on how much Hard Screen Time you already put in to this.
Wish it was easier also, but its now.